
AZO AutoZone, Inc. Common Stock
NYSE · Retail · Voir sur SEC EDGAR ↗ 10-K/10-Q Oct 26, 2026AZO Aperçu de l'action Prix, capitalisation boursière, P/E, EPS, ROE, dette/capitaux propres, fourchette sur 52 semaines
AZO Graphique du cours de l'action OHLCV quotidien avec indicateurs techniques — panoramique, zoom et personnalisez votre vue
La granularité des barres s'adapte à la période sélectionnée — survolez le graphique pour voir l'ouverture/le maximum/le minimum/la clôture d'une barre.
| Date ex-dividende | Division | Type |
|---|---|---|
| 21 avril 1994 | 2-for-1 | Avant |
| 3 février 1992 | 2-for-1 | Avant |
À propos de AutoZone, Inc. Common Stock Présentation de l'entreprise depuis Wikipedia
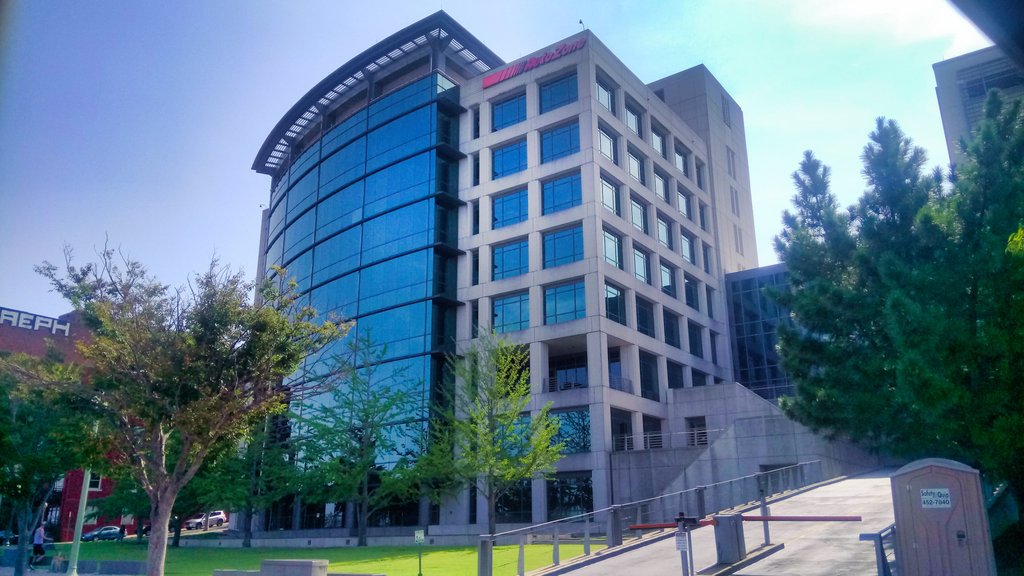
AutoZone, Inc., doing business as AutoZone (and formerly known as Auto Shack from 1979 to 1987), is an American retailer of aftermarket automotive parts and accessories, the largest in the United States. Founded in 1979, AutoZone has 7,140 stores across the United States, Mexico, Puerto Rico, Brazil, and the US Virgin Islands. The company is based in Memphis, Tennessee.
Company History
Auto Shack
AutoZone was founded by J.R. "Pitt" Hyde III as the auto parts division of Malone & Hyde, a Memphis-based wholesale grocer founded by his family. After joining the board of directors at Wal-Mart in 1978, Hyde explored new ways to diversify his family's business. On July 4, 1979, the first store opened in Forrest City, Arkansas under the name of Auto Shack. Doc Crain was the store's first manager. Sales that first day totaled $300.00. Despite not knowing much about cars, Hyde's vision was to offer good customer service, and everyday low prices, in a clean, well designed, and brightly lit shop.
By 1980, the chain expanded to eight stores across five states, and then to 20 stores the year after. In 1981, the company opened its first Express Parts Service warehouse in Memphis, allowing customers to order hard to find parts not found in most stores. By 1983, Auto Shack opened its 100th store in Weslaco, Texas.
By 1984, it had 190 locations across 13 states. In 1984, Malone & Hyde was acquired in a management buyout that included Hyde, investment firm Kohlberg Kravis Roberts & Company, and other executives, taking the public company (including Auto Shack) private. Total stores were 194 in 13 states.
In 1985, Peter Formanek was named president. He oversaw the auto parts firm's daily operations and worked on growth strategy. In 1986, Auto Shack was spun off from Malone & Hyde, with Hyde and Formanek remaining in charge. Malone & Hyde was later sold to Fleming Companies in 1988.
By 1986, expansion had made the company grow into a large store chain across the South and the Midwest. Auto Shack debuted its Duralast auto parts line, starting with alternators and starters. The Loan-A-Tool program was also introduced, allowing customers to borrow specialty tools. The fourth distribution center in Greenville, South Carolina opened. The total number of stores was 339 in 15 states.
AutoZone
In 1986, Auto Shack was sued by Radio Shack for trademark infringement. While a court initially ruled in favor of Auto Shack, Radio Shack ultimately won on appeal. In 1987 Auto Shack announced plans to change its name to AutoZone. The first AutoZone store was in Enid, Oklahoma. The company introduced an electronic catalog used to look up parts, check warranties, and view inventory. The total number of stores was 459 in 16 states.
1990s
In 1991, Hyde and KKR took the company public. Its stock began trading on the New York Stock Exchange using the ticker symbol "AZO." KKR initially held a majority of the stock, but began selling off its shares by 1993.
In 1994, AutoZone began using satellites to facilitate communication between stores and the corporate office. Sales hit $1.5 billion.
In 1995, AutoZone opened its 1,000th store in Louisville, Kentucky. Also, the Duralast trademark made its debut with the Duralast and Duralast Gold batteries. Total of stores is now 1,143 in 26 states.
In 1996, the company launched its website. It also spent $56 million to acquire ALLDATA, a software company based in Elk Grove, California that provides automotive diagnostic and repair information.
Company founder Pitt Hyde retired as chairman and CEO in 1997. John Adams became the new chairman and CEO. AutoZone made several acquisitions in 1998. In January, it acquired 112 Auto Palace stores in six states for $55 million. It also bought 43 TruckPro L.P. locations in May and 560 Chief Auto Parts stores across in June. In October, AutoZone bought 100 Express auto parts stores from Pep Boys. The company established its first international location when it opened a store in Nuevo Laredo, Mexico in December 1998. By January 1999, it announced plans to open additional stores in the country. AutoZone closed the 1990s by debuting at the Fortune 500 list in 1999.
2000s
In 2000, AutoZone opened a data processing and support center, known as DataZone, in Chihuahua, Mexico. In the years to come, new departments, including Finance, Customer Service, IT, Merchandising, and Store Technical Support would be added.
In January 2001, Steve Odland was named chairman and CEO, replacing Adams. That May, the company opened its 3,000th store in Cicero, Illinois. In December, AutoZone sold TruckPro to Paratus Capital Management.
In 2002, AutoZone developed a network of "hub, feeder, and satellite" stores to have more product in the market area, while reducing inventory investment. Sales hit $5.33 billion.
In 2003, the Duralast tool line was introduced. In April, Midas announced it was exiting the parts distribution business and would instead contract AutoZone to be its official distributor. AutoZone de Mexico opens the first DC in Nuevo Laredo, Mexico. Total stores number 3,219 in 48 states and 49 in Mexico. In April 2004, AutoZone acquired 12 stores from ABC Discount Auto Parts, an auto parts chain headquartered in Cherry Hill, New Jersey. That year, founder J.R. "Pitt" Hyde III was inducted into the Automotive Hall of Fame.
In 2005, William C. Rhodes III was named president and CEO. Steve Odland left to become the chairman and CEO of Office Depot. AutoZone opened its first Puerto Rican location in Bayamon.
In June 2007, Bill Rhodes was also made chairman. The company also opened its 4,000th store in Houston, Texas. That year, AutoZone introduced its Z-net electronic parts catalog and repair database. The system replaced the company's original text-based catalog.
2010s
In May 2010, AutoZone announced a new “Buy Online Pick-Up In-Store” service. The in June, the company unveiled a new mobile app that provides iPhone users access to vehicle repair guides, product catalogs, pricing information, and store locations. On December 15, 2011, ALLDATA LLC, an operating unit of AutoZone, expanded its direct presence in Canada to better serve its growing customer base.
On August 17, 2012, AutoZone expanded into Alaska, the company's 49th state, by opening its 5,000th store in Wasilla, Alaska. The company announced in December that it had acquired online automotive retailer AutoAnything.com. In 2012, AutoZone entered the Brazilian market by opening a store in Sao Paulo, Brazil.
In December 2012, AutoZone purchased AutoAnything.com, an e-commerce leader in aftermarket automotive parts based in San Diego, California. In 2014, the company acquired Interamerican Motor Corporation, a distributor of imported replacement parts. The deal gave AutoZone access to European and Asian markets. By November 2015, the company had expanded its hub stores to include mega hubs in Atlanta, Chicago, Los Angeles, Memphis, and New Jersey.
Between 2012 and 2016, AutoZone's stock valuation doubled in value. By April 2017, AutoZone had been the largest retailer of automotive parts in North America for three consecutive years. As of August 2017, AutoZone had 5,465 locations in the United States, 524 locations in Mexico, and 46 locations in Brazil, for a total of 6,035. The company opened its 6,000th store, in Memphis, Tennessee, on August 25, 2017.
In February 2018, AutoZone announced it had sold IMC to Parts Authority and AutoAnything to Kingswood Capital. In September, the company introduced next-day home delivery on online orders in 83 US markets. The service included 100,000 products and expanded to 95 markets by the end of the year. On October 22, 2018, Pitt Hyde announced that he would be stepping down from AutoZone's board of directors. By June 2019, the company had 174 hub stores and 28 mega hubs, with plans to continue expanding.
2020s
In March 2020, during the early days of the COVID-19 pandemic, AutoZone introduced free curbside pickup for all buy online and pickup in store orders. In late May, two AutoZone stores were destroyed by arson during the George Floyd protests in Minneapolis–Saint Paul. By September 2021, the company had 58 mega hubs and announced plans to open 20 more over the next year.
In 2023, after years functioning as a shared services center, DataZone was renamed to AutoZone Business and Technology Store Support Center. In June 2023, Rhodes announced his intention to step down as president and CEO in January 2024. Phillip Daniele was promoted to president and CEO, with Rhodes remaining as executive chairman. By May 2024, AutoZone opened over 100 mega hubs stores.
In October 2026, an AutoZone store in White Plains, New York unionized under the United Auto Workers, the first AutoZone retail location to unionize.
Corporate affairs
AutoZone is incorporated in the state of Nevada.
Headquarters
Since October 1995, AutoZone has been headquartered in its J.R. Hyde, III Store Support Center (SSC), a 270,000-square-foot (25,000 m2), eight-story building in Downtown Memphis, Tennessee. As of 2013 there were over 1,200 employees there.
The building has the capability to withstand a 9.0 magnitude earthquake because it has a special base isolation system that had a price tag of $950,000.
Private labels
AutoZone sells lead-acid car batteries (manufactured primarily by Johnson Controls) and other automotive parts using its Valucraft and Duralast private label brands. AutoZone also sells tools under the Duralast brand.
Retail stores
AutoZone's 7,657 retail outlets as of August 30, 2025 throughout the United States, Mexico and Brazil stock a variety of aftermarket parts as well as some OEM parts. All AutoZone stores are corporately owned; the company does not have franchise operations.
Sponsorships
In 2004, AutoZone celebrated its 25th anniversary and announced a corporate sponsorship agreement with auto racing association NASCAR.
In 2007, AutoZone sponsored Kevin Harvick and Timothy Peters in the NASCAR Busch Series.
AutoZone holds the naming rights to the downtown Memphis baseball stadium that is the home of the Memphis Redbirds of the Pacific Coast League. The company also sponsors the AutoZone Liberty Bowl. The AutoZone Liberty Bowl, alongside the College Football Playoff Foundation donated $250,136.03 to the St. Jude Children's Research Hospital. The AutoZone Liberty Bowl awarded 2018's Distinguished Citizen Award to Priscilla Presley.
They are an official sponsor of Bellator MMA, the world's second largest Mixed Martial Arts promotion.
Lawsuits
State prosecutors and the district attorneys of San Bernardino, Monterey, San Diego, and San Joaquin counties sued AutoZone in 2005, accusing the company of mishandling used motor oil and overcharging customers. AutoZone agreed to pay $1.5 million to settle the case.
AutoZone faced a lawsuit for gender discrimination in which the plaintiff alleged that men treated her differently when she was promoted and that she feared revealing a pregnancy to her superior. When the pregnancy was discovered, she alleges that her district manager pressured her to step down from her position. She was demoted in February 2006 and fired in November 2011. The jury on the case ruled in 2014 in favor of the plaintiff, awarding her $185 million in punitive damages as well as approximately $873,000 in back wages. AutoZone has announced its intention to appeal the verdict. The Wall Street Journal's Jacob Gershman suggested that the verdict would be scaled back.
In 2018, AutoZone paid $3.3 million to settle a lawsuit stemming from a 2016 crash that killed three after an AutoZone-owned truck rear-ended a stalled vehicle. The suit alleged that AutoZone was negligent in training the driver of the truck.
A Georgia woman was fired after a customer insulted her and used multiple racial epithets against her. In 2018, she filed a lawsuit against the company for violating her civil rights, alleging that the district manager told her to "suck it up."
In June 2019, AutoZone entered into an $11 million settlement against with the State of California to resolve allegations that the company had violated state laws governing hazardous waste, hazardous materials, and confidential consumer information. AutoZone is charged with illegally disposing of millions of hazardous waste items, including used motor oil and automotive fluids, at landfills not authorized to accept hazardous waste.
Source : Wikipedia (Anglais), CC BY-SA 4.0 · Voir sur Wikipedia ↗
Performance sur 10 ans Tendances du chiffre d'affaires, du bénéfice net, des marges et du BPA
Valorisation Ratios P/E, P/S, P/B, EV/EBITDA — l'action est-elle chère ou bon marché ?
| Métrique | Tendance sur 5 ans | AZO | moyenne 5 ans | Médiane des pairs | Verdict |
|---|---|---|---|---|---|
| P/E (TTM) | 20.6moyenne 5 ans ≈21.3 | ≈21.3 | 16.5 | Surévalué | |
| P/S (TTM) | 2.5moyenne 5 ans ≈2.8 | ≈2.8 | 0.4 | Surévalué | |
| P/B (MRQ) | -20.3moyenne 5 ans ≈-14.5 | ≈-14.5 | · | · | |
| Price / Cash Flow (Cours / Flux de trésorerie) | 15.7moyenne 5 ans ≈16.6 | ≈16.6 | 15.4 | Juste valeur | |
| EV / Revenue (VE / Chiffre d'affaires) | 2.9moyenne 5 ans ≈3.2 | ≈3.2 | · | · | |
| PEG Ratio (Ratio PEG) | ≈2.1 | · | · | · |
La médiane des pairs est calculée sur une base standardisée par métrique et peut ne pas toujours correspondre à la base TTM/MRQ indiquée pour cette action.
Rentabilité Marges brutes, d'exploitation et nettes ; ROE, ROA, ROIC
| Métrique | Tendance sur 5 ans | AZO | moyenne 5 ans | Médiane des pairs | Verdict |
|---|---|---|---|---|---|
| Marge Brute (TTM) | 52.3%moyenne 5 ans ≈52.4% | ≈52.4% | 17.8% | Premier rang | |
| Marge d'exploitation (TTM) | 18.3%moyenne 5 ans ≈19.6% | ≈19.6% | 5.0% | Premier rang | |
| EBITDA Margin (Marge EBITDA) | 21.7%moyenne 5 ans ≈22.6% | ≈22.6% | 5.1% | Premier rang | |
| Marge avant impôts (TTM) | 16.0%moyenne 5 ans ≈17.5% | ≈17.5% | 4.1% | Premier rang | |
| Marge nette (TTM) | 12.6%moyenne 5 ans ≈13.9% | ≈13.9% | 3.1% | Premier rang | |
| ROA (TTM) | 12.6%moyenne 5 ans ≈15.0% | ≈15.0% | 6.8% | Premier rang | |
| ROE (TTM) | -87.0%moyenne 5 ans ≈-68.5% | ≈-68.5% | 14.9% | Faible | |
| ROIC | 44.8%moyenne 5 ans ≈70.5% | ≈70.5% | 28.0% | Premier rang |
Santé financière Dette, liquidité, solvabilité — solidité du bilan
| Métrique | Tendance sur 5 ans | AZO | moyenne 5 ans | Médiane des pairs | Verdict |
|---|---|---|---|---|---|
| Debt / Equity (Dette / Capitaux propres) | -3.6moyenne 5 ans ≈-2.3 | ≈-2.3 | 0.3 | Faible endettement | |
| Ratio de liquidité (MRQ) | 0.9moyenne 5 ans ≈0.8 | ≈0.8 | 0.9 | Faible liquidité | |
| Quick Ratio (Ratio de liquidité réduite) | 0.1moyenne 5 ans ≈0.1 | ≈0.1 | 0.2 | Faible liquidité | |
| Dette à long terme / Capitaux propres (MRQ) | -3.6moyenne 5 ans ≈-2.3 | ≈-2.3 | 0.4 | Faible endettement |
Croissance Croissance du chiffre d'affaires, du BPA et du bénéfice net : Année/Année, TCAC 3 ans, TCAC 5 ans
| Métrique | Tendance sur 5 ans | AZO | moyenne 5 ans | Médiane des pairs | Verdict |
|---|---|---|---|---|---|
| Revenue YoY (Chiffre d'affaires YoY) | 7.4%moyenne 5 ans ≈6.8% | ≈6.8% | · | · | |
| Revenue CAGR 3Y (CAGR du chiffre d'affaires 3 ans) | 5.2%moyenne 5 ans ≈7.5% | ≈7.5% | · | · | |
| Revenue CAGR 5Y (CAGR du chiffre d'affaires 5 ans) | 6.8% | · | · | · | |
| EPS YoY (BPA Année/Année) | 5.3%moyenne 5 ans ≈10.2% | ≈10.2% | · | · | |
| Net Income YoY (Bénéfice net YoY) | 3.0%moyenne 5 ans ≈3.6% | ≈3.6% | · | · | |
| EPS CAGR 3Y (TCAC BPA 3 ans) | 4.9%moyenne 5 ans ≈12.7% | ≈12.7% | · | · | |
| EPS CAGR 5Y (TCAC BPA 5 ans) | 9.9% | · | · | · | |
| Net Income CAGR 3Y (TCAC Bénéfice net 3 ans) | 0.58%moyenne 5 ans ≈5.5% | ≈5.5% | · | · | |
| Net Income CAGR 5Y (TCAC Bénéfice net 5 ans) | 3.5% | · | · | · |
Efficacité du capital Rotation des actifs, rotation des stocks, rotation des créances
| Métrique | Tendance sur 5 ans | AZO | moyenne 5 ans | Médiane des pairs | Verdict |
|---|---|---|---|---|---|
| Asset Turnover (Rotation des actifs) | 1.0moyenne 5 ans ≈1.1 | ≈1.1 | 1.6 | Faible | |
| Receivables Turnover (Rotation des créances) | 28.5moyenne 5 ans ≈33.0 | ≈33.0 | 42.6 | Faible | |
| Revenue / Employee (Chiffre d'affaires annuel ÷ employés (effectif déclaré, yfinance). Dérivé — pas un concept SEC-XBRL stocké.) | ≈$260.8K | · | · | · |
valeur · ≈ moyenne 5 ans · médiane du secteur · verdict par rapport à la médiane
Historique des bénéfices BPA réel vs estimation, surprise %, taux de succès, prochaine date de publication des résultats
| Période | Rapport | EPS Actual | BPA est. | Surprise |
|---|---|---|---|---|
| 30 septembre 2026 | Sep 22, 2026 | $56.05 | $54.40 | 3.0% |
| 30 juin 2026 | $38.07 | $36.65 | 3.9% | |
| 31 mars 2026 | $27.63 | $27.40 | 0.84% | |
| 31 décembre 2025 | $31.04 | $32.83 | -5.5% | |
| 30 septembre 2025 | $48.71 | $51.30 | -5.1% | |
| 30 juin 2025 | $35.36 | $37.49 | -5.7% |
Fondamentaux complets Tous les indicateurs par an — compte de résultat, bilan, flux de trésorerie
Compte de résultat
| Métrique | Tendance | 2026 | 2025 | 2024 | 2023 | 2022 | 2021 | 2020 | 2019 | 2018 | 2017 | 2016 | 2015 |
|---|---|---|---|---|---|---|---|---|---|---|---|---|---|
| Revenue | $20.34B | $18.94B | $18.49B | $17.46B | $16.25B | $14.63B | $12.63B | $11.86B | $11.22B | $10.89B | $10.64B | $10.19B | |
| Cost of Revenue | $9.69B | $8.97B | $8.67B | $8.39B | $7.78B | $6.91B | $5.86B | $5.50B | $5.25B | $5.15B | $5.03B | $4.86B | |
| Gross Profit | $10.64B | $9.97B | $9.82B | $9.07B | $8.47B | $7.72B | $6.77B | $6.37B | $5.97B | $5.74B | $5.61B | $5.33B | |
| SG&A Expense | $6.92B | $6.36B | $6.03B | $5.60B | $5.20B | $4.77B | $4.35B | $4.15B | $4.16B | $3.66B | $3.55B | $3.37B | |
| Operating Income | $3.72B | $3.61B | $3.79B | $3.47B | $3.27B | $2.94B | $2.42B | $2.22B | $1.81B | $2.08B | $2.06B | $1.95B | |
| Interest Expense | · | · | · | $320M | $199M | $202M | $208M | $194M | $182M | $159M | $151M | $153M | |
| Interest Income | $13M | $11M | $11M | $12M | $6M | $5M | $6M | $7M | $6M | $4M | $2M | $2M | |
| Pretax Income | $3.25B | $3.13B | $3.34B | $3.17B | $3.08B | $2.75B | $2.22B | $2.03B | $1.64B | $1.93B | $1.91B | $1.80B | |
| Income Tax | $678M | $636M | $675M | $639M | $649M | $579M | $484M | $414M | $299M | $645M | $672M | $642M | |
| Net Income | $2.57B | $2.50B | $2.66B | $2.53B | $2.43B | $2.17B | $1.73B | $1.62B | $1.34B | $1.28B | $1.24B | $1.16B | |
| EPS (Basic) | $156.11 | $148.80 | $153.82 | $136.60 | $120.83 | $97.60 | $73.62 | $64.78 | $49.59 | $45.05 | $41.52 | $36.76 | |
| EPS (Diluted) | $152.55 | $144.87 | $149.55 | $132.36 | $117.19 | $95.19 | $71.93 | $63.43 | $48.77 | $44.07 | $40.70 | $36.03 | |
| Shares (Basic) | 16,481,000 | 16,789,000 | 17,309,000 | 18,510,000 | 20,107,000 | 22,237,000 | 23,540,000 | 24,966,000 | 26,970,000 | 28,430,000 | 29,889,000 | 31,560,000 | |
| Shares (Diluted) | 16,865,000 | 17,245,000 | 17,803,000 | 19,103,000 | 20,733,000 | 22,799,000 | 24,093,000 | 25,498,000 | 27,424,000 | 29,065,000 | 30,488,000 | 32,206,000 | |
| EBITDA | $4.41B | $4.22B | $4.34B | $3.97B | $3.71B | $3.35B | $2.82B | $2.59B | $2.16B | $2.40B | $2.36B | $2.22B |
Bilan
| Métrique | Tendance | 2026 | 2025 | 2024 | 2023 | 2022 | 2021 | 2020 | 2019 | 2018 | 2017 | 2016 | 2015 |
|---|---|---|---|---|---|---|---|---|---|---|---|---|---|
| Cash & Equivalents | $326M | $272M | $298M | $277M | $264M | $1.17B | $1.75B | $176M | $218M | $293M | $190M | $175M | |
| Receivables | $755M | $670M | $546M | $520M | $505M | $378M | $365M | $309M | $258M | $281M | $288M | $248M | |
| Other Current Assets | $289M | $374M | $308M | $218M | $221M | $226M | $223M | $224M | $216M | $155M | $130M | $122M | |
| Current Assets | $9.11B | $8.34B | $7.31B | $6.78B | $6.63B | $6.42B | $6.81B | $5.03B | $4.64B | $4.61B | $4.24B | $3.97B | |
| PP&E (Net) | $8.06B | $7.06B | $6.18B | $5.60B | $5.17B | $4.86B | $4.51B | $4.40B | $4.22B | $4.03B | $3.73B | $3.51B | |
| PP&E (Gross) | $14.17B | $12.55B | $11.31B | $10.34B | $9.45B | $8.81B | $8.14B | $7.71B | $7.29B | $6.87B | $6.33B | $5.89B | |
| Accum. Depreciation | $6.12B | $5.49B | $5.12B | $4.74B | $4.28B | $3.95B | $3.63B | $3.31B | $3.07B | $2.84B | $2.60B | $2.39B | |
| Goodwill | $303M | $303M | $303M | $303M | $303M | $303M | $303M | $303M | $303M | $392M | $392M | $392M | |
| Intangibles | · | · | · | · | · | · | $1M | $6M | $10M | $52M | $61M | $70M | |
| Other Non-current Assets | $515M | $336M | $242M | $223M | $203M | $182M | $191M | $139M | $155M | $190M | $198M | $192M | |
| Total Assets | $21.63B | $19.36B | $17.18B | $15.99B | $15.28B | $14.52B | $14.42B | $9.90B | $9.35B | $9.26B | $8.60B | $8.10B | |
| Accounts Payable | $8.60B | $8.03B | $7.36B | $7.20B | $7.30B | $6.01B | $5.16B | $4.86B | $4.41B | $4.17B | $4.10B | $3.86B | |
| Accrued Liabilities | $1.16B | $1.15B | $1.06B | $1.00B | $1.01B | $1.04B | $828M | $622M | $607M | $563M | $552M | $532M | |
| Current Liabilities | $10.11B | $9.52B | $8.71B | $8.51B | $8.59B | $7.37B | $6.28B | $5.51B | $5.03B | $4.77B | $4.69B | $4.71B | |
| Capital Leases | $3.37B | $3.09B | $2.96B | $2.92B | $2.84B | $2.63B | $2.50B | $0 | · | · | · | · | |
| Deferred Tax | $727M | $521M | $447M | $536M | $534M | $337M | $354M | $312M | · | · | $284M | · | |
| Other Non-current Liabilities | $852M | $836M | $780M | $702M | $732M | $704M | $650M | $579M | $548M | $470M | $488M | $466M | |
| Long-term Debt | · | · | · | · | · | · | $5.51B | · | · | · | · | $4.62B | |
| Total Debt | $9.08B | $8.80B | $9.02B | $7.67B | $6.12B | $5.27B | $5.51B | $5.21B | $5.01B | $5.08B | $4.92B | $4.62B | |
| Common Stock | $166.0K | $169.0K | $175.0K | $189.0K | $207.0K | $230.0K | $237.0K | $254.0K | $275.0K | $287.0K | $303.0K | $321.0K | |
| Retained Earnings | $-2.82B | $-3.98B | $-4.42B | $-2.96B | $-1.33B | $-420M | $-1.45B | $-1.31B | $-1.21B | $-1.64B | $-1.60B | $-1.42B | |
| Treasury Stock | $1.56B | $997M | $1.58B | $2.68B | $3.26B | $2.54B | $356M | $1.40B | $1.23B | $618M | $933M | $972M | |
| AOCI | $-159M | $-285M | $-362M | $-191M | $-301M | $-308M | $-354M | $-269M | $-236M | $-255M | $-308M | $-250M | |
| Stockholders' Equity | $-2.50B | $-3.41B | $-4.75B | $-4.35B | $-3.54B | $-1.80B | $-878M | $-1.71B | $-1.52B | $-1.43B | $-1.79B | $-1.70B | |
| Liabilities + Equity | $21.63B | $19.36B | $17.18B | $15.99B | $15.28B | $14.52B | $14.42B | $9.90B | $9.35B | $9.26B | $8.60B | $8.10B | |
| Shares Outstanding | 16,173,000 | 16,665,000 | 16,926,000 | 17,857,000 | 19,126,000 | 21,138,000 | 23,376,000 | 24,038,000 | 25,742,000 | 27,833,000 | 29,118,000 | 30,659,000 |
Flux de trésorerie
| Métrique | Tendance | 2026 | 2025 | 2024 | 2023 | 2022 | 2021 | 2020 | 2019 | 2018 | 2017 | 2016 | 2015 |
|---|---|---|---|---|---|---|---|---|---|---|---|---|---|
| D&A | $684M | $613M | $550M | $498M | $442M | $408M | $397M | $370M | $345M | $323M | $297M | $270M | |
| Deferred Tax | $-188M | $115M | $-254M | $-26M | $186M | $-34M | $51M | $35M | $-124M | $75M | $45M | $36M | |
| Amort. of Intangibles | · | · | · | · | · | · | $4M | $4M | $5M | $8M | $9M | $9M | |
| Other Non-cash | $180M | $-109M | $46M | $-60M | $154M | $975M | $539M | $106M | $522M | $-108M | $-6M | $59M | |
| Operating Cash Flow | $3.25B | $3.12B | $3.00B | $2.94B | $3.21B | $3.52B | $2.72B | $2.13B | $2.08B | $1.57B | $1.64B | $1.57B | |
| CapEx | $1.43B | $1.33B | $1.07B | $797M | $672M | $622M | $458M | $496M | $522M | $554M | $489M | $481M | |
| Investing Cash Flow | $-1.44B | $-1.40B | $-1.29B | $-876M | $-648M | $-602M | $-498M | $-492M | $-522M | $-554M | $-506M | · | |
| Net Debt Issued | · | $-900M | $-300M | $-800M | $-500M | $-250M | $-500M | $-250M | $-250M | $-400M | $-500M | $-500M | |
| Stock Repurchased | $2.01B | $1.58B | $3.14B | $3.70B | $4.36B | $3.38B | $931M | $2.00B | $1.59B | $1.07B | $1.45B | $1.27B | |
| Net Stock Activity | $-2.01B | $-1.58B | $-3.14B | $-3.70B | $-4.36B | $-3.38B | $-931M | $-2.00B | $-1.59B | $-1.07B | $-1.45B | $-1.27B | |
| Financing Cash Flow | $-1.77B | $-1.75B | $-1.68B | $-2.06B | $-3.47B | $-3.50B | $-644M | $-1.67B | $-1.63B | $-914M | $-1.12B | · | |
| Net Change in Cash | $54M | $-26M | $21M | $13M | $-907M | $-579M | $1.57B | $-42M | $-75M | $104M | $14M | $51M | |
| Taxes Paid | $312M | $313M | $438M | $570M | $461M | $575M | $339M | $384M | $427M | $580M | $582M | · | |
| Free Cash Flow | $1.82B | $1.79B | $1.93B | $2.14B | $2.54B | $2.90B | $2.26B | $1.63B | $1.56B | $1.02B | $1.09B | $1.04B | |
| Levered FCF | · | · | · | $1.89B | $2.38B | $2.74B | $2.10B | $1.48B | $1.41B | $911M | $991M | $946M |
Rentabilité
| Métrique | Tendance | 2026 | 2025 | 2024 | 2023 | 2022 | 2021 | 2020 | 2019 | 2018 | 2017 | 2016 | 2015 |
|---|---|---|---|---|---|---|---|---|---|---|---|---|---|
| Gross Margin | 52.3% | 52.6% | 53.1% | 52.0% | 52.1% | 52.8% | 53.6% | 53.6% | 53.2% | 52.7% | 52.7% | 52.3% | |
| Operating Margin | 18.3% | 19.1% | 20.5% | 19.9% | 20.1% | 20.1% | 19.1% | 18.7% | 16.1% | 19.1% | 19.4% | 19.2% | |
| Net Margin | 12.7% | 13.2% | 14.4% | 14.5% | 14.9% | 14.8% | 13.7% | 13.6% | 11.9% | 11.8% | 11.7% | 11.4% | |
| Pretax Margin | 16.0% | 16.6% | 18.1% | 18.1% | 18.9% | 18.8% | 17.5% | 17.1% | 14.6% | 17.7% | 18.0% | 17.7% | |
| EBITDA Margin | 21.7% | 22.3% | 23.5% | 22.8% | 22.9% | 22.9% | 22.3% | 21.8% | 19.2% | 22.1% | 22.2% | 21.8% | |
| ROA | 12.6% | 13.7% | 16.1% | 16.2% | 16.3% | 15.0% | 14.2% | 16.8% | 14.4% | 14.3% | 14.9% | 14.9% | |
| ROE | -95.1% | -63.5% | -55.5% | -58.5% | -70.2% | -121.9% | -138.1% | -97.9% | -92.8% | -79.7% | -71.1% | -69.8% | |
| ROIC | 44.8% | 53.4% | 70.7% | 83.6% | 99.9% | 66.9% | 40.8% | 50.5% | 42.5% | 37.9% | 42.6% | 43.0% |
Liquidité et Solvabilité
| Métrique | Tendance | 2026 | 2025 | 2024 | 2023 | 2022 | 2021 | 2020 | 2019 | 2018 | 2017 | 2016 | 2015 |
|---|---|---|---|---|---|---|---|---|---|---|---|---|---|
| Current Ratio | 0.9 | 0.9 | 0.8 | 0.8 | 0.8 | 0.9 | 1.1 | 0.9 | 0.9 | 1.0 | 0.9 | 0.8 | |
| Quick Ratio | 0.1 | 0.1 | 0.1 | 0.1 | 0.1 | 0.2 | 0.3 | 0.1 | 0.1 | 0.1 | 0.1 | 0.1 | |
| Debt / Equity | -3.6 | -2.6 | -1.9 | -1.8 | -1.7 | -2.9 | -6.3 | -3.0 | -3.3 | -3.6 | -2.8 | -2.7 | |
| LT Debt / Equity | -3.6 | -2.6 | -1.9 | -1.8 | -1.7 | -2.9 | -6.3 | -3.0 | -3.3 | -3.6 | -2.8 | -2.7 | |
| Interest Coverage | · | · | · | 10.9 | 16.4 | 14.6 | 11.6 | 11.4 | 10.0 | 13.1 | 13.6 | 12.8 |
Efficacité
| Métrique | Tendance | 2026 | 2025 | 2024 | 2023 | 2022 | 2021 | 2020 | 2019 | 2018 | 2017 | 2016 | 2015 |
|---|---|---|---|---|---|---|---|---|---|---|---|---|---|
| Asset Turnover | 1.0 | 1.0 | 1.1 | 1.1 | 1.1 | 1.0 | 1.0 | 1.2 | 1.2 | 1.2 | 1.3 | 1.3 | |
| Receivables Turnover | 28.5 | 31.2 | 34.7 | 34.1 | 36.8 | 39.4 | 37.5 | 41.8 | 41.6 | 38.3 | 39.7 | 45.4 |
Par action
| Métrique | Tendance | 2026 | 2025 | 2024 | 2023 | 2022 | 2021 | 2020 | 2019 | 2018 | 2017 | 2016 | 2015 |
|---|---|---|---|---|---|---|---|---|---|---|---|---|---|
| Book Value / Share | $-154.73 | $-204.88 | $-280.61 | $-243.60 | $-185.03 | $-85.04 | $-37.56 | $-71.30 | $-59.06 | $-51.32 | $-61.39 | $-55.49 | |
| Revenue / Share | $1205.96 | $1098.21 | $1038.60 | $913.85 | $783.88 | $641.68 | $524.30 | $465.28 | $409.17 | $374.63 | $348.85 | $316.32 | |
| Cash Flow / Share | $192.65 | $180.77 | $168.74 | $153.94 | $154.88 | $154.33 | $112.90 | $83.48 | $75.86 | $54.04 | $51.74 | $47.36 | |
| Cash / Share | $20.16 | $16.31 | $17.62 | $15.52 | $13.82 | $55.41 | $74.90 | $7.33 | $8.46 | $10.54 | $6.52 | $5.72 | |
| EPS (TTM) | $152.55 | $144.87 | $149.55 | $132.36 | $117.19 | $95.19 | $71.93 | $63.43 | $48.77 | $44.07 | $40.70 | $36.03 |
Taux de croissance
| Métrique | Tendance | 2026 | 2025 | 2024 | 2023 | 2022 | 2021 | 2020 | 2019 | 2018 | 2017 | 2016 | 2015 |
|---|---|---|---|---|---|---|---|---|---|---|---|---|---|
| Revenue YoY | 7.4% | 2.4% | 5.9% | 7.4% | 11.1% | 15.8% | · | · | · | · | · | · | |
| Revenue CAGR 3Y | 5.2% | 5.2% | 8.1% | 11.4% | · | · | · | · | · | · | · | · | |
| Revenue CAGR 5Y | 6.8% | 8.4% | · | · | · | · | · | · | · | · | · | · | |
| EPS YoY | 5.3% | -3.1% | 13.0% | 12.9% | 23.1% | 32.3% | · | · | · | · | · | · | |
| EPS CAGR 3Y | 4.9% | 7.3% | 16.2% | 22.5% | · | · | · | · | · | · | · | · | |
| EPS CAGR 5Y | 9.9% | 15.0% | · | · | · | · | · | · | · | · | · | · | |
| Net Income YoY | 3.0% | -6.2% | 5.3% | 4.1% | 11.9% | 25.2% | · | · | · | · | · | · | |
| Net Income CAGR 3Y | 0.58% | 0.93% | 7.0% | 13.4% | · | · | · | · | · | · | · | · | |
| Net Income CAGR 5Y | 3.5% | 7.6% | · | · | · | · | · | · | · | · | · | · |
Valorisation (TTM)
| Métrique | Tendance | 2026 | 2025 | 2024 | 2023 | 2022 | 2021 | 2020 | 2019 | 2018 | 2017 | 2016 | 2015 |
|---|---|---|---|---|---|---|---|---|---|---|---|---|---|
| Revenue TTM | $20.34B | $18.94B | $18.49B | $17.46B | $16.25B | $14.63B | $12.63B | $11.86B | $11.22B | $10.89B | $10.64B | $10.19B | |
| Net Income TTM | $2.57B | $2.50B | $2.66B | $2.53B | $2.43B | $2.17B | $1.73B | $1.62B | $1.34B | $1.28B | $1.24B | $1.16B | |
| Market Cap | $47.90B | $69.97B | $53.85B | $43.81B | $41.37B | $32.73B | $27.80B | $26.48B | $19.83B | $14.72B | $21.94B | $22.27B | |
| Enterprise Value | $56.66B | $78.50B | $62.58B | $51.20B | $47.23B | $36.83B | $31.56B | $31.51B | $24.62B | $19.51B | $26.67B | $26.72B | |
| P/E | 19.4 | 29.0 | 21.3 | 18.5 | 18.5 | 16.3 | 16.5 | 17.4 | 15.8 | 12.0 | 18.5 | 20.2 | |
| P/S | 2.4 | 3.7 | 2.9 | 2.5 | 2.5 | 2.2 | 2.2 | 2.2 | 1.8 | 1.4 | 2.1 | 2.2 | |
| P/B | -19.1 | -20.5 | -11.3 | -10.1 | -11.7 | -18.2 | -31.7 | -15.5 | -13.0 | -10.3 | -12.3 | -13.1 | |
| P / Cash Flow | 14.7 | 22.4 | 17.9 | 14.9 | 12.9 | 9.3 | 10.2 | 12.4 | 9.5 | 9.4 | 13.9 | 14.6 | |
| P / FCF | · | 39.1 | 27.9 | 20.4 | 16.3 | 11.3 | 12.3 | 16.2 | 12.7 | 14.5 | 20.2 | 21.3 | |
| EV / EBITDA | · | 18.6 | 14.4 | 12.9 | 12.7 | 11.0 | 11.2 | 12.2 | 11.4 | 8.1 | 11.3 | 12.0 | |
| EV / FCF | · | 43.9 | 32.4 | 23.9 | 18.6 | 12.7 | 13.9 | 19.3 | 15.8 | 19.2 | 24.5 | 25.6 | |
| EV / Revenue | 2.8 | 4.1 | 3.4 | 2.9 | 2.9 | 2.5 | 2.5 | 2.7 | 2.2 | 1.8 | 2.5 | 2.6 | |
| Earnings Yield | 5.1% | 3.5% | 4.7% | 5.4% | 5.4% | 6.2% | 6.0% | 5.8% | 6.3% | 8.3% | 5.4% | 5.0% |
Compte de résultat
| Métrique | Tendance | Q4 2026 | Q3 2026 | Q2 2026 | Q1 2026 | Q4 2025 | Q3 2025 | Q2 2025 | Q1 2025 | Q4 2024 | Q3 2024 | Q2 2024 | Q1 2024 | Q3 2023 | Q2 2023 | Q1 2023 | Q3 2022 |
|---|---|---|---|---|---|---|---|---|---|---|---|---|---|---|---|---|---|
| Revenue | $6.59B | $4.84B | $4.27B | $4.63B | $6.24B | $4.46B | $3.95B | $4.28B | $6.21B | $4.24B | $3.86B | $4.19B | $4.09B | $3.69B | $3.99B | $3.87B | |
| Cost of Revenue | $3.08B | $2.32B | $2.03B | $2.27B | $3.03B | $2.11B | $1.82B | $2.01B | $2.95B | $1.97B | $1.78B | $1.98B | $1.94B | $1.76B | $1.99B | $1.86B | |
| Gross Profit | $3.52B | $2.52B | $2.24B | $2.36B | $3.22B | $2.35B | $2.13B | $2.27B | $3.26B | $2.27B | $2.08B | $2.21B | $2.15B | $1.93B | $1.99B | $2.01B | |
| SG&A Expense | $2.20B | $1.60B | $1.54B | $1.58B | $2.02B | $1.49B | $1.42B | $1.43B | $1.96B | $1.37B | $1.34B | $1.37B | $1.29B | $1.26B | $1.27B | $1.22B | |
| Operating Income | $1.32B | $924M | $698M | $784M | $1.20B | $866M | $707M | $841M | $1.30B | $900M | $743M | $849M | $858M | $670M | $723M | $786M | |
| Pretax Income | $1.17B | $813M | $591M | $678M | $1.05B | $755M | $598M | $734M | $1.14B | $796M | $641M | $757M | $784M | $604M | $665M | $744M | |
| Income Tax | $237M | $172M | $122M | $147M | $211M | $146M | $110M | $169M | $241M | $144M | $126M | $164M | $136M | $128M | $126M | $151M | |
| Net Income | $932M | $641M | $469M | $531M | $837M | $608M | $488M | $565M | $902M | $652M | $515M | $593M | $648M | $477M | $539M | $593M | |
| EPS (Basic) | $56.99 | $38.95 | $28.29 | $31.88 | $50.01 | $36.33 | $29.06 | $33.40 | $52.84 | $37.73 | $29.74 | $33.51 | $35.22 | $25.48 | $28.37 | $29.93 | |
| EPS (Diluted) | $55.81 | $38.07 | $27.63 | $31.04 | $48.70 | $35.36 | $28.29 | $32.52 | $51.42 | $36.69 | $28.89 | $32.55 | $34.12 | $24.64 | $27.45 | $29.03 | |
| Shares (Basic) | · | 16,468,000 | 16,573,000 | 16,652,000 | · | 16,746,000 | 16,788,000 | 16,913,000 | · | 17,273,000 | 17,319,000 | 17,709,000 | 18,389,000 | 18,705,000 | 19,007,000 | 19,798,000 | |
| Shares (Diluted) | · | 16,852,000 | 16,969,000 | 17,102,000 | · | 17,207,000 | 17,245,000 | 17,370,000 | · | 17,761,000 | 17,828,000 | 18,234,000 | 18,983,000 | 19,337,000 | 19,645,000 | 20,414,000 | |
| EBITDA | · | $924M | $698M | $932M | · | $866M | $707M | $974M | · | $900M | $743M | $969M | $858M | $670M | $832M | $786M |
Bilan
| Métrique | Tendance | Q4 2026 | Q3 2026 | Q2 2026 | Q1 2026 | Q4 2025 | Q3 2025 | Q2 2025 | Q1 2025 | Q4 2024 | Q3 2024 | Q2 2024 | Q1 2024 | Q3 2023 | Q2 2023 | Q1 2023 | Q3 2022 |
|---|---|---|---|---|---|---|---|---|---|---|---|---|---|---|---|---|---|
| Cash & Equivalents | $326M | $254M | $285M | $288M | $272M | $269M | $301M | $304M | $298M | $275M | $304M | $283M | $275M | $301M | $270M | $263M | |
| Receivables | $755M | $765M | $698M | $638M | $670M | $589M | $597M | $533M | $546M | $587M | $501M | $512M | $471M | $485M | $502M | $440M | |
| Other Current Assets | $289M | $357M | $364M | $373M | $374M | $306M | $316M | $309M | $308M | $272M | $382M | $387M | $259M | $277M | $254M | $239M | |
| Current Assets | $9.11B | $8.93B | $8.83B | $8.44B | $8.34B | $7.99B | $7.80B | $7.42B | $7.31B | $7.29B | $7.16B | $6.96B | $6.71B | $6.79B | $6.63B | $6.25B | |
| PP&E (Net) | $8.06B | $7.80B | $7.55B | $7.24B | $7.06B | $6.73B | $6.45B | $6.28B | $6.18B | $6.05B | $5.91B | $5.71B | $5.33B | $5.24B | $5.19B | $4.97B | |
| PP&E (Gross) | $14.17B | $13.74B | $13.37B | $12.87B | $12.55B | $12.13B | $11.76B | $11.49B | $11.31B | $11.08B | $10.85B | $10.55B | $9.94B | $9.72B | $9.57B | $9.14B | |
| Accum. Depreciation | $6.12B | $5.95B | $5.81B | $5.63B | $5.49B | $5.40B | $5.31B | $5.21B | $5.12B | $5.03B | $4.94B | $4.84B | $4.60B | $4.49B | $4.38B | $4.17B | |
| Goodwill | $303M | $303M | $303M | $303M | $303M | $303M | $303M | $303M | $303M | $303M | $303M | $303M | $303M | $303M | $303M | $303M | |
| Other Non-current Assets | $515M | $336M | $318M | $313M | $336M | $360M | $344M | $295M | $242M | $285M | $266M | $237M | $231M | $208M | $210M | $186M | |
| Total Assets | $21.63B | $20.92B | $20.44B | $19.67B | $19.36B | $18.62B | $18.12B | $17.47B | $17.18B | $17.11B | $16.72B | $16.29B | $15.60B | $15.55B | $15.32B | $14.52B | |
| Accounts Payable | $8.60B | $8.40B | $8.30B | $8.26B | $8.03B | $7.89B | $7.78B | $7.50B | $7.36B | $7.37B | $7.15B | $7.18B | $7.22B | $7.32B | $7.35B | $6.79B | |
| Accrued Liabilities | $1.16B | $1.23B | $1.22B | $1.21B | $1.15B | $1.10B | $1.02B | $1.03B | $1.06B | $989M | $1.21B | $1.20B | $906M | $934M | $983M | $925M | |
| Current Liabilities | $10.11B | $10.04B | $9.92B | $9.81B | $9.52B | $9.47B | $9.27B | $8.89B | $8.71B | $9.19B | $8.77B | $8.79B | $8.46B | $8.61B | $8.71B | $8.06B | |
| Capital Leases | $3.37B | $3.28B | $3.18B | $3.14B | $3.09B | $3.02B | $3.01B | $2.98B | $2.96B | $2.96B | $2.90B | $2.91B | $2.86B | $2.85B | $2.84B | $2.66B | |
| Deferred Tax | $727M | $484M | $504M | $532M | $521M | $412M | $475M | $496M | $447M | $543M | $540M | $534M | $538M | $536M | $549M | $419M | |
| Other Non-current Liabilities | $852M | $887M | $840M | $786M | $836M | $845M | $772M | $759M | $780M | $752M | $710M | $692M | $694M | $682M | $729M | $708M | |
| Long-term Debt | · | · | · | · | · | · | · | · | · | $9.00B | · | · | · | · | · | · | |
| Total Debt | · | $9.02B | $8.91B | $8.62B | · | $8.85B | $9.05B | $9.01B | · | $9.00B | $8.63B | $8.58B | $7.34B | $7.04B | $6.33B | $6.06B | |
| Common Stock | $166.0K | $166.0K | $166.0K | $170.0K | $169.0K | $169.0K | $168.0K | $175.0K | $175.0K | $174.0K | $174.0K | $190.0K | $189.0K | $188.0K | $208.0K | $207.0K | |
| Retained Earnings | $-2.82B | $-3.75B | $-4.39B | $-3.45B | $-3.98B | $-4.81B | $-5.42B | $-3.86B | $-4.42B | $-5.33B | $-5.98B | $-2.37B | $-3.82B | $-4.47B | $-791M | $-2.14B | |
| Treasury Stock | $1.56B | $865M | $279M | $1.43B | $997M | $551M | $300M | $2.09B | $1.58B | $874M | $139M | $4.19B | $1.68B | $767M | $4.16B | $2.26B | |
| AOCI | $-159M | $-137M | $-158M | $-263M | $-285M | $-357M | $-408M | $-407M | $-362M | $-203M | $-205M | $-210M | $-227M | $-269M | $-297M | $-302M | |
| Stockholders' Equity | $-2.50B | $-2.78B | $-2.91B | $-3.23B | $-3.41B | $-3.97B | $-4.46B | $-4.67B | $-4.75B | $-4.84B | $-4.84B | $-5.21B | $-4.30B | $-4.18B | $-3.84B | $-3.39B | |
| Liabilities + Equity | $21.63B | $20.92B | $20.44B | $19.67B | $19.36B | $18.62B | $18.12B | $17.47B | $17.18B | $17.11B | $16.72B | $16.29B | $15.60B | $15.55B | $15.32B | $14.52B | |
| Shares Outstanding | 16,173,000 | 16,369,000 | 16,519,000 | 16,585,000 | 16,665,000 | 16,724,000 | 16,747,000 | 16,810,000 | 16,926,000 | 17,144,000 | 17,312,000 | 17,326,000 | 18,225,000 | 18,467,000 | 18,797,000 | 19,576,000 |
Flux de trésorerie
| Métrique | Tendance | Q4 2026 | Q3 2026 | Q2 2026 | Q1 2026 | Q4 2025 | Q3 2025 | Q2 2025 | Q1 2025 | Q4 2024 | Q3 2024 | Q2 2024 | Q1 2024 | Q3 2023 | Q2 2023 | Q1 2023 | Q3 2022 |
|---|---|---|---|---|---|---|---|---|---|---|---|---|---|---|---|---|---|
| D&A | · | · | · | $148M | · | · | · | $133M | · | · | · | $120M | · | · | $109M | · | |
| Deferred Tax | · | · | · | $-42M | · | · | · | $-5M | · | · | · | $882.0K | · | · | $14M | · | |
| Other Non-cash | · | · | · | $307M | · | · | · | $119M | · | · | · | $116M | · | · | $131M | · | |
| Operating Cash Flow | · | · | · | $944M | · | · | · | $812M | · | · | · | $830M | · | · | $794M | · | |
| CapEx | · | · | · | $314M | · | · | · | $247M | · | · | · | $235M | · | · | $114M | · | |
| Investing Cash Flow | · | · | · | $-327M | · | · | · | $-266M | · | · | · | $-271M | · | · | $-114M | · | |
| Stock Repurchased | · | · | · | $427M | · | · | · | $540M | · | · | · | $1.49B | · | · | $900M | · | |
| Net Stock Activity | · | · | · | $-427M | · | · | · | $-540M | · | · | · | $-1.49B | · | · | $-900M | · | |
| Financing Cash Flow | · | · | · | $-603M | · | · | · | $-538M | · | · | · | $-552M | · | · | $-676M | · | |
| Net Change in Cash | · | · | · | $16M | · | · | · | $6M | · | · | · | $6M | · | · | $5M | · | |
| Free Cash Flow | · | · | · | $630M | · | · | · | $565M | · | · | · | $595M | · | · | $679M | · |
Rentabilité
| Métrique | Tendance | Q4 2026 | Q3 2026 | Q2 2026 | Q1 2026 | Q4 2025 | Q3 2025 | Q2 2025 | Q1 2025 | Q4 2024 | Q3 2024 | Q2 2024 | Q1 2024 | Q3 2023 | Q2 2023 | Q1 2023 | Q3 2022 |
|---|---|---|---|---|---|---|---|---|---|---|---|---|---|---|---|---|---|
| Gross Margin | · | 52.1% | 52.5% | 51.0% | · | 52.7% | 53.9% | 53.0% | · | 53.5% | 53.9% | 52.8% | 52.5% | 52.3% | 50.0% | 51.9% | |
| Operating Margin | · | 19.1% | 16.3% | 16.9% | · | 19.4% | 17.9% | 19.7% | · | 21.2% | 19.3% | 20.2% | 21.0% | 18.1% | 18.1% | 20.3% | |
| Net Margin | · | 13.2% | 11.0% | 11.5% | · | 13.6% | 12.3% | 13.2% | · | 15.4% | 13.4% | 14.2% | 15.8% | 12.9% | 13.5% | 15.3% | |
| Pretax Margin | · | 16.8% | 13.8% | 14.6% | · | 16.9% | 15.1% | 17.1% | · | 18.8% | 16.6% | 18.1% | 19.2% | 16.4% | 16.7% | 19.2% | |
| EBITDA Margin | · | 19.1% | 16.3% | 20.1% | · | 19.4% | 17.9% | 22.8% | · | 21.2% | 19.3% | 23.1% | 21.0% | 18.1% | 20.9% | 20.3% | |
| ROA | · | 3.2% | 2.4% | 2.9% | · | 3.4% | 2.8% | 3.4% | · | 4.0% | 3.2% | 3.8% | 4.3% | 3.2% | 3.6% | 4.1% | |
| ROE | · | -19.0% | -12.7% | -13.4% | · | -13.8% | -10.5% | -11.4% | · | -14.3% | -11.4% | -13.1% | -16.9% | -13.0% | -18.1% | -23.0% | |
| ROIC | · | 11.7% | 9.2% | 11.4% | · | 14.3% | 12.6% | 14.9% | · | 17.7% | 15.8% | 19.7% | 23.3% | 18.5% | 23.5% | 23.4% |
Liquidité et Solvabilité
| Métrique | Tendance | Q4 2026 | Q3 2026 | Q2 2026 | Q1 2026 | Q4 2025 | Q3 2025 | Q2 2025 | Q1 2025 | Q4 2024 | Q3 2024 | Q2 2024 | Q1 2024 | Q3 2023 | Q2 2023 | Q1 2023 | Q3 2022 |
|---|---|---|---|---|---|---|---|---|---|---|---|---|---|---|---|---|---|
| Current Ratio | · | 0.9 | 0.9 | 0.9 | · | 0.8 | 0.8 | 0.8 | · | 0.8 | 0.8 | 0.8 | 0.8 | 0.8 | 0.8 | 0.8 | |
| Quick Ratio | · | 0.1 | 0.1 | 0.1 | · | 0.1 | 0.1 | 0.1 | · | 0.1 | 0.1 | 0.1 | 0.1 | 0.1 | 0.1 | 0.1 | |
| Debt / Equity | · | -3.2 | -3.1 | -2.7 | · | -2.2 | -2.0 | -1.9 | · | -1.9 | -1.8 | -1.6 | -1.7 | -1.7 | -1.6 | -1.8 | |
| LT Debt / Equity | · | -3.2 | -3.1 | -2.7 | · | -2.2 | -2.0 | -1.9 | · | -1.8 | -1.8 | -1.6 | -1.7 | -1.7 | -1.6 | -1.8 |
Efficacité
| Métrique | Tendance | Q4 2026 | Q3 2026 | Q2 2026 | Q1 2026 | Q4 2025 | Q3 2025 | Q2 2025 | Q1 2025 | Q4 2024 | Q3 2024 | Q2 2024 | Q1 2024 | Q3 2023 | Q2 2023 | Q1 2023 | Q3 2022 |
|---|---|---|---|---|---|---|---|---|---|---|---|---|---|---|---|---|---|
| Asset Turnover | · | 0.2 | 0.2 | 0.2 | · | 0.2 | 0.2 | 0.3 | · | 0.3 | 0.2 | 0.3 | 0.3 | 0.2 | 0.3 | 0.3 | |
| Receivables Turnover | · | 7.2 | 6.6 | 7.9 | · | 7.6 | 7.2 | 8.2 | · | 8.0 | 7.8 | 8.3 | 9.0 | 8.3 | 9.0 | 9.7 |
Par action
| Métrique | Tendance | Q4 2026 | Q3 2026 | Q2 2026 | Q1 2026 | Q4 2025 | Q3 2025 | Q2 2025 | Q1 2025 | Q4 2024 | Q3 2024 | Q2 2024 | Q1 2024 | Q3 2023 | Q2 2023 | Q1 2023 | Q3 2022 |
|---|---|---|---|---|---|---|---|---|---|---|---|---|---|---|---|---|---|
| Book Value / Share | · | $-170.11 | $-176.09 | $-194.67 | · | $-237.65 | $-266.18 | $-277.98 | · | $-282.21 | $-279.42 | $-300.92 | $-236.03 | $-226.58 | $-204.18 | $-173.03 | |
| Revenue / Share | · | $287.26 | $251.88 | $270.65 | · | $259.45 | $229.17 | $246.38 | · | $238.47 | $216.46 | $229.81 | $215.48 | $190.88 | $202.85 | $189.34 | |
| Cash Flow / Share | · | · | · | $55.21 | · | · | · | $46.74 | · | · | · | $45.53 | · | · | $40.40 | · | |
| Cash / Share | · | $15.50 | $17.28 | $17.34 | · | $16.06 | $17.97 | $18.09 | · | $16.06 | $17.57 | $16.33 | $15.08 | $16.31 | $14.35 | $13.44 | |
| EPS (TTM) | · | $145.44 | $142.73 | $143.39 | · | $147.59 | $148.92 | $149.52 | · | $144.28 | $141.71 | $137.46 | $126.38 | $121.29 | $118.95 | $112.19 |
Valorisation (TTM)
| Métrique | Tendance | Q4 2026 | Q3 2026 | Q2 2026 | Q1 2026 | Q4 2025 | Q3 2025 | Q2 2025 | Q1 2025 | Q4 2024 | Q3 2024 | Q2 2024 | Q1 2024 | Q3 2023 | Q2 2023 | Q1 2023 | Q3 2022 |
|---|---|---|---|---|---|---|---|---|---|---|---|---|---|---|---|---|---|
| Revenue TTM | · | $19.99B | $19.61B | $19.29B | · | $18.90B | $18.67B | $18.58B | · | $17.98B | $17.83B | $17.66B | $17.11B | $16.89B | $16.57B | $15.82B | |
| Net Income TTM | · | $2.48B | $2.45B | $2.46B | · | $2.56B | $2.61B | $2.63B | · | $2.63B | $2.62B | $2.58B | $2.47B | $2.42B | $2.41B | $2.41B | |
| Market Cap | · | $57.23B | $63.73B | $64.65B | · | $61.27B | $57.92B | $52.10B | · | $50.61B | $46.40B | $45.52B | $49.05B | $46.42B | $46.26B | $39.15B | |
| Enterprise Value | · | $65.99B | $72.35B | $72.98B | · | $69.86B | $66.67B | $60.81B | · | $59.33B | $54.72B | $53.82B | $56.12B | $53.16B | $52.31B | $44.95B | |
| P/E | · | 24.0 | 27.0 | 27.2 | · | 24.8 | 23.2 | 20.7 | · | 20.5 | 18.9 | 19.1 | 21.3 | 20.7 | 20.7 | 17.8 | |
| P/S | · | 2.9 | 3.3 | 3.4 | · | 3.2 | 3.1 | 2.8 | · | 2.8 | 2.6 | 2.6 | 2.9 | 2.7 | 2.8 | 2.5 | |
| P/B | · | -20.6 | -21.9 | -20.0 | · | -15.4 | -13.0 | -11.1 | · | -10.5 | -9.6 | -8.7 | -11.4 | -11.1 | -12.1 | -11.6 | |
| P / Cash Flow | · | · | · | 68.5 | · | · | · | 64.2 | · | · | · | 54.8 | · | · | 58.3 | · | |
| EV / Revenue | · | 3.3 | 3.7 | 3.8 | · | 3.7 | 3.6 | 3.3 | · | 3.3 | 3.1 | 3.0 | 3.3 | 3.1 | 3.2 | 2.8 | |
| Earnings Yield | · | 4.2% | 3.7% | 3.7% | · | 4.0% | 4.3% | 4.8% | · | 4.9% | 5.3% | 5.2% | 4.7% | 4.8% | 4.8% | 5.6% |
Période la plus récente à gauche · valeurs nulles affichées comme ·
États financiers Compte de résultat, bilan, flux de trésorerie — annuel, sur les 5 dernières années
| Métrique | 2026-08-29 | 2025-08-30 | 2024-08-31 | 2023-08-26 | 2022-08-27 |
|---|---|---|---|---|---|
| Revenu | $20.34B | $18.94B | $18.49B | $17.46B | $16.25B |
| Marge Brute % | 52.3% | 52.6% | 53.1% | 52.0% | 52.1% |
| Marge d'exploitation % | 18.3% | 19.1% | 20.5% | 19.9% | 20.1% |
| Résultat net | $2.57B | $2.50B | $2.66B | $2.53B | $2.43B |
| BPA dilué | $152.55 | $144.87 | $149.55 | $132.36 | $117.19 |
| Métrique | 2026-08-29 | 2025-08-30 | 2024-08-31 | 2023-08-26 | 2022-08-27 |
|---|---|---|---|---|---|
| Dette / Capitaux propres | -3.6 | -2.6 | -1.9 | -1.8 | -1.7 |
| Ratio de liquidité | 0.9 | 0.9 | 0.8 | 0.8 | 0.8 |
| Ratio de liquidité réduite | 0.1 | 0.1 | 0.1 | 0.1 | 0.1 |
| Métrique | 2026-08-29 | 2025-08-30 | 2024-08-31 | 2023-08-26 | 2022-08-27 |
|---|---|---|---|---|---|
| Flux de trésorerie libre | $1.82B | $1.79B | $1.93B | $2.14B | $2.54B |
Détenteurs institutionnels (13F) 1 364 déclarants · $55.8B total · Au 30 septembre 2026
Institutions qui déclarent détenir cette action dans leur Formulaire SEC 13F trimestriel. Uniquement les positions longues ; un même déclarant peut apparaître deux fois pour des jambes d'options distinctes. Les jambes put/call compensatoires importantes reflètent généralement la tenue de marché ou un inventaire couvert, pas une conviction directionnelle.
| Nouvelles positions | Positions clôturées | Augmenté | Diminué | Variation nette des actions |
|---|---|---|---|---|
| 119 (-14 vs T. préc.) | 122 (-5 vs T. préc.) | 418 (+23 vs T. préc.) | 477 (-51 vs T. préc.) | +954K |
Comparé à Q1 2026. Les dépôts de formulaire 13F de la SEC sont dus dans les 45 jours suivant la fin du trimestre, plus une courte période tampon pour les déposants tardifs — les trimestres encore dans cette fenêtre sont ignorés au profit de la paire la plus récente entièrement déclarée.
| Institution | Valeur | Actions | % de 13F suivies | Type |
|---|---|---|---|---|
| VANGUARD GROUP INC | $6 090 899 989 | 1 795 931 | 10,91% | Actions |
| JPMORGAN CHASE & CO | $3 953 483 903 | 1 253 632 | 7,08% | Actions |
| BlackRock, Inc. | $3 938 565 574 | 1 232 366 | 7,06% | Actions |
| VANGUARD CAPITAL MANAGEMENT LLC | $3 446 744 587 | 1 078 476 | 6,17% | Actions |
| VANGUARD PORTFOLIO MANAGEMENT LLC | $2 446 191 651 | 765 406 | 4,38% | Actions |
| STATE STREET CORP | $2 296 899 706 | 718 693 | 4,11% | Actions |
| GEODE CAPITAL MANAGEMENT, LLC | $1 335 877 618 | 416 591 | 2,39% | Actions |
| MORGAN STANLEY | $1 272 108 072 | 398 036 | 2,28% | Actions |
| SUSQUEHANNA INTERNATIONAL GROUP, LLP | $1 003 205 566 | 313 900 | 1,80% | Option d'achat |
| ROYAL BANK OF CANADA | $993 881 000 | 310 982 | 1,78% | Actions |
| NORGES BANK | $906 029 814 | 283 494 | 1,62% | Actions |
| FIRST MANHATTAN CO. LLC. | $837 786 908 | 262 141 | 1,50% | Actions |
| FMR LLC | $785 245 353 | 245 701 | 1,41% | Actions |
| SUSQUEHANNA INTERNATIONAL GROUP, LLP | $764 149 254 | 239 100 | 1,37% | Option de vente |
| Fiera Capital Corp | $710 505 401 | 222 315 | 1,27% | Actions |
| PineStone Asset Management Inc. | $671 337 344 | 237 220 | 1,20% | Actions |
| ARROWSTREET CAPITAL, LIMITED PARTNERSHIP | $646 724 027 | 202 358 | 1,16% | Actions |
| DZ BANK AG Deutsche Zentral Genossenschafts Bank, Frankfurt am Main | $645 006 937 | 201 821 | 1,16% | Actions |
| ALLIANCEBERNSTEIN L.P. | $606 544 577 | 179 569 | 1,09% | Actions |
| Mitsubishi UFJ Asset Management Co., Ltd. | $572 885 029 | 179 254 | 1,03% | Actions |
| NORTHERN TRUST CORP | $521 356 889 | 163 131 | 0,93% | Actions |
| BROWN ADVISORY INC | $436 182 796 | 136 481 | 0,78% | Actions |
| UBS Group AG | $435 919 824 | 136 398 | 0,78% | Actions |
| MARSHFIELD ASSOCIATES | $435 840 725 | 136 373 | 0,78% | Actions |
| Boston Partners | $429 669 859 | 134 458 | 0,77% | Actions |
| CHARLES SCHWAB INVESTMENT MANAGEMENT INC | $410 745 404 | 128 521 | 0,74% | Actions |
| Capital World Investors | $403 720 729 | 126 323 | 0,72% | Actions |
| PARNASSUS INVESTMENTS, LLC | $379 098 159 | 133 956 | 0,68% | Actions |
| BARCLAYS PLC | $339 249 032 | 106 150 | 0,61% | Actions |
| Bank of New York Mellon Corp | $335 157 052 | 104 870 | 0,60% | Actions |
| BAILLIE GIFFORD & CO | $324 141 823 | 101 423 | 0,58% | Actions |
| SCHRODER INVESTMENT MANAGEMENT GROUP | $323 110 445 | 102 457 | 0,58% | Actions |
| Legal & General Group Plc | $319 156 152 | 99 863 | 0,57% | Actions |
| GOLDMAN SACHS GROUP INC | $316 051 713 | 98 892 | 0,57% | Actions |
| Invesco Ltd. | $306 026 915 | 95 755 | 0,55% | Actions |
| VICTORY CAPITAL MANAGEMENT INC | $305 656 505 | 95 639 | 0,55% | Actions |
| VANGUARD FIDUCIARY TRUST CO | $296 663 131 | 92 825 | 0,53% | Actions |
| Allspring Global Investments Holdings, LLC | $291 850 806 | 90 689 | 0,52% | Actions |
| Amundi | $276 576 648 | 86 540 | 0,50% | Actions |
| RENAISSANCE TECHNOLOGIES LLC | $269 289 904 | 84 260 | 0,48% | Actions |
| BLS Capital Fondsmaeglerselskab A/S | $259 992 915 | 81 351 | 0,47% | Actions |
| BANK OF MONTREAL /CAN/ | $257 663 074 | 80 622 | 0,46% | Actions |
| BANK OF AMERICA CORP /DE/ | $233 576 350 | 73 085 | 0,42% | Actions |
| DEUTSCHE BANK AG\ | $218 835 599 | 68 473 | 0,39% | Actions |
| Holocene Advisors, LP | $218 544 769 | 68 382 | 0,39% | Actions |
| Nuveen, LLC | $213 920 245 | 66 935 | 0,38% | Actions |
| ENVESTNET ASSET MANAGEMENT INC | $202 181 684 | 63 262 | 0,36% | Actions |
| WELLINGTON MANAGEMENT GROUP LLP | $201 027 821 | 62 901 | 0,36% | Actions |
| Russell Investments Group, Ltd. | $194 976 877 | 61 007 | 0,35% | Actions |
| RAYMOND JAMES FINANCIAL INC | $188 067 025 | 58 845 | 0,34% | Actions |
Activistes et détenteurs de 5%+ 17 participations
Investisseurs ayant déposé un Schedule 13D auprès de la SEC — détention effective supérieure à 5% avec l'intention d'influencer l'émetteur (participations activistes, campagnes pour le conseil d'administration, fusions-acquisitions). Chaque ligne montre le dernier état connu de la position du déposant.
| Déclarant | Déposé | Participation | Statut | Objectif | Dépôt |
|---|---|---|---|---|---|
| ESL Partners, L.P., ESL Institutional Partners, L.P., RBS Investment Management, L.L.C., Tynan, LLC, RBS Partners, L.P., ESL Investments, Inc., Edward S. Lampert, William C. Crowley ×28 dépôts | 24 avril 2012 | · | Dépôt initial | Investissement passif | SEC |
| ESL Partners, L.P. (2), ESL Institutional Partners, L.P. (2), RBS Investment Management, L.L.C. (2), Tynan, LLC (2), RBS Partners, L.P. (2), ESL Investments, Inc. (2), Edward S. Lampert (2), William C. Crowley (2) | 12 avril 2012 | · | Dépôt initial | Investissement passif | SEC |
| Personne déclarante non divulguée, Personne déclarante non divulguée, Personne déclarante non divulguée, Personne déclarante non divulguée, Personne déclarante non divulguée, Personne déclarante non divulguée, Personne déclarante non divulguée, Personne déclarante non divulguée, Personne déclarante non divulguée | 28 septembre 2006 | · | Dépôt initial | Campagne de conseil d'administration | SEC |
| Personne déclarante non divulguée, Personne déclarante non divulguée, Personne déclarante non divulguée, Personne déclarante non divulguée, Personne déclarante non divulguée, Personne déclarante non divulguée, Personne déclarante non divulguée, Personne déclarante non divulguée, Personne déclarante non divulguée | 1 novembre 2005 | · | Dépôt initial | · | SEC |
| ESL Partners, L.P., a Delaware limited partnership, ESL Institutional Partners, L.P., a Delaware limited partnership, ESL Investors, L.L.C., a Delaware limited liability company, Acres Partners, L.P., a Delaware limited partnership, ESL Investment Management, LLC, a Delaware limited liability company, Edward S. Lampert ×2 dépôts | 1 octobre 2004 | · | Dépôt initial | · | SEC |
| Personne déclarante non divulguée, Personne déclarante non divulguée, Personne déclarante non divulguée, Personne déclarante non divulguée, Personne déclarante non divulguée, Personne déclarante non divulguée | 5 août 2004 | · | Dépôt initial | · | SEC |
| Personne déclarante non divulguée, Personne déclarante non divulguée, Personne déclarante non divulguée, Personne déclarante non divulguée, Personne déclarante non divulguée, Personne déclarante non divulguée, Personne déclarante non divulguée, Personne déclarante non divulguée, Personne déclarante non divulguée, Personne déclarante non divulguée | 3 novembre 2003 | · | Dépôt initial | Structure du capital | SEC |
| Personne déclarante non divulguée, Personne déclarante non divulguée, Personne déclarante non divulguée, Personne déclarante non divulguée, Personne déclarante non divulguée, Personne déclarante non divulguée, Personne déclarante non divulguée, Personne déclarante non divulguée, Personne déclarante non divulguée, Personne déclarante non divulguée, Personne déclarante non divulguée | 3 juillet 2003 | · | Dépôt initial | · | SEC |
| Personne déclarante non divulguée, Personne déclarante non divulguée, Personne déclarante non divulguée, Personne déclarante non divulguée, Personne déclarante non divulguée, Personne déclarante non divulguée, Personne déclarante non divulguée, Personne déclarante non divulguée, Personne déclarante non divulguée | 2 janvier 2003 | · | Dépôt initial | · | SEC |
| Personne déclarante non divulguée, Personne déclarante non divulguée, Personne déclarante non divulguée, Personne déclarante non divulguée, Personne déclarante non divulguée, Personne déclarante non divulguée, Personne déclarante non divulguée, Personne déclarante non divulguée | 26 février 2002 | · | Dépôt initial | Investissement passif | SEC |
| Personne déclarante non divulguée, Personne déclarante non divulguée, Personne déclarante non divulguée, Personne déclarante non divulguée, Personne déclarante non divulguée, Personne déclarante non divulguée, Personne déclarante non divulguée, Personne déclarante non divulguée | 27 décembre 2001 | · | Dépôt initial | · | SEC |
| Personne déclarante non divulguée, Personne déclarante non divulguée, Personne déclarante non divulguée, Personne déclarante non divulguée, Personne déclarante non divulguée, Personne déclarante non divulguée, Personne déclarante non divulguée, Personne déclarante non divulguée | 18 décembre 2001 | · | Dépôt initial | · | SEC |
| Personne déclarante non divulguée, Personne déclarante non divulguée, Personne déclarante non divulguée, Personne déclarante non divulguée, Personne déclarante non divulguée, Personne déclarante non divulguée, Personne déclarante non divulguée, Personne déclarante non divulguée | 6 décembre 2001 | · | Dépôt initial | Investissement passif | SEC |
| Personne déclarante non divulguée, Personne déclarante non divulguée, Personne déclarante non divulguée, Personne déclarante non divulguée, Personne déclarante non divulguée, Personne déclarante non divulguée, Personne déclarante non divulguée, Personne déclarante non divulguée | 2 avril 2001 | · | Dépôt initial | · | SEC |
| Personne déclarante non divulguée, Personne déclarante non divulguée, Personne déclarante non divulguée, Personne déclarante non divulguée, Personne déclarante non divulguée, Personne déclarante non divulguée, Personne déclarante non divulguée, Personne déclarante non divulguée | 28 mars 2001 | · | Dépôt initial | · | SEC |
| Personne déclarante non divulguée, Personne déclarante non divulguée, Personne déclarante non divulguée, Personne déclarante non divulguée, Personne déclarante non divulguée, Personne déclarante non divulguée, Personne déclarante non divulguée, Personne déclarante non divulguée | 14 mars 2001 | · | Dépôt initial | · | SEC |
| Personne déclarante non divulguée, Personne déclarante non divulguée, Personne déclarante non divulguée, Personne déclarante non divulguée, Personne déclarante non divulguée, Personne déclarante non divulguée, Personne déclarante non divulguée, Personne déclarante non divulguée | 29 janvier 2001 | · | Dépôt initial | · | SEC |
Purpose is an automated classification of the filer's own stated purpose (SEC Item 4) — not investment advice. "—" means no clear purpose was stated or the text could not be classified.
Initiés de la société 75 initiés · 33 dirigeants · 11 administrateurs
| Dirigeant | Rôle | Dernière activité | Actions détenues | Achats 12m | Ventes 12m | Net 12m |
|---|---|---|---|---|---|---|
| Philip B. Daniele | President & CEO | 9 octobre 2026 A | 336 | 0 | 0 | $0 |
| Stephen A Odland | Chairman, President and CEO | 31 décembre 2004 A | 79 494 | 0 | 0 | $0 |
| Jamere Jackson | CFO | 9 octobre 2026 A | 494 | 1 | 0 | $187 742 |
| Michael G Archbold | Executive VP and CFO | 17 juin 2005 M | 2 628 | 0 | 0 | $0 |
| Thomas B Newbern | COO | 9 octobre 2026 A | 1 392 | 0 | 0 | $0 |
| Grace Orians Sharpley | SVP, Finance | 9 octobre 2026 A | · | 0 | 0 | $0 |
| Mary Denise Mccullough | SVP Supply Chain | 9 octobre 2026 A | 137 | 0 | 0 | $0 |
| Lucas J. Rauch | SVP, Merchandising & Sourcing | 9 octobre 2026 A | · | 0 | 0 | $0 |
| Bailey L. Childress | SVP, Merchandising Support | 9 octobre 2026 A | 50 | 0 | 0 | $0 |
| Lindsay Lehman | SVP, Marketing | 9 octobre 2026 A | · | 0 | 0 | $0 |
| Jenna M. Bedsole | Sr. Vice President | 9 octobre 2026 A | 70 | 0 | 0 | $0 |
| John Scott Murphy | Vice President, Controller | 9 octobre 2026 A | 1 260 | 0 | 0 | $0 |
| Eric Leef | SVP HR | 9 octobre 2026 A | · | 0 | 0 | $0 |
| Dennis W. Leriche | Sr. Vice President | 9 octobre 2026 A | 441 | 0 | 1 | $-4 510 500 |
| Michelle K. Borninkhof | Senior Vice President & CIO | 9 octobre 2026 A | 427 | 0 | 1 | $-1 132 500 |
| Eric S. Gould | Executive Vice President | 9 octobre 2026 A | 905 | 0 | 0 | $0 |
| Kenneth E Jaycox | SVP Commercial | 9 octobre 2026 A | 1 703 | 0 | 0 | $0 |
| Domingo Hurtado | Sr. Vice President | 9 octobre 2026 A | 159 | 0 | 0 | $0 |
| Preston Frazer | Senior Vice President | 31 octobre 2023 M | 709 | 0 | 0 | $0 |
| Michael A. Womack | Sr. Vice President | 27 octobre 2015 M | 35 | 0 | 0 | $0 |
| Larry M Roesel | Senior Vice President | 27 octobre 2015 M | 2 274 | 0 | 0 | $0 |
| GOLDSMITH HARRY L | Exec. VP, Sec. & Gen Cnsl | 31 décembre 2013 A | 23 526 | 0 | 0 | $0 |
| Lisa R Kranc | Senior Vice President | 1 octobre 2012 M | 12 748 | 0 | 0 | $0 |
| Robert D Olsen | Corporate Development Officer | 26 septembre 2012 M | 34 132 | 0 | 0 | $0 |
| Jon A. Bascom | Sr. Vice President & CIO | 20 avril 2012 M | 782 | 0 | 0 | $0 |
| Timothy W Briggs | Senior Vice President | 23 janvier 2012 M | 4 398 | 0 | 0 | $0 |
| SHEA JAMES | Executive Vice President | 29 septembre 2010 M | 3 735 | 0 | 0 | $0 |
| Bradley W Bacon | Executive Vice President | 18 janvier 2007 M | 400 | 0 | 0 | $0 |
| Daisy L Vanderlinde | Senior Vice President | 15 octobre 2005 A | 1 667 | 0 | 0 | $0 |
| Michael E Longo | Executive Vice President | 15 octobre 2005 A | 3 938 | 0 | 0 | $0 |
| Stephen C Handschuh | Sr. Vice President | 28 septembre 2004 A | · | 0 | 0 | $0 |
| Bret D Easley | Senior Vice President | 28 septembre 2004 A | 1 622 | 0 | 0 | $0 |
| Bruce G Clark | Senior Vice President | 25 septembre 2003 M | 1 000 | 0 | 0 | $0 |
| Brian Hannasch | Administrateur | 29 mai 2026 P | 1 219 | 2 | 0 | $991 639 |
| Sue Gove | Administrateur | 1 janvier 2017 A | 3 078 | 0 | 0 | $0 |
| Robert R Grusky | Administrateur | 11 décembre 2012 M | 1 248 | 0 | 0 | $0 |
| William C Crowley | Administrateur | 2 octobre 2012 M | 1 553 | 0 | 0 | $0 |
| Theodore Warren Ullyot | Administrateur | 13 octobre 2011 M | 760 | 0 | 0 | $0 |
| Charles M Elson | Administrateur | 1 décembre 2008 A | 0 | 0 | 0 | $0 |
| Edward S. Lampert | Administrateur | 12 décembre 2006 M | 13 167 | 0 | 0 | $0 |
| James J Postl | Administrateur | 1 juin 2005 A | · | 0 | 0 | $0 |
| Marsha Johnson Evans | Administrateur | 1 mars 2004 A | · | 0 | 0 | $0 |
| KEEGAN JAMES F | Administrateur | 1 décembre 2003 A | 15 006 | 0 | 0 | $0 |
| ESL INVESTORS LLC | Détenteur de 10% | 1 août 2007 J | 3 003 476 | 0 | 0 | $0 |
| Earl G Graves JR | · | 10 avril 2026 S | 4 837 | 0 | 2 | $-997 686 |
| Richard Craig Smith | · | 23 janvier 2026 M | 2 627 | 0 | 2 | $-33 032 000 |
| Montesinos Constantino Spas | · | 1 janvier 2026 A | 132 | 0 | 0 | $0 |
| Claire Mcdonough | · | 1 janvier 2026 A | 143 | 0 | 0 | $0 |
| Jill A. Soltau | · | 1 janvier 2026 A | 1 254 | 0 | 0 | $0 |
| Gale V. King | · | 1 janvier 2026 A | 1 336 | 0 | 0 | $0 |
| Michael A George | · | 1 janvier 2026 A | 653 | 1 | 0 | $492 729 |
| Linda Goodspeed | · | 1 janvier 2026 A | 2 987 | 0 | 0 | $0 |
| William C Rhodes III | · | 1 janvier 2026 A | 10 202 | 0 | 0 | $0 |
| William R. Hackney | · | 30 septembre 2025 A | 99 | 0 | 0 | $0 |
| George R Mrkonic JR | · | 31 décembre 2024 S | 3 228 | 0 | 3 | $-1 400 046 |
| Enderson Guimaraes | · | 18 décembre 2024 F | 2 295 | 0 | 0 | $0 |
| Grant E. Mcgee | · | 16 janvier 2024 M | 251 | 0 | 0 | $0 |
| Bryan D Jordan | · | 1 janvier 2024 A | 3 098 | 0 | 0 | $0 |
| Albert Saltiel | · | 31 décembre 2023 A | 538 | 0 | 0 | $0 |
| Charles Pleas III | · | 6 décembre 2023 M | 3 416 | 0 | 0 | $0 |
| Kristen C. Wright | · | 31 décembre 2022 A | 208 | 0 | 0 | $0 |
| Seong K. Ohm | · | 30 juin 2022 A | 95 | 0 | 0 | $0 |
| Douglas H Brooks | · | 1 janvier 2022 A | 2 349 | 0 | 0 | $0 |
| Mark A. Finestone | · | 31 décembre 2021 A | 227 | 0 | 0 | $0 |
| Ronald B Griffin | · | 30 septembre 2021 A | 506 | 0 | 0 | $0 |
| Mitchell C. Major | · | 8 janvier 2021 M | 592 | 0 | 0 | $0 |
| Michael M Calbert | · | 1 janvier 2021 A | 2 535 | 0 | 0 | $0 |
| William T Giles | · | 31 décembre 2020 A | 5 512 | 0 | 0 | $0 |
| Luis P Nieto Jr | · | 1 janvier 2019 A | 2 922 | 0 | 0 | $0 |
| William Andrew Mckenna | · | 1 janvier 2019 A | 5 554 | 0 | 0 | $0 |
| William W Graves | · | 6 décembre 2018 G | 3 457 | 0 | 0 | $0 |
| Rodney C. Halsell | · | 2 novembre 2018 M | 377 | 0 | 0 | $0 |
| James C. Griffith | · | 19 janvier 2018 M | 103 | 0 | 0 | $0 |
| HYDE JOSEPH R III | · | 1 janvier 2018 A | 71 930 | 0 | 0 | $0 |
| Gerry N House | · | 11 décembre 2008 M | 1 113 | 0 | 0 | $0 |
Initiés issus des déclarations SEC Form 3/4/5 ; net = uniquement P/S de marché
Détention d'ETF Détenu par 137 ETFs
Le poids reflète uniquement les participations directes en actions (N-PORT) ; les fonds à effet de levier ou basés sur des dérivés peuvent détenir une exposition supplémentaire aux swaps non indiquée.
| Fonds | Poids | Unités | Au | Source |
|---|---|---|---|---|
| RSPD · Invesco Exchange-Traded Fund Trust | 2,32% | 1 898 SH | 23 octobre 2026 | Quotidien |
| SAWG · ETF Series Solutions | 2,20% | 21 NS | 31 juillet 2026 | N-PORT |
| POWA · Invesco Exchange-Traded Self-Indexe… | 2,12% | 1 094 SH | 23 octobre 2026 | Quotidien |
| YOKE · EA Series Trust | 1,65% | 1 279 NS | 31 juillet 2026 | N-PORT |
| QIDX · Spinnaker ETF Series | 1,23% | 158 NS | 31 juillet 2026 | N-PORT |
| RGEF · Tidal Trust III | 1,20% | 3 235 NS | 31 juillet 2026 | N-PORT |
| VOT · VANGUARD INDEX FUNDS | 1,15% | 126 198 SH | 19 août 2026 | Quotidien |
| JGLO · J.P. Morgan Exchange-Traded Fund Tr… | 1,12% | 24 639 NS | 31 juillet 2026 | N-PORT |
| FMAG · FIDELITY COVINGTON TRUST | 1,08% | 878 NS | 31 juillet 2026 | N-PORT |
| RETL · Direxion Shares ETF Trust | 0,93% | 86 NS | 31 juillet 2026 | N-PORT |
| IYC · iShares Trust | 0,82% | 3 297 SH | 11 septembre 2026 | Quotidien |
| VCR · VANGUARD WORLD FUND | 0,81% | 17 440 SH | 19 août 2026 | Quotidien |
| FDIS · FIDELITY COVINGTON TRUST | 0,78% | 4 359 NS | 31 juillet 2026 | N-PORT |
| RXI · iShares Trust | 0,76% | 652 SH | 11 septembre 2026 | Quotidien |
| ESUM · Strategy Shares | 0,74% | 448 NS | 31 juillet 2026 | N-PORT |
| FLRG · FIDELITY COVINGTON TRUST | 0,73% | 703 NS | 31 juillet 2026 | N-PORT |
| FQAL · FIDELITY COVINGTON TRUST | 0,71% | 3 347 NS | 31 juillet 2026 | N-PORT |
| USMV · iShares Trust | 0,71% | 58 323 SH | 11 septembre 2026 | Quotidien |
| WANT · Direxion Shares ETF Trust | 0,68% | 46 NS | 31 juillet 2026 | N-PORT |
| IMCG · iShares Trust | 0,66% | 9 166 SH | 11 septembre 2026 | Quotidien |
| NULG · Nushares ETF Trust | 0,61% | 5 426 NS | 31 juillet 2026 | N-PORT |
| VO · VANGUARD INDEX FUNDS | 0,51% | 357 077 SH | 19 août 2026 | Quotidien |
| QLV · FlexShares Trust | 0,46% | 252 NS | 31 juillet 2026 | N-PORT |
| FDLO · FIDELITY COVINGTON TRUST | 0,46% | 2 147 NS | 31 juillet 2026 | N-PORT |
| JOYT · J.P. Morgan Exchange-Traded Fund Tr… | 0,40% | 130 NS | 31 juillet 2026 | N-PORT |
| ACWV · iShares, Inc. | 0,40% | 4 634 SH | 11 septembre 2026 | Quotidien |
| LCOW · Pacer Funds Trust | 0,34% | 29 NS | 31 juillet 2026 | N-PORT |
| IMCB · iShares Trust | 0,33% | 1 941 SH | 11 septembre 2026 | Quotidien |
| HELO · J.P. Morgan Exchange-Traded Fund Tr… | 0,33% | 5 061 NS | 31 juillet 2026 | N-PORT |
| HUSV · First Trust Exchange-Traded Fund III | 0,30% | 73 NS | 31 juillet 2026 | N-PORT |
| GLBL · Pacer Funds Trust | 0,27% | 1 NS | 31 juillet 2026 | N-PORT |
| XOEF · iShares Trust | 0,26% | 20 SH | 11 septembre 2026 | Quotidien |
| SNPG · DBX ETF Trust | 0,25% | 12 NS | 31 août 2026 | N-PORT |
| JPUS · J.P. Morgan Exchange-Traded Fund Tr… | 0,25% | 376 NS | 31 juillet 2026 | N-PORT |
| ACVF · ETF Opportunities Trust | 0,23% | 114 NS | 31 juillet 2026 | N-PORT |
| RSP · Invesco Exchange-Traded Fund Trust | 0,22% | 67 571 SH | 23 octobre 2026 | Quotidien |
| VFVA · VANGUARD WELLINGTON FUND | 0,22% | 592 SH | 19 août 2026 | Quotidien |
| EUSA · iShares, Inc. | 0,19% | 1 270 SH | 11 septembre 2026 | Quotidien |
| USXF · iShares Trust | 0,19% | 968 SH | 11 septembre 2026 | Quotidien |
| ROUS · Lattice Strategies Trust | 0,19% | 439 NS | 31 juillet 2026 | N-PORT |
| FTC · First Trust Exchange-Traded AlphaDE… | 0,18% | 783 NS | 31 juillet 2026 | N-PORT |
| PFIG · Invesco Exchange-Traded Fund Trust … | 0,18% | 235 000 | 23 octobre 2026 | Quotidien |
| MNZL · EA Series Trust | 0,17% | 14 NS | 31 juillet 2026 | N-PORT |
| SIZE · iShares Trust | 0,16% | 239 SH | 11 septembre 2026 | Quotidien |
| VUG · VANGUARD INDEX FUNDS | 0,16% | 192 961 SH | 19 août 2026 | Quotidien |
| IWX · iShares Trust | 0,15% | 2 053 SH | 11 septembre 2026 | Quotidien |
| ILCG · iShares Trust | 0,15% | 1 611 SH | 11 septembre 2026 | Quotidien |
| BSCT · Invesco Exchange-Traded Self-Indexe… | 0,14% | 4 398 000 | 22 octobre 2026 | Quotidien |
| HQGO · Lattice Strategies Trust | 0,14% | 23 NS | 31 juillet 2026 | N-PORT |
| BSCR · Invesco Exchange-Traded Self-Indexe… | 0,14% | 6 253 000 | 23 octobre 2026 | Quotidien |
| SUSL · iShares Trust | 0,14% | 578 SH | 11 septembre 2026 | Quotidien |
| USSG · DBX ETF Trust | 0,14% | 272 NS | 31 août 2026 | N-PORT |
| BSCU · Invesco Exchange-Traded Self-Indexe… | 0,14% | 3 781 000 | 22 octobre 2026 | Quotidien |
| VONV · VANGUARD SCOTTSDALE FUNDS | 0,13% | 8 589 SH | 19 août 2026 | Quotidien |
| PEVC · Pacer Funds Trust | 0,13% | 1 NS | 31 juillet 2026 | N-PORT |
| BSCS · Invesco Exchange-Traded Self-Indexe… | 0,12% | 4 066 000 | 22 octobre 2026 | Quotidien |
| SNPE · DBX ETF Trust | 0,12% | 1 184 NS | 31 août 2026 | N-PORT |
| DEUS · DBX ETF Trust | 0,12% | 119 NS | 31 août 2026 | N-PORT |
| HEQQ · J.P. Morgan Exchange-Traded Fund Tr… | 0,11% | 11 NS | 31 juillet 2026 | N-PORT |
| IWD · iShares Trust | 0,11% | 31 618 SH | 11 septembre 2026 | Quotidien |
| RWL · Invesco Exchange-Traded Fund Trust … | 0,11% | 3 494 SH | 23 octobre 2026 | Quotidien |
| VOOG · VANGUARD ADMIRAL FUNDS | 0,10% | 7 946 SH | 19 août 2026 | Quotidien |
| TOPC · iShares Trust | 0,10% | 11 SH | 11 septembre 2026 | Quotidien |
| LGDX · Tidal Trust III | 0,09% | 43 NS | 31 juillet 2026 | N-PORT |
| ESGV · VANGUARD WORLD FUND | 0,09% | 3 721 SH | 19 août 2026 | Quotidien |
| FAD · First Trust Exchange-Traded AlphaDE… | 0,09% | 171 NS | 31 juillet 2026 | N-PORT |
| PBUS · Invesco Exchange-Traded Fund Trust … | 0,09% | 2 836 SH | 23 octobre 2026 | Quotidien |
| IVW · iShares Trust | 0,09% | 22 833 SH | 11 septembre 2026 | Quotidien |
| IWL · iShares Trust | 0,08% | 645 SH | 11 septembre 2026 | Quotidien |
| SPXD · DBX ETF Trust | 0,08% | 2 NS | 31 août 2026 | N-PORT |
| GLOF · iShares Trust | 0,08% | 58 SH | 11 septembre 2026 | Quotidien |
| IUSG · iShares Trust | 0,08% | 9 455 SH | 11 septembre 2026 | Quotidien |
| XVV · iShares Trust | 0,08% | 191 SH | 11 septembre 2026 | Quotidien |
| PBP · Invesco Exchange-Traded Fund Trust | 0,08% | 98 SH | 23 octobre 2026 | Quotidien |
| QARP · DBX ETF Trust | 0,08% | 21 NS | 31 août 2026 | N-PORT |
| VOO · VANGUARD INDEX FUNDS | 0,08% | 429 576 SH | 19 août 2026 | Quotidien |
| VV · VANGUARD INDEX FUNDS | 0,08% | 19 242 SH | 19 août 2026 | Quotidien |
| VONE · VANGUARD SCOTTSDALE FUNDS | 0,08% | 2 711 SH | 19 août 2026 | Quotidien |
| TOV · EA Series Trust | 0,08% | 70 NS | 31 juillet 2026 | N-PORT |
| BBUS · J.P. Morgan Exchange-Traded Fund Tr… | 0,08% | 2 299 NS | 31 juillet 2026 | N-PORT |
| DFAU · Dimensional ETF Trust | 0,08% | 3 208 NS | 31 juillet 2026 | N-PORT |
| PTLC · Pacer Funds Trust | 0,08% | 840 NS | 31 juillet 2026 | N-PORT |
| VOTE · TCW ETF Trust | 0,08% | 280 NS | 31 juillet 2026 | N-PORT |
| BKLC · BNY Mellon ETF Trust | 0,08% | 1 377 NS | 31 juillet 2026 | N-PORT |
| DFSU · Dimensional ETF Trust | 0,08% | 569 NS | 31 juillet 2026 | N-PORT |
| IQSU · New York Life Investments ETF Trust | 0,07% | 80 NS | 31 juillet 2026 | N-PORT |
| IUS · Invesco Exchange-Traded Self-Indexe… | 0,07% | 225 SH | 23 octobre 2026 | Quotidien |
| IVV · iShares Trust | 0,07% | 207 411 SH | 11 septembre 2026 | Quotidien |
| DFUS · Dimensional ETF Trust | 0,07% | 4 998 NS | 31 juillet 2026 | N-PORT |
| ILCB · iShares Trust | 0,07% | 322 SH | 11 septembre 2026 | Quotidien |
| SPUU · Direxion Shares ETF Trust | 0,07% | 62 NS | 31 juillet 2026 | N-PORT |
| VTI · VANGUARD INDEX FUNDS | 0,07% | 523 176 SH | 19 août 2026 | Quotidien |
| VTHR · VANGUARD SCOTTSDALE FUNDS | 0,07% | 1 386 SH | 19 août 2026 | Quotidien |
| QDPL · Pacer Funds Trust | 0,07% | 394 NS | 31 juillet 2026 | N-PORT |
| EQAL · Invesco Exchange-Traded Fund Trust … | 0,07% | 173 SH | 23 octobre 2026 | Quotidien |
| PHDG · Invesco Actively Managed Exchange-T… | 0,07% | 13 SH | 23 octobre 2026 | Quotidien |
| IYY · iShares Trust | 0,07% | 712 SH | 11 septembre 2026 | Quotidien |
| IWB · iShares Trust | 0,07% | 11 438 SH | 11 septembre 2026 | Quotidien |
| IWV · iShares Trust | 0,06% | 4 522 SH | 11 septembre 2026 | Quotidien |
| ITOT · iShares Trust | 0,06% | 21 359 SH | 11 septembre 2026 | Quotidien |
| HCMT · Direxion Shares ETF Trust | 0,06% | 116 NS | 31 juillet 2026 | N-PORT |
| VOOV · VANGUARD ADMIRAL FUNDS | 0,06% | 1 323 SH | 19 août 2026 | Quotidien |
| KOKU · DBX ETF Trust | 0,06% | 157 NS | 31 août 2026 | N-PORT |
| SPXL · Direxion Shares ETF Trust | 0,06% | 1 285 NS | 31 juillet 2026 | N-PORT |
| IVE · iShares Trust | 0,06% | 9 609 SH | 11 septembre 2026 | Quotidien |
| TOK · iShares Trust | 0,06% | 46 SH | 11 septembre 2026 | Quotidien |
| URTH · iShares, Inc. | 0,05% | 1 525 SH | 11 septembre 2026 | Quotidien |
| IUSV · iShares Trust | 0,05% | 5 081 SH | 11 septembre 2026 | Quotidien |
| TILT · FlexShares Trust | 0,05% | 384 NS | 31 juillet 2026 | N-PORT |
| DFAC · Dimensional ETF Trust | 0,05% | 8 124 NS | 31 juillet 2026 | N-PORT |
| VT · VANGUARD INTERNATIONAL EQUITY INDEX… | 0,05% | 13 933 SH | 19 août 2026 | Quotidien |
| DCOR · Dimensional ETF Trust | 0,05% | 520 NS | 31 juillet 2026 | N-PORT |
| ACWI · iShares Trust | 0,05% | 5 335 SH | 11 septembre 2026 | Quotidien |
| OMFL · Invesco Exchange-Traded Self-Indexe… | 0,03% | 439 SH | 23 octobre 2026 | Quotidien |
| NULC · Nushares ETF Trust | 0,03% | 6 NS | 31 juillet 2026 | N-PORT |
| PRF · Invesco Exchange-Traded Fund Trust | 0,02% | 728 SH | 23 octobre 2026 | Quotidien |
| IWY · iShares Trust | 0,02% | 1 235 SH | 11 septembre 2026 | Quotidien |
| LRGF · iShares Trust | 0,02% | 261 SH | 11 septembre 2026 | Quotidien |
| VONG · VANGUARD SCOTTSDALE FUNDS | 0,02% | 3 527 SH | 19 août 2026 | Quotidien |
| IWF · iShares Trust | 0,02% | 8 524 SH | 10 septembre 2026 | Quotidien |
| DXUV · Dimensional ETF Trust | 0,00% | 9 NS | 31 juillet 2026 | N-PORT |
| GTO · Invesco Actively Managed Exchange-T… | 0,00% | 1 000 | 20 octobre 2026 | Quotidien |
| FTLS · First Trust Exchange-Traded Fund III | -0,43% | -3 531 NS | 31 juillet 2026 | N-PORT |
| CLSE · Trust for Professional Managers | -0,46% | -1 379 NS | 31 août 2026 | N-PORT |
| LSEQ · Harbor ETF Trust | -1,48% | -75 NS | 31 juillet 2026 | N-PORT |
| BIV · VANGUARD BOND INDEX FUNDS | · | · | 15 juillet 2026 | Quotidien |
| BSV · VANGUARD BOND INDEX FUNDS | · | · | 15 juillet 2026 | Quotidien |
| BND · VANGUARD BOND INDEX FUNDS | · | · | 15 juillet 2026 | Quotidien |
| VUSB · VANGUARD BOND INDEX FUNDS | · | · | 15 juillet 2026 | Quotidien |
| VCRB · VANGUARD MALVERN FUNDS | · | · | 15 juillet 2026 | Quotidien |
| VPLS · VANGUARD MALVERN FUNDS | · | · | 15 juillet 2026 | Quotidien |
| VSDB · VANGUARD MALVERN FUNDS | · | · | 15 juillet 2026 | Quotidien |
| VCSH · VANGUARD SCOTTSDALE FUNDS | · | · | 15 juillet 2026 | Quotidien |
| VCIT · VANGUARD SCOTTSDALE FUNDS | · | · | 15 juillet 2026 | Quotidien |
| VTC · VANGUARD SCOTTSDALE FUNDS | · | · | 30 juillet 2026 | Quotidien |
| BNDW · VANGUARD SCOTTSDALE FUNDS | · | · | 30 juillet 2026 | Quotidien |
| VCEB · VANGUARD WORLD FUND | · | · | 30 juillet 2026 | Quotidien |
AZO Consensus des analystes Opinions des analystes haussières et baissières, objectif de cours à 12 mois, potentiel de hausse
Objectif de cours à 12 mois
23 analystes · 2026-10-27Objectif moyen $3665.61 +16,5%
Comparaison des pairs (sous-secteur GICS) Indicateurs clés par rapport aux pairs du secteur
Base F.A., prix à la clôture de la dernière fin d'exercice de chaque société.
| Ticker | Capitalisation Boursière | P/E | Revenus Année/Année | Marge Nette | ROE | Marge Brute |
|---|---|---|---|---|---|---|
| AZO | $47.90B | 19.4 | 7.4% | 12.7% | -95.1% | 52.3% |
| ORLY | $76.79B | 30.7 | 6.4% | 14.3% | -254.4% | 51.6% |
| CVNA | · | 49.9 | 48.6% | 6.9% | 59.9% | 20.6% |
| PAG | $10.41B | 11.2 | -0.18% | 2.9% | 17.1% | 16.4% |
| MUSA | · | 16.7 | -4.2% | 2.4% | 74.1% | · |
| KMX | $6.12B | 25.7 | -1.8% | 0.96% | 4.1% | 10.8% |
| LAD | $7.81B | 10.3 | 4.0% | 2.2% | 12.4% | 15.2% |
| AN | $7.27B | 12.1 | 3.2% | 2.4% | 27.0% | 17.9% |
| VVV | $4.56B | 21.9 | 5.6% | 12.3% | 71.8% | 38.5% |
| ABG | · | 9.3 | 4.7% | 2.7% | 12.8% | 17.1% |
| GPI | $9.81B | 15.6 | 13.2% | 1.4% | 11.0% | 16.1% |
Dernières actualités Actualités récentes mentionnant cette entreprise
Mes métriques Votre watchlist personnelle — lignes sélectionnées de Fondamentaux Complets
Choisissez les indicateurs qui vous importent — cliquez sur le + à côté de n'importe quelle ligne dans les Fondamentaux complets ci-dessus.
Votre sélection est enregistrée et vous suit sur tous les tickers.