AVGO Broadcom Inc. - Common Stock

NASDAQ · Semiconductors · SEC EDGAR पर देखें ↗
$372.78
मूल्य · अग 21, 2026
मौलिकता इस प्रकार है जून 9, 2026

Broadcom Inc. - Common Stock के बारे में विकिपीडिया से कंपनी का अवलोकन

Broadcom Inc. is an American multinational designer, developer, manufacturer, and global supplier of a wide range of semiconductor and infrastructure software products. Broadcom's product offerings serve the data center, networking, software, broadband, wireless, storage, and industrial markets. As of 2026, Broadcom is one of the largest companies globally.

और पढ़ें

Broadcom Inc. is an American multinational designer, developer, manufacturer, and global supplier of a wide range of semiconductor and infrastructure software products. Broadcom's product offerings serve the data center, networking, software, broadband, wireless, storage, and industrial markets. As of 2026, Broadcom is one of the largest companies globally.

In December 2024, Broadcom became the 12th company to surpass a $1 trillion market cap. In April 2026, Broadcom surpassed a $2 trillion market cap, becoming the sixth company in history to do so. As of 2025, some 58% of Broadcom's revenue came from its semiconductor-based products and 42% from its infrastructure software products and services.

Tan Hock Eng is the company's president and CEO. The company is headquartered in Palo Alto, California. Avago Technologies Limited changed its name to Broadcom to acquire Broadcom Corporation in January 2016. Avago's ticker symbol AVGO now represents the merged entity. The Broadcom Corporation ticker symbol BRCM was retired. Initially the merged entity was known as Broadcom Limited, before assuming the current name in November 2017.

In October 2019, the European Union issued an interim antitrust order against Broadcom concerning anticompetitive business practices which allegedly violate European Union competition law.

In May 2022, Broadcom announced an agreement to acquire VMware in a cash-and-stock transaction valued at $69 billion. The acquisition was closed on November 22, 2023.

History

Origin in Hewlett-Packard

The company that would later become Broadcom Inc. was established in 1961 as HP Associates, a semiconductor products division of Hewlett-Packard.

The division separated from Hewlett-Packard as part of the Agilent Technologies spinoff in 1999.

Formation of Avago Technologies

KKR and Silver Lake Partners acquired the Semiconductor Products Group of Agilent Technologies in 2005 for $2.6 billion and formed Avago Technologies. Avago Technologies agreed to sell its I/O solutions unit to PMC-Sierra for $42.5 million in October 2005.

In August 2008, the company filed an initial public offering of $400 million. In October 2008, Avago Technologies acquired Infineon Technologies' Munich-based bulk acoustic wave business for €21.5 million.

On 6 August 2009, Avago Technologies went public on NASDAQ with the ticker symbol AVGO.

Avago Technologies announced its agreement to acquire CyOptics, an optical chip and component supplier, for $400 million in April 2013. The acquisition aimed to expand Avago Technologies' fiber optics product portfolio. In October 2013, Avago Technologies invested $5 million in Amantys, a power electronics technology provider, as part of a strategic investment agreement between the two companies.

Avago Technologies announced its agreement to acquire LSI Corporation in December 2013 for $6.6 billion. The acquisition helped move Avago Technologies away from specialized products and towards a more mainstream industry, which included chips, especially storage for data centers.

The company sold its SSD controller business to Seagate Technology in May 2014. In August 2014, the company was the ninth-largest semiconductor company. Avago Technologies agreed to sell LSI's Axxia Networking business to Intel for $650 million. The company also agreed to buy PLX Technology, an integrated circuits designer, for $309 million. In February 2015, it was announced that Avago Technologies Limited had reached an agreement to acquire Emulex Corporation for $8 per share in cash.

Acquisition of and change of name to Broadcom Limited

On 28 May 2015, Avago announced that it would buy Broadcom Corporation for $37 billion ($17 billion cash and $20 billion in shares). Avago was the nominal survivor, but the combined company would be named Broadcom Ltd. It would have annual revenue of $15 billion and a market value of $77 billion. Broadcom Corp. strengthened Avago Technologies' patent position significantly in sectors such as mobile, the data center, and the Internet of Things and made the company the ninth largest holder of patents among the top semiconductor vendors, according to an analysis by technology consulting firm LexInnova.

In May 2016, Cypress Semiconductor announced that it acquired Broadcom Corporation's full portfolio of IoT products for $550 million. Under the deal, Cypress acquired Broadcom's IoT products and intellectual property for Wi-Fi, Bluetooth and Zigbee connectivity, as well as Broadcom's WICED platform and SDK for developers. The deal combined Broadcom's developer tools and connectivity technologies for IoT devices with Cypress' own programmable system-on-a-chip (SoC) products that provide memory, computing and graphics processing for low-power devices.

Foreign investment reviews and change of name to Broadcom Inc.

In 2016, Broadcom proposed merging with Brocade Communications Systems. The acquisition proposal included a $5.5 billion price and was offered in cash. It was delayed for review by the Committee on Foreign Investment in the United States. On 2 November 2017, Broadcom announced it would relocate its legal address from Singapore to Delaware, which would avoid the review. This action was linked to the parent company being renamed from Broadcom Limited to Broadcom Inc. The pre-2016-merger Broadcom, Broadcom Corporation, remains a wholly owned subsidiary of the renamed parent Broadcom Inc.

In mid-November 2017, Broadcom proposed to purchase Qualcomm for US$130 billion, which was rebuffed by Qualcomm's board. The proposed hostile takeover, which was later revised to $117 billion, was blocked by the Trump administration by an executive order that cited national security concerns. Specifically, the Committee on Foreign Investment in the United States expressed concerns. Broadcom, then headquartered in Singapore, was considered too close to China and chipmaker Huawei. "A shift to Chinese dominance in 5G would have substantial negative national security consequences for the United States," CFIUS said. "While the United States remains dominant in the standards-setting space currently, China would likely compete robustly to fill any void left by Qualcomm as a result of this hostile takeover." However, critics of the move stated that the decision was motivated by competitiveness more than security concerns. Broadcom withdrew its takeover bid two days after the executive order. Observers have stated that President Trump's decision was as consistent with the balance of trade objectives as it was with security concerns.

Move into software

Historically a semiconductor-based-only company, the failure of the Qualcomm bid led Broadcom and its CEO to look at acquiring infrastructure software as an alternative way of growing in size. On 11 July 2018, news sources reported that Broadcom and CA Technologies agreed on terms for an $18.9 billion acquisition. CA Technologies, formerly known as Computer Associates, was a longtime giant in software for mainframe computers that had expanded its offerings into software for cloud computing. And on 5 November 2018, Broadcom announced that it had completed the acquisition of CA Technologies.

On 9 August 2019, Broadcom acquired the enterprise security business of Symantec Corporation (the consumer software portion of which is now known as Gen Digital) for $10.7 billion in cash. The deal continued Broadcom's push into software critical for corporate infrastructure. And on 4 November 2019, Broadcom announced that it had completed the acquisition of the business, as well as the Symantec name and brand.

In 2019, Broadcom was the fifth best performing stock of the 2010s, with a total return of 1,956%.

Anti-competitive practices investigations

In January 2018, it was reported that the FTC had been investigating Broadcom for several months for engaging in anti-competitive tactics while negotiating with customers. In 2021, Broadcom agreed to settle the antitrust complaint, in which the U.S. Federal Trade Commission claimed that the company abused its monopoly power using restrictive contract terms and threats of retaliation against customers the company deemed "disloyal."

In October 2019, Broadcom was ordered by the European Commission to stop allegedly anticompetitive practices.

In 2021, Broadcom agreed to settle the antitrust complaint which claimed it had abused its monopoly power through restrictive contract terms and threats of retaliation against non-compliant customers. Such contract terms are alleged to stifle innovation and harm competition in the global supply market. European Competition Commissioner Margrethe Vestager said that Broadcom's contract terms with six main customers would "create serious and irreversible harm to competition" if no action were taken. The company agreed to a commitment to suspend agreements containing exclusivity or quasi-exclusivity arrangements and a commitment not to enter into such agreements for seven years.

Following its $69 billion acquisition of VMware in 2023, Broadcom faced renewed European regulatory scrutiny over its licensing of VMware products. In March 2026, the Cloud Infrastructure Service Providers in Europe (CISPE) trade group filed a formal complaint with the European Commission, alleging that Broadcom's licensing of VMware products to cloud service providers infringed EU antitrust rules and requesting interim measures to halt the closure of VMware's cloud service provider programme. CISPE alleged that since the acquisition, prices had risen tenfold, with payment demanded upfront and products bundled regardless of customer need. The European Commission confirmed it was assessing the complaint. Broadcom denied the allegations, stating CISPE was "an organisation funded by hyperscalers, which misrepresent the realities of the market".

Patent suits

In 2017, Broadcom filed patent suits against smart TV manufacturers. The U.S. International Trade Commission ruled in favor of the smart TV manufacturers.

In 2020, Broadcom sued Netflix over multiple patent infringements. Critics have argued that Broadcom is suing Netflix for being more successful, citing the declining number of traditional pay television subscribers due to the rise of streaming services. The Leichtman Research Group calculated that the largest pay TV providers in the U.S. – representing about 95% of the market – lost about 4,915,000 net video subscribers in 2019. Regular customers each pay $231 a year for their boxes, totaling almost $20 billion per year in profit for the cable industry.

2020s

On January 7, 2020, Accenture PLC agreed to acquire Symantec's 300-person cybersecurity services division from Broadcom. In February 2020, Broadcom announced the world's first WiFi 6E client device, the BCM4389. In early 2020, Raspberry Pi Inc. revealed that their new boards would have a Broadcom BCM2711 chip.

In May 2022, Broadcom announced its deal to acquire the virtualization and cloud computing software vendor VMware for $61 billion in a combination of cash and stock, with Broadcom assuming $8 billion in VMware debt. In November 2022, the UK's Competition and Markets Authority regulator announced it would investigate whether the Broadcom Inc. acquisition of VMware Inc. would "result in a substantial lessening of competition within any market or markets in the United Kingdom for goods or services". The European Commission also said it was investigating the proposed acquisition, and as a result, Broadcom and VMware extended the planned completion date out to May 26, 2023. On May 19, 2023, as both UK and EU regulators had yet to complete their investigations, the completion date was formally extended to August 26, 2023, and was later further extended to as late as November 26, 2023.

On November 21, 2023, Broadcom Inc. announced its plan to finalize the $69 billion acquisition of VMware Inc. on the following Wednesday. This acquisition, one of the largest in the technology sector, received global regulatory scrutiny, including from China, which approved the deal with specific conditions. These conditions require VMware's server software to be compatible with local hardware and not restrict customers to using Broadcom's hardware products. Despite concerns over rising China-U.S. tensions, the approval from China, which was the last regulatory hurdle, allowed the deal to proceed. The transaction closed on November 22, 2023. On completion, CEO Hock Tan announced that the company would relocate its headquarters in San Jose to the VMware campus in Palo Alto, California. In February 2024, Broadcom sold the end-user computing division, which it inherited from the VMware acquisition, to KKR for $4 billion.

In July 2026, Broadcom announced that it had extended its partnership with Apple through 2031 to develop and supply custom semiconductor products. Broadcom also supplied Apple with radio-frequency, Wi-Fi, Bluetooth and other networking components used in its devices.

Corporate affairs

Finances

For the fiscal year 2023, Broadcom reported earnings of US$14.08 billion, with an annual revenue of US$35.8 billion, an increase of 7.8% over the previous fiscal cycle.

Ownership

The 10 largest shareholders of Broadcom in early 2024 were:

The Vanguard Group (10.03%)

BlackRock (7.63%)

Capital World Investors (4.53%)

Capital International Investors (4.04%)

State Street Corporation (3.95%)

Geode Capital Management (2.12%)

Insiders (2.04%)

Capital Research Global Investors (1.98%)

Fidelity Investments (1.94%)

Morgan Stanley (1.52%)

Bank of America (1.46%)

Products

Broadcom sells a range of semiconductor and infrastructure software applications that serve the data center (mainframes), networking, software, broadband, wireless, and storage and industrial markets. Common applications for its products include: data center networking, home connectivity, broadband access, telecommunications equipment, smartphones, base stations, data center servers and storage, factory automation, power generation and alternative energy systems, displays, and mainframe operations and management, and application software development.

Broadcom's core technologies and franchise products include networking devices, optical technologies, network interface controllers and data storage.

Vendors have included Broadcom NICs in their products. For example, select Dell PowerEdge blade servers have Broadcom-powered Ethernet port adapters as an add-in card. Other vendors such as Apple, Hewlett Packard Enterprise, and Raspberry Pi also use Broadcom NICs.

Vulnerabilities in SoC WiFi stack

In April 2017, Google's Project Zero investigated Broadcom's SoC WiFi stack and found that it lacked "all basic exploit mitigations - including stack cookies, safe unlinking and access permission protection," allowing "full device takeover by Wi-Fi proximity alone, requiring no user interaction." Numerous smartphones, such as by Apple, Samsung and Google were affected.

Jericho2

Jericho2 is a programmable Ethernet switch chip that has up to 10 Tbit/s switching capacity per device.

Tomahawk 3

Tomahawk 3 series supports high-density, standards-based 400GbE, 200GbE, and 100GbE switching and routing for hyperscale cloud networks. Broadcom divulged that it is bringing two variants of the Tomahawk-3 to market. The first can provide up to 12.8 Tbit/s total chip bandwidth and contains 256 integrated SerDes, supporting 32 ports at 400 Gbit/s, 64 ports at 200 Gbit/s, and 128 ports at 100 Gbit/s. The second variant of the Tomahawk-3 has 160 of the 256 SerDes available and delivers 8 Tbit/s of aggregate bandwidth. Broadcom is suggesting 80 ports at 100 Gbit/s; or 48 ports at 100 Gbit/s plus either 8 ports at 400 Gbit/s or 16 ports at 200 Gbit/s; or 96 ports at 50 Gbit/s plus either 8 ports at 400 Gbit/s or 16 ports at 200 Gbit/s. The Tomahawk 4 reached a speed of 25.6 Tbit/s while the Tomahawk 5 has a maximum speed of 51.2 Tbit/s.

Software

Broadcom has expanded from its original hardware base and also offers enterprise software products.

Symantec Enterprise Security

Broadcom operates its enterprise security business under the Symantec brand. It purchased the suite of enterprise security products from Symantec Corporation in 2019, after which Symantec Corporation changed its name to NortonLifeLock.

BizOps technology

Broadcom also offers products for supporting BizOps, including:

Clarity – product portfolio management

Rally – agile development

Blaze CT – Shift-left testing

DX Operational Intelligence – AIOps

Agile Requirements Designer – model-based testing optimization of processes

XPU

Broadcom uses the term XPU to refer to custom ASIC chips developed in collaboration with major hyperscale clients—such as Google, Meta Platforms and ByteDance—that are tailored for specialized AI workloads.

Broadcom has co-developed Google's Tensor Processing Unit (TPU) chips by translating Google's architecture and specifications into manufacturable silicon, providing proprietary technologies like SerDes high-speed interfaces, overseeing ASIC design, and managing chip fabrication and packaging through third-party foundries such as TSMC, covering all generations since the program's inception. Similarly, Meta's Training and Inference Accelerator (MTIA) chips, first introduced in 2023, were co-developed by Broadcom. In 2024, Broadcom began collaborating with OpenAI to co-develop a custom inference chip, as part of an effort to diversify beyond reliance on Nvidia GPUs amid growing demand.

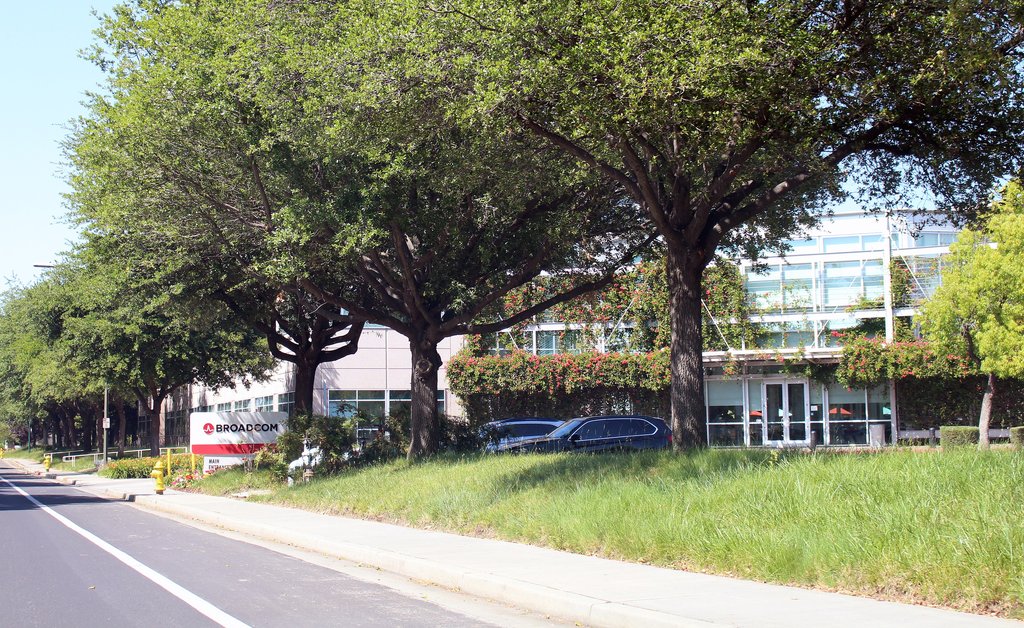
स्रोत: विकिपीडिया (अंग्रेज़ी), CC BY-SA 4.0 · विकिपीडिया पर देखें ↗

Wikidata ↗

AVGO स्टॉक स्नैपशॉट मूल्य, बाजार पूंजीकरण, P/E, EPS, ROE, ऋण/इक्विटी, 52-सप्ताह की सीमा

मूल्य
$372.77
मार्केट कैप
$1.77T
P/E (TTM)
78.1
EPS (TTM)
$4.77
राजस्व (TTM)
$63.89B
लाभांश प्रतिफल
0.63%
ROE
30.7%
D/E ऋण/इक्विटी
0.0
52W रेंज
$287 – $495

AVGO स्टॉक मूल्य चार्ट तकनीकी संकेतकों के साथ दैनिक OHLCV — पैन, ज़ूम और अपना दृश्य कस्टमाइज़ करें

10-वर्षीय प्रदर्शन राजस्व, शुद्ध आय, मार्जिन और ईपीएस रुझान

राजस्व और शुद्ध आय $63.89B
10-point trend, +382.5%
2016-10-30 2025-11-02
EPS $4.77
10-point trend, +198.1%
2016-10-30 2025-11-02
फ्री कैश फ्लो $26.91B
8-point trend, +226.4%
2018-11-04 2025-11-02
मार्जिन 36.2%
8-point trend, +31.6%
2018-11-04 2025-11-02

मूल्यांकन P/E, P/S, P/B, EV/EBITDA अनुपात — क्या स्टॉक महंगा है या सस्ता?

मेट्रिक
5Y रुझान
AVGO
सहकर्मी माध्यिका
P/E (TTM)
5-point trend, +2086.2%
78.1
67.2
P/S (TTM)
5-point trend, +3329.2%
27.7
18.3
P/B
5-point trend, +2350.5%
21.7
7.0
EV / EBITDA
5-point trend, +1074.1%
68.8
Price / FCF (मूल्य / FCF)
5-point trend, +3850.0%
65.7

लाभप्रदता सकल, परिचालन और शुद्ध मार्जिन; ROE, ROA, ROIC

मेट्रिक
5Y रुझान
AVGO
सहकर्मी माध्यिका
Gross Margin (सकल मार्जिन)
5-point trend, +10.4%
67.8%
55.3%
Operating Margin (परिचालन मार्जिन)
5-point trend, +28.6%
39.9%
Net Profit Margin (शुद्ध लाभ मार्जिन)
5-point trend, +47.5%
36.2%
25.6%
ROA
5-point trend, +54.6%
13.7%
13.8%
ROE
5-point trend, +12.2%
30.7%
20.4%
ROIC
5-point trend, +134.2%
30.7%

वित्तीय स्वास्थ्य ऋण, तरलता, शोधन क्षमता — बैलेंस शीट की मजबूती

मेट्रिक
5Y रुझान
AVGO
सहकर्मी माध्यिका
Debt / Equity (ऋण / इक्विटी)
5-point trend, -97.6%
0.0
44.9
Current Ratio (वर्तमान अनुपात)
5-point trend, -35.4%
1.7
2.5
Quick Ratio (त्वरित अनुपात)
5-point trend, -44.4%
1.3

विकास राजस्व, EPS और शुद्ध आय वृद्धि: YoY, 3Y CAGR, 5Y CAGR

मेट्रिक
5Y रुझान
AVGO
सहकर्मी माध्यिका
Revenue YoY (राजस्व YoY)
5-point trend, +132.7%
23.9%
Revenue CAGR 3Y (राजस्व CAGR 3Y)
5-point trend, +132.7%
24.4%
Revenue CAGR 5Y (राजस्व CAGR 5Y)
5-point trend, +132.7%
21.7%
EPS YoY
5-point trend, -68.2%
287.8%
Net Income YoY (शुद्ध आय YoY)
5-point trend, +243.3%
292.3%

प्रति शेयर मेट्रिक्स EPS, प्रति शेयर बुक वैल्यू, प्रति शेयर नकदी प्रवाह, प्रति शेयर लाभांश

मेट्रिक
5Y रुझान
AVGO
सहकर्मी माध्यिका
EPS (Diluted) (EPS (तनुभूत))
5-point trend, -68.2%
$4.77

पूंजी दक्षता एसेट टर्नओवर, इन्वेंटरी टर्नओवर, प्राप्य टर्नओवर

मेट्रिक
5Y रुझान
AVGO
सहकर्मी माध्यिका
Payout Ratio (भुगतान अनुपात)
5-point trend, -47.8%
48.2%

लाभांश यील्ड, भुगतान अनुपात, लाभांश इतिहास, 5Y CAGR

लाभांश यील्ड
0.63%
भुगतान अनुपात
48.2%
5Y लाभांश CAGR
एक्स-डेटराशि
22 जून 2026$0.6500
23 मार्च 2026$0.6500
22 दिसमबर 2025$0.6500
22 सितमबर 2025$0.5900
20 जून 2025$0.5900
20 मार्च 2025$0.5900
23 दिसमबर 2024$0.5900
19 सितमबर 2024$0.5300
24 जून 2024$0.5250
20 मार्च 2024$0.5250
19 दिसमबर 2023$0.5250
20 सितमबर 2023$0.4600
21 जून 2023$0.4600
21 मार्च 2023$0.4600
19 दिसमबर 2022$0.4600
21 सितमबर 2022$0.4100
21 जून 2022$0.4100
21 मार्च 2022$0.4100
21 दिसमबर 2021$0.4100
21 सितमबर 2021$0.3600

AVGO विश्लेषक सर्वसम्मति तेजी और मंदी के विश्लेषक राय, 12-महीने का मूल्य लक्ष्य, अपसाइड

खरीदें 56 विश्लेषक
  • मजबूत खरीद 17 30.4%
  • खरीदें 34 60.7%
  • होल्ड 5 8.9%
  • बेचें 0 0.0%
  • मजबूत बिक्री 0 0.0%

12-महीने का मूल्य लक्ष्य

45 विश्लेषक · 2026-08-17
मध्यिका लक्ष्य $530.00 +42.2%
माध्य लक्ष्य $527.88 +41.6%

Earnings History EPS वास्तविक बनाम अनुमान, आश्चर्य %, बीट दर, अगली आय तिथि

औसत आश्चर्य
0.00%
अगली रिपोर्ट
सित 02, 2026
Period EPS Actual EPS अनुमान आश्चर्य
30 जून 2026 $2.44 $2.45 -0.01%
31 मार्च 2026 $2.05 $2.07 -0.02%
31 दिसमबर 2025 $1.95 $1.90 0.05%
30 सितमबर 2025 $1.69 $1.68 0.01%
30 जून 2025 $1.58 $1.59 -0.01%

सहकर्मी तुलना (GICS उप-उद्योग) प्रमुख मेट्रिक्स बनाम सेक्टर के साथी

टिकर मार्केट कैप P/E राजस्व YoY शुद्ध मार्जिन ROE सकल मार्जिन
AVGO $1.75T 77.5 23.9% 36.2% 30.7% 67.8%
NVDA $4.57T 38.3 65.5% 55.6% 93.3% 71.1%
MU $136.88B 16.1 48.9% 22.8% 16.6% 39.8%
AMD 81.1 34.3%
INTC $180.78B -603.3 -0.47% -0.51% -0.25% 34.8%
TXN 31.8 13.1% 28.3% 30.1% 57.0%
MRVL $68.75B 26.4 42.1% 32.6% 19.3% 51.0%
ADI $114.64B 51.3 16.9% 20.6% 6.6% 61.5%
QCOM $181.72B 33.8 13.7% 12.5% 22.7%
MPWR $44.15B 70.5 26.4% 22.3% 18.0% 55.2%
ALAB $28.31B 136.4 115.1% 25.7% 17.5% 75.7%

पूर्ण मौलिक सभी मेट्रिक्स प्रति वर्ष — आय विवरण, बैलेंस शीट, नकदी प्रवाह

आय विवरण 17
AVGO के लिए वार्षिक आय विवरण डेटा
मेट्रिक रुझान 2025202420232022202120202019201820172016
Revenue 10-point trend, +382.5% $63.89B $51.57B $35.82B $33.20B $27.45B $23.89B $22.60B $20.85B $17.64B $13.24B
Cost of Revenue 10-point trend, +182.1% $20.59B $19.07B $11.13B $11.11B $10.61B $10.37B $10.11B $10.12B $9.13B $7.30B
Gross Profit 10-point trend, +628.9% $43.29B $32.51B $24.69B $22.09B $16.84B $13.52B $12.48B $10.73B $8.51B $5.94B
R&D Expense 10-point trend, +310.5% $10.98B $9.31B $5.25B $4.92B $4.85B $4.97B $4.70B $3.77B $3.30B $2.67B
SG&A Expense 10-point trend, +422.5% $4.21B $4.96B $1.59B $1.38B $1.35B $1.94B $1.71B $1.06B $789M $806M
Operating Expenses 10-point trend, +180.5% $17.81B $19.05B $8.48B $7.87B $8.32B $9.50B $9.04B $5.60B $6.14B $6.35B
Operating Income 10-point trend, +6330.8% $25.48B $13.46B $16.21B $14.22B $8.52B $4.01B $3.44B $5.13B $2.37B $-409M
Interest Expense 9-point trend, +575.7% · $3.95B $1.62B $1.74B $1.89B $1.78B $1.44B $628M $454M $585M
Other Non-op 10-point trend, +4450.0% $455M $406M $512M $-54M $131M $206M $226M $144M $74M $10M
Pretax Income 10-point trend, +2153.2% $22.73B $9.92B $15.10B $12.43B $6.76B $2.44B $2.23B $4.54B $1.82B $-1.11B
Income Tax 10-point trend, -161.8% $-397M $3.75B $1.01B $939M $29M $-518M $-510M $-8.08B $35M $642M
Net Income 10-point trend, +1429.8% $23.13B $5.89B $14.08B $11.49B $6.74B $2.96B $2.72B $12.61B $1.78B $-1.74B
EPS (Basic) 10-point trend, +203.4% $4.91 $1.27 $3.39 $2.74 $15.70 $6.62 $6.77 $29.33 $4.18 $-4.75
EPS (Diluted) 10-point trend, +198.1% $4.77 $1.23 $3.30 $2.65 $15.00 $6.33 $6.43 $28.44 $4.02 $-4.86
Shares (Basic) 10-point trend, +1187.4% 4,712,000,000 4,624,000,000 4,149,000,000 4,089,000,000 410,000,000 402,000,000 398,000,000 418,000,000 405,000,000 366,000,000
Shares (Diluted) 10-point trend, +1167.1% 4,853,000,000 4,778,000,000 4,272,000,000 4,232,000,000 429,000,000 421,000,000 419,000,000 431,000,000 421,000,000 383,000,000
EBITDA 8-point trend, +396.3% $25.48B $13.46B $16.21B $14.22B $8.52B $4.01B $3.44B $5.13B · ·
बैलेंस शीट 30
AVGO के लिए वार्षिक बैलेंस शीट डेटा
मेट्रिक रुझान 2025202420232022202120202019201820172016
Cash & Equivalents 10-point trend, +422.4% $16.18B $9.35B $14.19B $12.42B $12.16B $7.62B $5.05B $4.29B $11.20B $3.10B
Receivables 9-point trend, +191.9% $7.14B $4.42B $3.15B $2.96B $2.07B $2.30B $3.26B $3.33B $2.45B ·
Inventory 9-point trend, +56.9% $2.27B $1.76B $1.90B $1.93B $1.30B $1.00B $874M $1.12B $1.45B ·
Prepaid Expense 9-point trend, +17.7% $518M $1.39B $743M $864M $539M $387M $302M $243M $440M ·
Other Current Assets 9-point trend, +726.0% $5.98B $4.07B $1.61B $1.21B $1.05B $977M $729M $366M $724M ·
Current Assets 9-point trend, +99.5% $31.57B $19.59B $20.85B $18.50B $16.59B $11.89B $9.92B $9.11B $15.82B ·
PP&E (Net) 9-point trend, -2.7% $2.53B $2.52B $2.15B $2.22B $2.35B $2.51B $2.56B $2.63B $2.60B ·
PP&E (Gross) 9-point trend, +81.5% $7.43B $7.03B $6.18B $5.83B $5.54B $5.33B $4.90B $4.53B $4.09B ·
Accum. Depreciation 9-point trend, +227.9% $4.90B $4.50B $4.02B $3.60B $3.20B $2.82B $2.33B $1.89B $1.49B ·
Goodwill 10-point trend, +295.4% $97.80B $97.87B $43.65B $43.61B $43.45B $43.45B $36.71B $26.91B $24.71B $24.73B
Intangibles 9-point trend, +197.9% $32.27B $40.58B $3.87B $7.11B $11.37B $16.78B $17.55B $10.76B $10.83B ·
Other Non-current Assets 9-point trend, +1409.8% $6.92B $5.07B $2.34B $1.80B $1.81B $1.30B $743M $707M $458M ·
Total Assets 9-point trend, +214.4% $171.09B $165.65B $72.86B $73.25B $75.57B $75.93B $67.49B $50.12B $54.42B ·
Accounts Payable 9-point trend, +41.2% $1.56B $1.66B $1.21B $998M $1.09B $836M $855M $811M $1.10B ·
Accrued Liabilities 4-point trend, +212.1% · · · · · $771M $886M $160M $247M ·
Short-term Debt · $0 · · · · · · · ·
Current Liabilities 9-point trend, +632.1% $18.51B $16.70B $7.41B $7.05B $6.28B $6.37B $6.90B $2.34B $2.53B ·
Capital Leases 6-point trend, +124.1% $1.18B $1.14B $359M $389M $460M $527M · · · ·
Deferred Tax 3-point trend, -84.7% · · · · · · $1.53B $115M $10.00B ·
Other Non-current Liabilities 9-point trend, -17.5% $9.30B $14.97B $3.85B $4.41B $4.86B $5.43B $5.61B $3.64B $11.27B ·
Total Liabilities 9-point trend, +187.5% $89.80B $97.97B $48.87B $50.54B $50.58B $52.03B $42.52B $23.47B $31.23B ·
Long-term Debt 6-point trend, +271.2% $65.14B · · · $39.66B $40.99B $32.80B $17.49B $17.55B ·
Total Debt 8-point trend, -82.0% $3.15B $1.25B $1.56B $403M $39.73B $41.06B $32.80B $17.49B · ·
Common Stock 8-point trend, +5000000.00 $5M $5M $4M $0 $0 $0 $0 $0 · ·
Paid-in Capital 8-point trend, +206.2% $71.31B $67.47B $21.09B $21.16B $24.33B $23.98B $25.08B $23.29B · ·
Retained Earnings 9-point trend, +7666.7% $9.76B $0 $2.68B $1.60B $748M $0 $0 $3.49B $-129M ·
AOCI 9-point trend, +339.6% $218M $207M $207M $-54M $-116M $-108M $-140M $-115M $-91M ·
Stockholders' Equity 9-point trend, +250.6% $81.29B $67.68B $23.99B $22.71B $24.96B $23.87B $24.94B $26.66B $23.19B ·
Liabilities + Equity 9-point trend, +214.4% $171.09B $165.65B $72.86B $73.25B $75.57B $75.93B $67.49B $50.12B $54.42B ·
Shares Outstanding 9-point trend, +1059.9% 4,741,000,000 4,686,000,000 4,139,000,000 418,000,000 413,000,000 407,000,000 398,000,000 407,637,618 408,732,155 ·
नकदी प्रवाह 18
AVGO के लिए वार्षिक नकदी प्रवाह डेटा
मेट्रिक रुझान 2025202420232022202120202019201820172016
Stock-based Comp 10-point trend, +1014.6% $7.57B $5.74B $2.17B $1.53B $1.70B $1.98B $2.19B $1.23B $921M $679M
Deferred Tax 10-point trend, -586.4% $-2.03B $1.97B $-501M $-45M $-997M $-1.08B $-787M $-8.55B $-235M $418M
Amort. of Intangibles 7-point trend, +205.4% $8.06B $9.27B $3.25B · · · $5.24B $3.57B $4.29B $2.64B
Restructuring 6-point trend, -87.3% · · $29M $30M $113M $233M $746M $228M · ·
Operating Cash Flow 10-point trend, +707.3% $27.54B $19.96B $18.09B $16.74B $13.76B $12.06B $9.70B $8.88B $6.55B $3.41B
CapEx 10-point trend, -13.8% $623M $548M $452M $424M $443M $463M $432M $635M $1.07B $723M
Investing Cash Flow 10-point trend, +94.1% $-580M $-23.07B $-689M $-667M $-245M $-11.11B $-15.42B $-4.67B $-674M $-9.84B
Debt Issued 10-point trend, -19.7% $15.67B $39.95B $0 $1.94B $9.90B $27.80B $28.79B $0 $17.43B $19.51B
Net Debt Issued 8-point trend, +15666000000.00 $15.67B $39.95B $0 $1.94B $9.90B $27.80B $28.79B $0 · ·
Stock Issued 9-point trend, -14.0% $221M $190M $122M $114M $170M $276M $253M $212M $257M ·
Stock Repurchased 10-point trend, +2450000000.00 $2.45B $7.18B $5.82B $7.00B $0 $0 $5.43B $7.26B $0 $0
Net Stock Activity 8-point trend, +69.3% $-2.23B $-6.99B $-5.70B $-6.89B $170M $276M $-5.18B $-7.26B · ·
Dividends Paid 10-point trend, +1385.6% $11.14B $9.81B $7.64B $7.03B $6.21B $5.53B $4.24B $3.00B $1.75B $750M
Financing Cash Flow 10-point trend, -361.3% $-20.13B $-1.73B $-15.62B $-15.82B $-8.97B $1.61B $6.49B $-11.12B $2.23B $7.70B
Net Change in Cash 10-point trend, +435.7% $6.83B $-4.84B $1.77B $253M $4.54B $2.56B $763M $-6.91B $8.11B $1.27B
Taxes Paid 10-point trend, +969.8% $2.59B $3.15B $1.78B $908M $775M $501M $741M $512M $349M $242M
Free Cash Flow 8-point trend, +226.4% $26.91B $19.41B $17.63B $16.31B $13.32B $11.60B $9.27B $8.24B · ·
Levered FCF 7-point trend, +160.8% · $16.96B $16.12B $14.71B $11.44B $9.44B $7.49B $6.50B · ·
लाभप्रदता 8
AVGO के लिए वार्षिक लाभप्रदता डेटा
मेट्रिक रुझान 2025202420232022202120202019201820172016
Gross Margin 8-point trend, +31.6% 67.8% 63.0% 68.9% 66.5% 61.4% 56.6% 55.2% 51.5% · ·
Operating Margin 8-point trend, +62.0% 39.9% 26.1% 45.2% 42.8% 31.0% 16.8% 15.2% 24.6% · ·
Net Margin 8-point trend, -38.4% 36.2% 11.4% 39.3% 34.6% 24.5% 12.4% 12.0% 58.8% · ·
Pretax Margin 8-point trend, +63.2% 35.6% 19.2% 42.1% 37.5% 24.6% 10.2% 9.8% 21.8% · ·
EBITDA Margin 8-point trend, +62.0% 39.9% 26.1% 45.2% 42.8% 31.0% 16.8% 15.2% 24.6% · ·
ROA 8-point trend, -41.4% 13.7% 4.9% 19.3% 15.4% 8.9% 4.1% 4.6% 23.4% · ·
ROE 8-point trend, -37.7% 30.7% 8.8% 61.1% 52.8% 27.3% 12.5% 11.7% 49.2% · ·
ROIC 8-point trend, -5.0% 30.7% 12.2% 59.2% 56.9% 13.1% 7.5% 7.3% 32.3% · ·
तरलता और शोधन क्षमता 5
AVGO के लिए वार्षिक तरलता और शोधन क्षमता डेटा
मेट्रिक रुझान 2025202420232022202120202019201820172016
Current Ratio 8-point trend, -56.2% 1.7 1.2 2.8 2.6 2.6 1.9 1.4 3.9 · ·
Quick Ratio 8-point trend, -61.3% 1.3 0.8 2.3 2.2 2.3 1.6 1.2 3.3 · ·
Debt / Equity 8-point trend, -94.1% 0.0 0.0 0.1 0.0 1.6 1.7 1.3 0.7 · ·
LT Debt / Equity 4-point trend, +140.8% · · · · 1.6 1.7 1.2 0.7 · ·
Interest Coverage 7-point trend, -58.3% · 3.4 10.0 8.2 4.5 2.3 2.4 8.2 · ·
दक्षता 3
AVGO के लिए वार्षिक दक्षता डेटा
मेट्रिक रुझान 2025202420232022202120202019201820172016
Asset Turnover 8-point trend, -4.9% 0.4 0.4 0.5 0.4 0.4 0.3 0.4 0.4 · ·
Inventory Turnover 8-point trend, +29.9% 10.2 10.4 5.8 6.9 9.2 11.1 10.1 7.9 · ·
Receivables Turnover 8-point trend, +53.0% 11.1 13.6 11.7 13.2 12.6 8.6 6.9 7.2 · ·
प्रति शेयर 7
AVGO के लिए वार्षिक प्रति शेयर डेटा
मेट्रिक रुझान 2025202420232022202120202019201820172016
Book Value / Share 8-point trend, -73.8% $17.15 $14.44 $57.94 $54.33 $60.44 $58.66 $62.74 $65.39 · ·
Revenue / Share 8-point trend, -72.8% $13.16 $10.79 $83.89 $78.49 $63.99 $56.74 $53.93 $48.37 · ·
Cash Flow / Share 8-point trend, -72.5% $5.67 $4.18 $42.35 $39.56 $32.08 $28.65 $23.14 $20.60 · ·
Cash / Share 8-point trend, -67.6% $3.41 $1.99 $34.27 $29.70 $29.45 $18.72 $12.71 $10.53 · ·
Dividend / Share 4-point trend, +218.6% · · · · · $13 $11 $7 $4 ·
Dividend Paid / Share 10-point trend, +21.6% $2 $2 $2 $2 $14 $13 $11 $7 $4 $2
EPS (TTM) 8-point trend, -83.2% $4.77 $1.23 $3.30 $2.65 $15.00 $6.33 $6.43 $28.44 · ·
विकास दरें 10
AVGO के लिए वार्षिक विकास दरें डेटा
मेट्रिक रुझान 2025202420232022202120202019201820172016
Revenue YoY 5-point trend, +60.1% 23.9% 44.0% 7.9% 21.0% 14.9% · · · · ·
Revenue CAGR 3Y 3-point trend, +68.6% 24.4% 23.4% 14.5% · · · · · · ·
Revenue CAGR 5Y 21.7% · · · · · · · · ·
EPS YoY 5-point trend, +110.1% 287.8% -62.7% 24.5% -82.3% 137.0% · · · · ·
EPS CAGR 3Y 3-point trend, +210.9% 21.6% -56.6% -19.5% · · · · · · ·
EPS CAGR 5Y -5.5% · · · · · · · · ·
Net Income YoY 5-point trend, +129.1% 292.3% -58.1% 22.5% 70.7% 127.6% · · · · ·
Net Income CAGR 3Y 3-point trend, -61.5% 26.2% -4.3% 68.2% · · · · · · ·
Net Income CAGR 5Y 50.9% · · · · · · · · ·
Dividend CAGR 5Y 15.0% · · · · · · · · ·
मूल्यांकन (TTM) 16
AVGO के लिए वार्षिक मूल्यांकन (TTM) डेटा
मेट्रिक रुझान 2025202420232022202120202019201820172016
Revenue TTM 8-point trend, +206.4% $63.89B $51.57B $35.82B $33.20B $27.45B $23.89B $22.60B $20.85B · ·
Net Income TTM 8-point trend, +83.4% $23.13B $5.89B $14.08B $11.49B $6.74B $2.96B $2.72B $12.61B · ·
Market Cap 8-point trend, +19372.6% $1.75T $791.56B $34.71B $19.77B $21.96B $14.23B $11.79B $9.00B · ·
Enterprise Value 8-point trend, +7734.9% $1.74T $783.46B $22.08B $7.75B $49.52B $47.67B $39.53B $22.20B · ·
P/E 8-point trend, +9882.0% 77.5 137.3 25.4 17.8 3.5 5.5 4.6 0.8 · ·
P/S 8-point trend, +6253.9% 27.4 15.3 1.0 0.6 0.8 0.6 0.5 0.4 · ·
P/B 8-point trend, +6285.4% 21.6 11.7 1.4 0.9 0.9 0.6 0.5 0.3 · ·
P / Cash Flow 8-point trend, +6179.7% 63.6 39.7 1.9 1.2 1.6 1.2 1.2 1.0 · ·
P / FCF 8-point trend, +5865.3% 65.1 40.8 2.0 1.2 1.6 1.2 1.3 1.1 · ·
EV / EBITDA 8-point trend, +1478.7% 68.3 58.2 1.4 0.5 5.8 11.9 11.5 4.3 · ·
EV / FCF 8-point trend, +2300.2% 64.6 40.4 1.3 0.5 3.7 4.1 4.3 2.7 · ·
EV / Revenue 8-point trend, +2456.7% 27.2 15.2 0.6 0.2 1.8 2.0 1.7 1.1 · ·
Dividend Yield 8-point trend, -98.1% 0.64% 1.2% 22.0% 35.6% 28.3% 38.9% 35.9% 33.3% · ·
Earnings Yield 8-point trend, -99.0% 1.3% 0.73% 3.9% 5.6% 28.2% 18.1% 21.7% 128.8% · ·
Payout Ratio 8-point trend, +97.0% 48.2% 166.5% 54.3% 61.2% 92.2% 187.0% 155.5% 24.5% · ·
Annual Payout 8-point trend, +271.6% $11.14B $9.81B $7.64B $7.03B $6.21B $5.53B $4.24B $3.00B · ·

वित्तीय विवरण आय विवरण, बैलेंस शीट, नकदी प्रवाह — वार्षिक, पिछले 5 वर्ष

आय विवरण
2025-11-022024-11-032023-10-292022-10-302021-10-31
राजस्व $63.89B$51.57B$35.82B$33.20B$27.45B
सकल मार्जिन % 67.8%63.0%68.9%66.5%61.4%
परिचालन मार्जिन % 39.9%26.1%45.2%42.8%31.0%
शुद्ध आय $23.13B$5.89B$14.08B$11.49B$6.74B
तनुकरणित EPS $4.77$1.23$3.30$2.65$15.00
बैलेंस शीट
2025-11-022024-11-032023-10-292022-10-302021-10-31
ऋण / इक्विटी 0.00.00.10.01.6
वर्तमान अनुपात 1.71.22.82.62.6
त्वरित अनुपात 1.30.82.32.22.3
नकदी प्रवाह
2025-11-022024-11-032023-10-292022-10-302021-10-31
फ्री कैश फ्लो $26.91B$19.41B$17.63B$16.31B$13.32B

AVGO एआई विश्लेषक पैनल — तेजी और मंदी के विचार स्टॉक की संभावनाओं पर 2026Q2 बहस: क्लॉड, ग्रोक, जेमिनी, चैटजीपीटी

राउंड 1 — शुरुआती विचार

Grok BULLISH 0.80
↑ तेजी

मैं ब्रॉडकॉम को मेटा जैसे हाइपरस्केलर्स के लिए कस्टम चिप्स के साथ AI इंफ्रास्ट्रक्चर पर हावी होते हुए देखता हूं, जिससे 2026 तक राजस्व में तेजी आएगी। AI राजस्व Q1 FY2026 में $8.4 बिलियन तक दोगुना हो गया, जैसा कि 17 अप्रैल को रिपोर्ट किया गया था, यह दर्शाता है कि हाइपरस्केलर की मांग बढ़ रही है और ब्रॉडकॉम की डिजाइन जीत बहु-वर्षीय सौदों को सुरक्षित कर रही है। ROE बढ़कर 31.5% हो गया, जो TXN के 30% और MU के 22% जैसे साथियों से आगे निकल गया, जिसका अर्थ है कि उच्च-मार्जिन वाले सॉफ्टवेयर का सेमी के साथ मिश्रण से बेहतर पूंजी दक्षता है। शुद्ध मार्जिन बढ़कर 36.2% हो गया, जो रिटर्न को कम किए बिना AI विस्तार को निधि देने वाली मूल्य निर्धारण शक्ति को साबित करता है।

↓ मंदी

मेरा अनुमान है कि ब्रॉडकॉम के महंगे मूल्यांकन के लिए निर्दोष AI निष्पादन की आवश्यकता है, लेकिन किसी भी मंदी से तेज गिरावट का खतरा है। P/E 71 पर है, जो NVDA के 46 और सहकर्मी माध्यिका से काफी ऊपर है, यह दर्शाता है कि बाजार ने बिना किसी चूक के मार्जिन के साथ वर्षों की पूर्णता को मूल्य में शामिल कर लिया है। P/B पिछली तिमाही में 11.6 से बढ़कर 21 हो गया, जो विकास में कमी आने पर शेयरधारकों को नुकसान के प्रति उजागर करता है। ऋण/इक्विटी 80% पर सुधार के बावजूद ऊंचा बना हुआ है, जिसका अर्थ है कि यदि AI से नकदी प्रवाह निराश करता है तो लीवरेज जोखिमों को बढ़ाता है।

Claude NEUTRAL 0.68
↑ तेजी

ब्रॉडकॉम सिद्ध ग्राहक चिपचिपाहट और मूल्य निर्धारण शक्ति के साथ संरचनात्मक AI इंफ्रास्ट्रक्चर मांग को कैप्चर कर रहा है। AI राजस्व Q1 में $8.4 बिलियन तक दोगुना हो गया, और मेटा डील विस्तार एक ऐसे बाजार में दीर्घकालिक अनुबंध जीत का संकेत देता है जहां क्षमता की बाधाएं मौजूदा कंपनियों के पक्ष में हैं। EPS तिमाही-दर-तिमाही 21% बढ़कर $4.76 हो गया, और शुद्ध मार्जिन बढ़कर 36.2% हो गया - वह मार्जिन आपको बताता है कि कंपनी AI राजस्व को वास्तविक लाभ में परिवर्तित कर रही है, न कि केवल शीर्ष-पंक्ति शोर। एक साल पहले 96.69 से ऋण-से-इक्विटी 80.13 तक गिर गया, यह दर्शाता है कि व्यवसाय निवेश करते समय डी-लीवरेज करने के लिए पर्याप्त नकदी उत्पन्न करता है।

↓ मंदी

मूल्यांकन ने पहले ही 70.96 के P/E पर AI विकास के वर्षों को मूल्य में शामिल कर लिया है - ब्रॉडकॉम के 31.47% ROE के बावजूद जो Nvidia के 103.8% का आधा है, लगभग 2.6 गुना Nvidia का 45.7। वह अंतर मायने रखता है: Nvidia शेयरधारक पूंजी को संरचनात्मक रूप से बेहतर दर पर लाभ में बदलता है, फिर भी छूट पर कारोबार करता है। मेटा समाचारों पर छह सप्ताह में 35% की रैली हुई है, जो वास्तविक है लेकिन AI थीसिस के लिए नया नहीं है। यदि AI capex चक्र सामान्य हो जाते हैं या मेटा और हाइपरस्केलर्स के आसपास ग्राहक एकाग्रता जोखिम उत्पन्न होता है, तो कई संपीड़न गंभीर हो सकता है। स्टॉक पूर्णता का मूल्य निर्धारण कर रहा है।

Gemini NEUTRAL 0.75
↑ तेजी

ब्रॉडकॉम खुद को AI इंफ्रास्ट्रक्चर बूम के लिए अनिवार्य उपयोगिता प्रदाता के रूप में सफलतापूर्वक मजबूत कर रहा है। कंपनी का AI राजस्व हाल की तिमाही में $8.4 बिलियन तक दोगुना हो गया, जो पुष्टि करता है कि वे मेटा जैसे हाइपरस्केलर्स से भारी, आवर्ती मांग को कैप्चर कर रहे हैं। यह 36.2% शुद्ध लाभ मार्जिन वाला व्यवसाय है। लाभप्रदता का वह स्तर का मतलब है कि वे प्रत्येक बिक्री डॉलर के एक तिहाई से अधिक को सीधे बॉटम-लाइन नकदी में परिवर्तित कर रहे हैं, जिससे भविष्य के आर एंड डी के लिए एक बड़ा कुशन प्रदान होता है। 1.71 के वर्तमान अनुपात के साथ, उनके पास महंगे पूंजी बाजारों में टैप करने की आवश्यकता के बिना इन दीर्घकालिक कस्टम चिप साझेदारी को निधि देने के लिए पर्याप्त तरलता है।

↓ मंदी

मूल्यांकन बस अंतर्निहित विकास वास्तविकता से अलग हो गया है, जिससे निवेशकों के लिए त्रुटि के लिए लगभग शून्य मार्जिन बचा है। हम 70.96 P/E अनुपात को देख रहे हैं। वह गुणक का अर्थ है कि बाजार आने वाले वर्षों के लिए लगभग पूर्ण निष्पादन का मूल्य निर्धारण कर रहा है, जो एक चक्रीय सेमीकंडक्टर उद्योग में एक खतरनाक शर्त है। इसके अलावा, 25.69 का मूल्य-से-बिक्री अनुपात बताता है कि स्टॉक अपने ऐतिहासिक औसत की तुलना में काफी प्रीमियम पर कारोबार कर रहा है। जब आप राजस्व के लिए इतना भुगतान करते हैं, तो उनके प्रमुख भागीदारों से AI पूंजीगत व्यय में कोई भी मामूली मंदी इस स्टॉक को नीचे की ओर तेजी से री-रेट कर सकती है।

Chatgpt NEUTRAL 0.63
↑ तेजी

मुझे लगता है कि ब्रॉडकॉम का AI-संचालित डेटा-सेंटर गति और इंफ्रास्ट्रक्चर नेतृत्व एक मजबूत तेजी का मामला बनाते हैं। ROE TTM 31.47% है। इसका मतलब है कि ब्रॉडकॉम इक्विटी को उच्च दर पर मुनाफे में बदल रहा है, जो कुशल पूंजी उपयोग का संकेत देता है जो उच्च मूल्यांकन का समर्थन करता है। सकल मार्जिन TTM 67.89% है। वह मार्जिन नकदी प्रवाह की गुणवत्ता और लाभप्रदता को बनाए रखते हुए AI निवेश को निधि देने की क्षमता को रेखांकित करता है। EPS TTM 4.76 है। यह एक ठोस कमाई आधार दिखाता है जो AI मांग में तेजी के रूप में बढ़ सकता है, खासकर मेटा की विस्तारित साझेदारी के साथ।

↓ मंदी

मुझे लगता है कि यहां सबसे बड़ा जोखिम मूल्यांकन और AI खर्च अनिश्चितता है जो गुणक को संपीड़ित कर सकता है। P/E TTM 70.96x है। यदि AI वृद्धि धीमी हो जाती है या मार्जिन दबाव में आ जाता है तो यह थोड़ा कुशन छोड़ता है। ऋण/इक्विटी 80.13 है। वह लीवरेज पुनर्वित्त जोखिम को बढ़ाता है और मंदी में नीचे की ओर सुरक्षा को कमजोर करता है। P/B वार्षिक 21.06x है। यह बताता है कि निवेशक विकास के लिए संपत्ति मूल्य से काफी ऊपर भुगतान कर रहे हैं, इसलिए कोई भी गड़बड़ी तेजी से री-रेटिंग का कारण बन सकती है।

राउंड 2 — प्रतिक्रियाएं और खंडन

Grok

क्लाउड, आपका बियर केस Nvidia के ROE श्रेष्ठता पर अत्यधिक जोर देता है जबकि ब्रॉडकॉम के अन्य सेमी साथियों पर बढ़त को नजरअंदाज करता है। Nvidia का 104% ROE शुद्ध GPU प्रभुत्व से एक आउटलायर है, लेकिन ब्रॉडकॉम का 31% TXN के 30% और MU के 22% से ऊपर है, जो कस्टम चिप्स और नेटवर्किंग जैसे विविध AI इंफ्रास्ट्रक्चर में बेहतर पूंजी दक्षता का संकेत देता है। वह सहकर्मी-बीटिंग रिटर्न, साथ ही घटता ऋण/इक्विटी 97 से 80 तक, पूर्णता को माने बिना मूल्यांकन बहसों के माध्यम से रखने का समर्थन करता है।

Claude

मुझे ग्रोक के ROE तुलना पर वापस धकेलने की जरूरत है। ग्रोक का कहना है कि ब्रॉडकॉम का 31.5% ROE टेक्सास इंस्ट्रूमेंट्स के 30% और माइक्रोन के 22% जैसे साथियों से आगे निकल जाता है, लेकिन यह वास्तविक सहकर्मी सेट को याद करता है। Nvidia का ROE 103.8% है - ब्रॉडकॉम के तीन गुना से अधिक। जब हम AI इंफ्रास्ट्रक्चर प्रभुत्व की बात कर रहे हैं, तो Nvidia वास्तविक तुलना है, TXN नहीं। ब्रॉडकॉम का ROE एक विविध चिपमेकर के लिए ठोस है, लेकिन यह AI दौड़ में बेहतर पूंजी दक्षता नहीं है। 31% और 104% के बीच का वह अंतर पूरी मूल्यांकन कहानी है जिसे ग्रोक ने नजरअंदाज कर दिया।

Gemini

ग्रोक, मैं आपकी खरीद रेटिंग से असहमत हूं क्योंकि आप वर्तमान 70.96 के P/E में निहित मूल्यांकन जोखिम को कम आंक रहे हैं। वह गुणक का अर्थ है कि निवेशक प्रति डॉलर आय के लिए 70 डॉलर से अधिक का भुगतान कर रहे हैं, जो हाइपरस्केलर खर्च चक्र को एक स्पीड बंप हिट होने पर त्रुटि के लिए लगभग कोई जगह नहीं छोड़ता है। जबकि आप 31.47% ROE में दक्षता लाभ को सही ढंग से उजागर करते हैं, वह मीट्रिक दर्शाता है कि प्रबंधन लाभ उत्पन्न करने के लिए शेयरधारक पूंजी का कितनी प्रभावी ढंग से उपयोग करता है, और आज की कीमत पर, आप सस्ते, उच्च-विकास वाले विकल्पों की तुलना में उस दक्षता के लिए बस अधिक भुगतान कर रहे हैं।

Chatgpt

क्लाउड, P/E 70.96 के बारे में आपका बिंदु मान्य है, लेकिन टेकअवे AI विकास के लिए भुगतान करने के जोखिम-इनाम के बारे में है। इसका मतलब है कि बाजार AI-संचालित विकास के वर्षों को मूल्य में शामिल कर रहा है। वह प्रीमियम थोड़ा कुशन छोड़ता है यदि AI capex धीमा हो जाता है या यदि मेटा/ग्राहक एकाग्रता अस्थिर हो जाती है। ब्रॉडकॉम की लाभप्रदता और नकदी प्रवाह की गुणवत्ता उस प्रीमियम की कुछ रक्षा प्रदान करती है, लेकिन लीवरेज और चक्रीयता 2026Q2 तक जोखिम को बनाए रखती है।

राउंड 3 — अंतिम खंडन

G
Grok

चैटजीपीटी, मैं ऋण/इक्विटी पर आपके बियरिश रीड पर क्लाउड का पक्ष लेता हूं - ब्रॉडकॉम की बैलेंस शीट 2026Q2 में सार्थक रूप से मजबूत हो रही है। एक साल पहले 96.69 से ऋण/इक्विटी 80.13 तक गिर गया। वह गिरावट साबित करती है कि व्यवसाय AI जीत जैसे मेटा विस्तार को निधि देते हुए लीवरेज को कम करने के लिए पर्याप्त नकदी उत्पन्न करता है, ब्याज लागत को कम करता है और यदि दरें ऊंची रहती हैं तो लचीलापन बढ़ाता है। वर्तमान अनुपात बढ़कर 1.71 हो गया। 1.0 से ऊपर की वह तरलता अल्पकालिक दायित्वों को आराम से कवर करने की पुष्टि करती है, जिससे आपके द्वारा बताई गई पुनर्वित्त जोखिम कम हो जाती है।

C
Claude

मैं कुछ ऐसा कहना चाहता हूं जिस पर किसी ने अभी तक चुनौती नहीं दी है: ग्रोक का दावा है कि ब्रॉडकॉम का 31% ROE 'TXN के 30% और MU के 22% जैसे साथियों से आगे निकल जाता है।' वह एक तर्क जीतने के लिए सहकर्मी सेट का चेरी-पिकिंग है। असली मुद्दा ग्राहक एकाग्रता है। मेटा और हाइपरस्केलर्स संभवतः वर्तमान में ब्रॉडकॉम के AI राजस्व का 40-50% का प्रतिनिधित्व करते हैं - हमारे पास सटीक ब्रेकआउट नहीं हैं, लेकिन समाचार प्रवाह इसे चीखता है। जब एक ग्राहक खंड आपकी विकास कहानी का इतना अधिक हिस्सा चलाता है, तो मेटा से एक एकल capex विराम या आंतरिक चिप डिजाइन में बदलाव रातोंरात थीसिस को टैंक कर सकता है। ग्रोक का खरीद मामला मानता है कि ब्रॉडकॉम हाइपरस्केलर वफादारी को लॉक करता है, लेकिन कस्टम चिप्स केवल तब तक चिपचिपे होते हैं जब तक वे नहीं होते। वह जोखिम है जिसे किसी ने अभी तक परिमाणित नहीं किया है।

G
Gemini

मैं ग्रोक और क्लाउड को ग्राहक एकाग्रता जोखिम पर चुनौती देना चाहता हूं, जो ब्रॉडकॉम के लिए कमरे में हाथी है। आप दोनों मेटा साझेदारी को एक शुद्ध जीत के रूप में मान रहे हैं, लेकिन ब्रॉडकॉम का राजस्व कुछ हाइपरस्केलर्स से भारी रूप से जुड़ा हुआ है, और यह एक बड़े एकल-बिंदु-विफलता जोखिम का निर्माण करता है। यदि वे विशिष्ट फर्म अपने आंतरिक डिजाइन रोडमैप को बदलते हैं या कस्टम सिलिकॉन से पूंजी हटाते हैं, तो ब्रॉडकॉम का राजस्व विकास रातोंरात रुक सकता है। हम 25.69 का P/S अनुपात देख रहे हैं, जो वह कीमत है जो निवेशक बिक्री के प्रत्येक डॉलर के लिए भुगतान करते हैं। उस मूल्यांकन पर, आप एक बहुत छोटे ग्राहक आधार से सही, निर्बाध खर्च पर दांव लगा रहे हैं।

C
Chatgpt

क्लाउड, मैं 2026Q2 में AVGO को स्थानांतरित कर सकने वाले नियामक और ग्राहक-एकाग्रता जोखिमों के लिए फ्रेम को चौड़ा करना चाहता हूं। AI राजस्व Q1 FY2026 में लगभग $8.4 बिलियन पर चल रहा है। वह गति AI इंफ्रास्ट्रक्चर में ब्रॉडकॉम की भूमिका की पुष्टि करती है और नकदी प्रवाह की गुणवत्ता का समर्थन करती है, लेकिन स्टॉक का मूल्यांकन पहले से ही उस विकास को मूल्य में शामिल करता है। नियामक जोखिम वास्तविक है: उन्नत AI चिप्स पर अमेरिकी निर्यात नियंत्रण और संभावित यूरोपीय जांच हाइपरस्केलर्स के साथ भविष्य के सौदों को सीमित कर सकती है। इसके अतिरिक्त, मेटा जैसे हाइपरस्केलर्स के साथ ग्राहक एकाग्रता किसी भी सौदे में मंदी को बढ़ा सकती है।

मूल्य पूर्वानुमान

मॉडल 3M लक्ष्य 6M लक्ष्य तर्क
G Grok 3M लक्ष्य $215.00 6M लक्ष्य $245.00 तर्क ब्रॉडकॉम के कस्टम AI चिप्स बहु-वर्षीय हाइपरस्केलर सौदों को लॉक कर रहे हैं, जिससे राजस्व में तेजी आ रही है जो $192 से 12-27% की वृद्धि को उचित ठहराती है, भले ही उच्च P/E हो। मुख्य उत्प्रेरक जुलाई 2026 के अंत में Q2 FY2026 आय है, जहां $10 बिलियन से अधिक की AI राजस्व मार्गदर्शन मेटा विस्तार की गति की पुष्टि करेगा और एकाग्रता के डर को कुचल देगा। बड़ा जोखिम मेटा capex विराम घोषणा है, जो रातोंरात 20% गुणक संपीड़न को ट्रिगर कर सकता है। $245 के लक्ष्य पर, फॉरवर्ड P/E $5.50 EPS पर लगभग 50x तक संपीड़ित हो जाता है - अभी भी एक प्रीमियम, लेकिन 30% + AI वृद्धि के लिए उचित है जो सेमी साथियों से आगे निकल जाता है।
C Claude 3M लक्ष्य $215.00 6M लक्ष्य $235.00 तर्क ब्रॉडकॉम का AI इंफ्रास्ट्रक्चर मोटल वास्तविक है, लेकिन स्टॉक ने पहले ही 71x P/E पर निर्दोष निष्पादन के वर्षों को मूल्य में शामिल कर लिया है - लगभग Nvidia के गुणक का 1.6 गुना होने के बावजूद आधी पूंजी दक्षता। मेरा थीसिस: स्टॉक छह महीने में कम री-रेट करता है क्योंकि बाजार ग्राहक एकाग्रता जोखिम को पचाता है और गुणक को 50-55x की ओर सामान्य करता है, जो एक चक्रीय उद्योग में 30% + ROE के लिए एक उचित प्रीमियम है। उत्प्रेरक: मेटा का Q2 2026 आय मार्गदर्शन AI capex प्रक्षेपवक्र पर - कोई भी मॉडरेशन गुणक संपीड़न को ट्रिगर करता है। जोखिम: हाइपरस्केलर capex सर्वसम्मति से आगे बढ़ता है, प्रीमियम को मान्य करता है। 71x आय पर, ब्रॉडकॉम को त्रुटि के लिए शून्य मार्जिन की आवश्यकता होती है; 50x पर, यह रक्षात्मक हो जाता है। मैं अपनी होल्ड रेटिंग बनाए रख रहा हूं लेकिन तीन महीनों में $215 तक नीचे की ओर और Q2 2026 तक $235 के पास स्थिर होने की उम्मीद करता हूं क्योंकि गुणक व्यवस्थित हो जाता है।
G Gemini 3M लक्ष्य $205.00 6M लक्ष्य $220.00 तर्क मेरा मानना ​​है कि ब्रॉडकॉम अपने कस्टम सिलिकॉन जीत को एकीकृत करने के साथ उच्च स्तर पर जाएगा, लेकिन स्टॉक अपने अत्यधिक मूल्यांकन से सीमित है। मेरा 6 महीने का लक्ष्य Q3 आय कॉल पर निर्भर करता है, जहां मुझे प्रबंधन से यह पुष्टि करने की उम्मीद है कि AI-संचालित कस्टम चिप मांग विरासत कमजोरी को ऑफसेट कर रही है। प्राथमिक जोखिम हाइपरस्केलर capex में संकुचन है, जो विकास कथा को तोड़ देगा। हम वर्तमान में 25.69 का मूल्य-से-बिक्री अनुपात देख रहे हैं। यह मीट्रिक का मतलब है कि निवेशक बिक्री के प्रत्येक डॉलर के लिए 25 डॉलर से अधिक का भुगतान कर रहे हैं, एक महंगा दांव जो निराशा के लिए कोई जगह नहीं छोड़ता है। मैं अपनी स्थिति बनाए रख रहा हूं क्योंकि वर्तमान 36.2% शुद्ध मार्जिन दीर्घकालिक अस्तित्व के लिए एक ठोस आधार प्रदान करता है।
C Chatgpt 3M लक्ष्य $198.00 6M लक्ष्य $215.00 तर्क मुझे लगता है कि ब्रॉडकॉम निकट अवधि में उच्च स्तर पर जा सकता है यदि AI इंफ्रास्ट्रक्चर की मांग बरकरार रहती है, लेकिन ऊपर की ओर एक ऊंचे मूल्यांकन से सीमित है। उत्प्रेरक: आगामी आय प्रिंट, AI राजस्व में तेजी जारी रहने और मेटा द्वारा साझेदारी का विस्तार करने से विकास प्रक्षेपवक्र मान्य होगा। जोखिम: हाइपरस्केल capex में अचानक मंदी या नियामक बाधाएं गुणकों को संपीड़ित कर सकती हैं और पुलबैक को बढ़ा सकती हैं। मीट्रिक: P/E लगभग 71। इसका मतलब है कि निवेशक निर्दोष AI-संचालित विकास के वर्षों के लिए भुगतान कर रहे हैं, जो मांग ठंडी होने पर थोड़ा कुशन छोड़ता है।

ताज़ा समाचार इस कंपनी का उल्लेख करने वाली हालिया सुर्खियां

ट्रेडिंग सिग्नल प्रवेश मूल्य और जोखिम/इनाम अनुपात के साथ हालिया खरीद/बिक्री संकेत

मेरे मेट्रिक्स आपकी व्यक्तिगत वॉचलिस्ट — पूर्ण फंडामेंटल से चयनित पंक्तियाँ

📊

उन मेट्रिक्स को चुनें जो आपके लिए मायने रखते हैं — ऊपर पूर्ण फंडामेंटल में किसी भी पंक्ति के बगल में ➕ पर क्लिक करें।

आपका चयन सहेजा गया है और यह सभी टिकर में आपके साथ रहता है।

संस्थागत मालिक (13F) 5306 फाइलर्स · $1.0T कुल · तिथि अनुसार 30 जून 2026

संस्थान जो अपनी तिमाही SEC फॉर्म 13F में इस स्टॉक को होल्ड करने की रिपोर्ट करते हैं। केवल लॉन्ग पोजीशन; एक ही फाइलर अलग-अलग ऑप्शन लेग्स के लिए दो बार दिखाई दे सकता है। बड़े ऑफसेटिंग पुट/कॉल लेग्स आमतौर पर मार्केट-मेकिंग या हेज्ड इन्वेंट्री को दर्शाते हैं, न कि दिशात्मक विश्वास को।

संस्थागत गतिविधि — Q2 2026 बनाम पिछली तिमाही
नई स्थितियाँ बाहर निकली पोजीशन बढ़ाया घटा हुआ शुद्ध शेयर परिवर्तन
334 (-18 पिछली तिमाही की तुलना में) 129 (-84 पिछली तिमाही की तुलना में) 2269 (-52 पिछली तिमाही की तुलना में) 1875 (+107 पिछली तिमाही की तुलना में) +101.6M

Q1 2026 की तुलना में। SEC फॉर्म 13F फाइलिंग तिमाही के अंत के 45 दिनों के भीतर देय होती है, साथ ही देर से फाइल करने वालों के लिए एक छोटा बफर भी होता है — उस विंडो के भीतर आने वाली तिमाहियों को सबसे हालिया पूरी तरह से रिपोर्ट की गई जोड़ी के पक्ष में छोड़ दिया जाता है।

संस्था मूल्य शेयर % ट्रैक किए गए 13F का प्रकार
VANGUARD GROUP INC $150850247524 435857404 14.63% शेयर
VANGUARD CAPITAL MANAGEMENT LLC $116788431850 309168582 11.33% शेयर
STATE STREET CORP $74379179363 196900541 7.21% शेयर
VANGUARD PORTFOLIO MANAGEMENT LLC $47974821538 127001513 4.65% शेयर
Capital World Investors $46043125039 121892859 4.47% शेयर
Capital Research Global Investors $42731528140 113126312 4.14% शेयर
FMR LLC $38412476485 101687562 3.73% शेयर
GEODE CAPITAL MANAGEMENT, LLC $38180325521 101353643 3.70% शेयर
Capital International Investors $30902247270 81822766 3.00% शेयर
NORGES BANK $24920540717 65970988 2.42% शेयर
WELLINGTON MANAGEMENT GROUP LLP $17730328604 46936674 1.72% शेयर
CHARLES SCHWAB INVESTMENT MANAGEMENT INC $12594394510 33342564 1.22% शेयर
VANGUARD FIDUCIARY TRUST CO $10270285510 27188049 1.00% शेयर
JANE STREET GROUP, LLC $8456953675 22387700 0.82% पुट ऑप्शन
JENNISON ASSOCIATES LLC $7900592854 20914872 0.77% शेयर
AMERIPRISE FINANCIAL INC $7275763576 19262745 0.71% शेयर
ALLIANCEBERNSTEIN L.P. $7124299013 23017993 0.69% शेयर
BANK OF AMERICA CORP /DE/ $6090832612 16123978 0.59% शेयर
Fisher Asset Management, LLC $5715990096 15131673 0.55% शेयर
UBS Group AG $5325903294 14099016 0.52% शेयर
JANUS HENDERSON GROUP PLC $5243125415 17025997 0.51% शेयर
CANADA PENSION PLAN INVESTMENT BOARD $4920177507 13024957 0.48% शेयर
JANE STREET GROUP, LLC $4863380150 12874600 0.47% कॉल ऑप्शन
Swiss National Bank $4792246048 12686290 0.46% शेयर
California Public Employees Retirement System $4715493292 12483106 0.46% शेयर
Mitsubishi UFJ Asset Management Co., Ltd. $4457582590 11800351 0.43% शेयर
VAN ECK ASSOCIATES CORP $4440057257 11753957 0.43% शेयर
BlackRock, Inc. $4355080883 11529003 0.42% शेयर
Sumitomo Mitsui Trust Group, Inc. $4227700561 11191795 0.41% शेयर
Legal & General Group Plc $4209831478 11144491 0.41% शेयर
RAYMOND JAMES FINANCIAL INC $4153273769 10994768 0.40% शेयर
DIMENSIONAL FUND ADVISORS LP $4123572227 10916139 0.40% शेयर
Vanguard Global Advisers, LLC $3858628613 10214768 0.37% शेयर
National Pension Service $3631259754 9612865 0.35% शेयर
BARCLAYS PLC $3532175559 9350564 0.34% शेयर
VANGUARD ASSET MANAGEMENT, Ltd $3400021980 9000720 0.33% शेयर
ARROWSTREET CAPITAL, LIMITED PARTNERSHIP $3246274708 8593712 0.31% शेयर
PRINCIPAL FINANCIAL GROUP INC $3204834025 8484008 0.31% शेयर
RHUMBLINE ADVISERS $3079406097 8151966 0.30% शेयर
ENVESTNET ASSET MANAGEMENT INC $2981830714 7893692 0.29% शेयर
AMERICAN CENTURY COMPANIES INC $2964476749 7847715 0.29% शेयर
MORGAN STANLEY $2848933838 7541850 0.28% शेयर
Clearbridge Investments, LLC $2786307268 7376062 0.27% शेयर
Pictet Asset Management Holding SA $2774229298 7345234 0.27% शेयर
GOLDMAN SACHS GROUP INC $2672116032 7073768 0.26% शेयर
LPL Financial LLC $2600284103 6883612 0.25% शेयर
UBS AM, a distinct business unit of UBS ASSET MANAGEMENT AMERICAS LLC $2438706358 7879249 0.24% शेयर
MANUFACTURERS LIFE INSURANCE COMPANY, THE $2434894020 6445882 0.24% शेयर
BNP PARIBAS FINANCIAL MARKETS $2395099699 6340436 0.23% शेयर
TD Asset Management Inc $2116030087 5601668 0.21% शेयर
CALIFORNIA STATE TEACHERS RETIREMENT SYSTEM $2109871173 6816811 0.20% शेयर
VICTORY CAPITAL MANAGEMENT INC $2098440527 5555094 0.20% शेयर
Sanders Capital, LLC $1950561233 5163630 0.19% शेयर
FIRST TRUST ADVISORS LP $1942190241 5141470 0.19% शेयर
NEW YORK STATE COMMON RETIREMENT FUND $1872291433 4956430 0.18% शेयर
CTC LLC $1838169275 48661 0.18% कॉल ऑप्शन
UBS Group AG $1789934755 4738411 0.17% कॉल ऑप्शन
AVIVA PLC $1770753744 4687634 0.17% शेयर
Robeco Institutional Asset Management B.V. $1708097123 4521766 0.17% शेयर
Rafferty Asset Management, LLC $1691038294 4476607 0.16% शेयर
CTC LLC $1689373550 44722 0.16% पुट ऑप्शन
NORDEA INVESTMENT MANAGEMENT AB $1654614756 4415603 0.16% शेयर
Ensign Peak Advisors, Inc $1631665816 4319433 0.16% शेयर
APG Asset Management N.V. $1628502288 4928833 0.16% शेयर
PeakShares LLC $1586550000 4200 0.15% शेयर
ADAGE CAPITAL PARTNERS GP, L.L.C. $1585286804 4196656 0.15% शेयर
DNB Asset Management AS $1561323855 4133220 0.15% शेयर
NEUBERGER BERMAN GROUP LLC $1512610248 4004299 0.15% शेयर
PRUDENTIAL FINANCIAL INC $1497337538 3963832 0.15% शेयर
STATE BOARD OF ADMINISTRATION OF FLORIDA RETIREMENT SYSTEM $1495846181 3959884 0.15% शेयर
Universal- Beteiligungs- und Servicegesellschaft mbH $1432718810 3786447 0.14% शेयर
ROYAL LONDON ASSET MANAGEMENT LTD $1421656462 3763485 0.14% शेयर
Temasek Holdings (Private) Ltd $1413077001 3740773 0.14% शेयर
JONES FINANCIAL COMPANIES LLLP $1386782180 3799195 0.13% शेयर
FIFTH THIRD BANCORP $1380567641 3654712 0.13% शेयर
MILLENNIUM MANAGEMENT LLC $1359673350 3599400 0.13% पुट ऑप्शन
PNC Financial Services Group, Inc. $1346525761 3564595 0.13% शेयर
Mirae Asset Global Investments Co., Ltd. $1338111380 3542320 0.13% शेयर
Mariner, LLC $1310885672 3470546 0.13% शेयर
HSBC HOLDINGS PLC $1257831321 3347700 0.12% पुट ऑप्शन
CITIGROUP INC $1249408125 3307500 0.12% पुट ऑप्शन
Grantham, Mayo, Van Otterloo & Co. LLC $1234125003 3267040 0.12% शेयर
Korea Investment CORP $1211452938 3207023 0.12% शेयर
Zurcher Kantonalbank (Zurich Cantonalbank) $1175841690 3112751 0.11% शेयर
Nuveen, LLC $1127655652 2985190 0.11% शेयर
Bank Julius Baer & Co. Ltd, Zurich $1124181359 2981790 0.11% शेयर
Quantinno Capital Management LP $1077138465 2851458 0.10% शेयर
Ninety One UK Ltd $1052117169 2785221 0.10% शेयर
MACKENZIE FINANCIAL CORP $1045427280 2767511 0.10% शेयर
PFA Pension, Forsikringsaktieselskab $1044269783 2764447 0.10% शेयर
FRED ALGER MANAGEMENT, LLC $1038273243 2748572 0.10% शेयर
ProShare Advisors LLC $1037777089 2747259 0.10% शेयर
GOLDMAN SACHS GROUP INC $1032050775 2732100 0.10% पुट ऑप्शन
BANK OF MONTREAL /CAN/ $1030941323 2729163 0.10% शेयर
WOLVERINE TRADING, LLC $1030753650 3143500 0.10% कॉल ऑप्शन
Situational Awareness Partners LP $1006247961 3251100 0.10% पुट ऑप्शन
Focus Partners Wealth $1004497313 2659162 0.10% शेयर
NOMURA ASSET MANAGEMENT INTERNATIONAL INC. $992484000 2627357 0.10% शेयर
LOS ANGELES CAPITAL MANAGEMENT LLC $975538247 2582497 0.09% शेयर
Alecta Tjanstepension Omsesidigt $972046824 2578100 0.09% शेयर

कंपनी के अंदरूनी सूत्र 14 इनसाइडर्स · 3 अधिकारी · 12 निदेशक

अंदरूनी भूमिका अंतिम गतिविधि शेयरों का स्वामित्व खरीद 12m बिक्री 12m नेट 12m
Hock E Tan President and CEO 18 दिसमबर 2025 S 595638 0 1 $-42382600
Amie Thuener O'Toole Chief Financial Officer 15 जून 2026 A 50151 0 0 $0
Mark David Brazeal Chief Legal & Corp Affairs Ofc 10 जुलाई 2026 S 194989 0 29 $-32363924
Gayla J Delly निदेशक 10 जुलाई 2026 G 30826 0 1 $-728368
Justine Lien निदेशक 29 जून 2026 S 17426 0 3 $-1167044
Henry Samueli निदेशक 24 जून 2026 G 29984040 0 54 $-752923930
Harry L. You निदेशक 11 जून 2026 P 38466 2 0 $698700
Kenneth Hao निदेशक 20 अप्रैल 2026 A 4806 0 0 $0
Check Kian Low निदेशक 4 अप्रैल 2018 A 2101 0 0 $0
Peter J Marks निदेशक 4 अप्रैल 2018 A 33012 0 0 $0
Donald Macleod निदेशक 4 अप्रैल 2018 A 54565 0 0 $0
James Diller निदेशक 4 अप्रैल 2018 A 24704 0 0 $0
Lewis C Eggebrecht निदेशक 4 अप्रैल 2018 A 6833 0 0 $0
Eddy W Hartenstein निदेशक 4 अप्रैल 2018 A 34948 0 0 $0

SEC फॉर्म 3/4/5 फाइलिंग से अंदरूनी सूत्र; नेट = केवल ओपन-मार्केट P/S

ईटीएफ स्वामित्व 424 ETFs द्वारा धारित

वजन केवल प्रत्यक्ष इक्विटी होल्डिंग्स (N-PORT) को दर्शाता है; लीवरेज्ड या डेरिवेटिव-आधारित फंड में अतिरिक्त स्वैप एक्सपोजर हो सकता है जो नहीं दिखाया गया है।

फंड भार इकाइयाँ तिथि अनुसार स्रोत
AVL · Direxion Shares ETF Trust 16.95% 76539 NS 30 अप्रैल 2026 N-PORT
TRFK · Pacer Funds Trust 10.33% 152031 NS 30 अप्रैल 2026 N-PORT
SEMI · Columbia ETF Trust I 10.30% 10461 NS 30 अप्रैल 2026 N-PORT
TDVI · First Trust Exchange-Traded Fund IV 9.50% 95109 NS 30 अप्रैल 2026 N-PORT
GRW · TCW ETF Trust 9.37% 16119 NS 30 अप्रैल 2026 N-PORT
JXX · Janus Detroit Street Trust 9.01% 7820 NS 30 अप्रैल 2026 N-PORT
SOXQ · Invesco Exchange-Traded Fund Trust … 8.94% 730978 SH 21 अगस्त 2026 दैनिक
IETC · iShares U.S. ETF Trust 8.03% 153332 SH 21 अगस्त 2026 दैनिक
GXPT · Global X Funds 7.97% 18082 NS 31 मई 2026 N-PORT
YALL · Tidal Trust I 7.84% 17012 NS 31 मई 2026 N-PORT
KNCT · Invesco Exchange-Traded Fund Trust 7.73% 34010 SH 21 अगस्त 2026 दैनिक
HFGO · Hartford Funds Exchange-Traded Trust 7.69% 33368 NS 30 अप्रैल 2026 N-PORT
NUGO · Nushares ETF Trust 7.64% 519839 NS 30 अप्रैल 2026 N-PORT
WINN · Harbor ETF Trust 7.58% 198083 NS 30 अप्रैल 2026 N-PORT
IGM · iShares Trust 7.58% 2181577 SH 21 अगस्त 2026 दैनिक
NULG · Nushares ETF Trust 7.56% 472092 NS 30 अप्रैल 2026 N-PORT
TEC · Harbor ETF Trust 7.48% 1210 NS 30 अप्रैल 2026 N-PORT
IWLG · New York Life Investments Active ET… 7.43% 56249 NS 30 अप्रैल 2026 N-PORT
GDIV · Harbor ETF Trust 7.37% 39831 NS 30 अप्रैल 2026 N-PORT
VYM · VANGUARD WHITEHALL FUNDS 7.29% 18569985 SH 19 अगस्त 2026 दैनिक
TDIV · First Trust Exchange-Traded Fund VI 7.24% 847239 NS 30 जून 2026 N-PORT
SOXX · iShares Trust 7.18% 8276208 SH 21 अगस्त 2026 दैनिक
SUPP · TCW ETF Trust 7.08% 2057 NS 30 अप्रैल 2026 N-PORT
CHPY · Tidal Trust II 6.98% 104139 NS 30 अप्रैल 2026 N-PORT
FEPI · ETF Opportunities Trust 6.83% 106674 NS 30 अप्रैल 2026 N-PORT
CHPX · Global X Funds 6.72% 38770 NS 31 मई 2026 N-PORT
CIBR · First Trust Exchange-Traded Fund II 6.72% 2460464 NS 30 जून 2026 N-PORT
FLCG · Federated Hermes ETF Trust 6.69% 85190 NS 31 मई 2026 N-PORT
FAI · First Trust Exchange-Traded Fund II 6.68% 17216 NS 30 जून 2026 N-PORT
AIFD · TCW ETF Trust 6.63% 17040 NS 30 अप्रैल 2026 N-PORT
GROZ · Zacks Trust 6.59% 13331 NS 31 मई 2026 N-PORT
ACGR · AMERICAN CENTURY ETF TRUST 6.52% 1664 NS 31 मई 2026 N-PORT
USXF · iShares Trust 6.48% 263255 SH 21 अगस्त 2026 दैनिक
JHAI · Janus Detroit Street Trust 6.35% 3124 NS 30 अप्रैल 2026 N-PORT
CGUS · Capital Group Core Equity ETF 6.33% 1534839 NS 31 मई 2026 N-PORT
SPMO · Invesco Exchange-Traded Fund Trust … 6.26% 3798215 SH 21 अगस्त 2026 दैनिक
BRIF · FIS Trust 6.24% 20604 NS 31 मई 2026 N-PORT
LCLG · Advisors Series Trust 6.14% 14888 NS 30 अप्रैल 2026 N-PORT
AGRW · ALLSPRING EXCHANGE-TRADED FUNDS TRU… 5.92% 15102 NS 30 अप्रैल 2026 N-PORT
SOXY · Tidal Trust II 5.92% 7065 NS 30 अप्रैल 2026 N-PORT
QUSA · Tidal Trust III 5.85% 2482 NS 30 अप्रैल 2026 N-PORT
TTXU · Direxion Shares ETF Trust 5.85% 529 NS 30 अप्रैल 2026 N-PORT
HLAL · Listed Funds Trust 5.83% 119850 NS 31 मई 2026 N-PORT
AIBU · Direxion Shares ETF Trust 5.83% 3785 NS 30 अप्रैल 2026 N-PORT
ESG · FlexShares Trust 5.78% 17763 NS 30 अप्रैल 2026 N-PORT
RILA · Spinnaker ETF Series 5.77% 5793 NS 30 अप्रैल 2026 N-PORT
PEXL · Pacer Funds Trust 5.74% 6286 NS 30 अप्रैल 2026 N-PORT
ESGG · FlexShares Trust 5.71% 14840 NS 30 अप्रैल 2026 N-PORT
FMAG · FIDELITY COVINGTON TRUST 5.70% 34559 NS 30 अप्रैल 2026 N-PORT
LCOW · Pacer Funds Trust 5.70% 3136 NS 30 अप्रैल 2026 N-PORT