
NTES NetEase, Inc. - American Depositary Shares, each representing 5 ordinary shares
NASDAQ · Media · SEC EDGAR पर देखें ↗ बंद अक्ट 2, 2026 10-K/10-Q अप्र 15, 2026NTES स्टॉक स्नैपशॉट मूल्य, बाजार पूंजीकरण, P/E, EPS, ROE, ऋण/इक्विटी, 52-सप्ताह की सीमा
NTES स्टॉक मूल्य चार्ट तकनीकी संकेतकों के साथ दैनिक OHLCV — पैन, ज़ूम और अपना दृश्य कस्टमाइज़ करें
बार ग्रैन्युलैरिटी चयनित अवधि के अनुसार अनुकूलित होती है — बार के लिए ओपन/हाई/लो/क्लोज देखने के लिए चार्ट पर होवर करें।
| एक्स-डेट | स्प्लिट | प्रकार |
|---|---|---|
| 2 अक्टूबर 2020 | 5-for-1 | फॉरवर्ड |
| 28 मार्च 2006 | 4-for-1 | फॉरवर्ड |
NetEase, Inc. - American Depositary Shares, each representing 5 ordinary shares के बारे में विकिपीडिया से कंपनी का अवलोकन
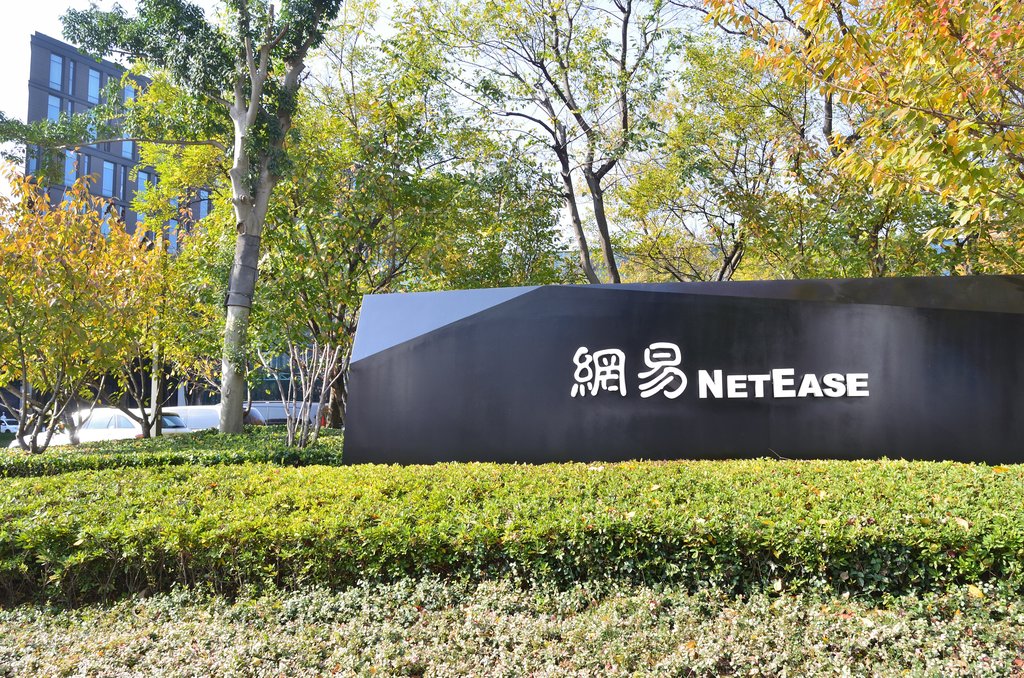
NetEase, Inc. (Chinese: 网易) is a Chinese Internet technology company. Its businesses include video games, news aggregation, music streaming, advertising, email, and e-commerce. It was founded by Ding Lei in June 1997.
The company provides online services with content, community, communications, and commerce. It operates a news aggregator website at news.163.com and an associated app. NetEase has an on-demand music-streaming service (NetEase Cloud Music). Video games the company has developed include, Fantasy Westward Journey, Identity V, Eggy Party, Sword of Justice(Justice online), Onmyoji, Tianxia III, Heroes of Tang Dynasty Zero, Ghost II, Marvel Rivals, and Destiny: Rising. NetEase operates the Chinese version of Blizzard Entertainment games, such as World of Warcraft, StarCraft II, and Overwatch. It also created an Android emulator for PC, called MuMu Player. The company also owns multiple pig farms. In 2023, the company revenue was US$14.6 billion.
History
Ding Lei founded the company in China in June 1997 with just three employees. It sold e-mail servers to internet access providers before developing its own websites that focused on bilingual e-mail and chat rooms, such as the popular 163 email domain. It introduced China's first free e-mail service, first online community, and first personalized information service. After two funding rounds, the company raised nearly $20 million by the end of 1999.
In 1999, NetEase hosted an online literature contest refereed by Wang Meng, Liu Xinwu, and Mo Yan, which contributed to the early growth of internet literature in China.
On July 1, 2000, the company was floated on the American stock market with an initial public offering on Nasdaq. 4.5 million shares were issued at $15.5 per share. The IPO was underwritten by Merrill. During this time, China had made it difficult for Chinese internet companies to reach the Western market. Western investors also remained hesitant to invest in Chinese tech companies. This caused the IPO to be delayed several months and the stock initially underperformed.
Several top executives left the company in June 2001 when it was discovered its sales data may have been misreported. This took place while NetEase was in the midst of buy-out talks with i-Cable Communications. Takeover talks ended soon after. By 2003, Netease had received investments from Softbank, ING Baring, Goldman Sachs, Techpacific.com, and News Corporation. It had 1.7 million registered users on its email service and generated over four million page views each day. It hired 200 people in Beijing, Guangzhou, and Shanghai.
In August 2005, NetEase announced it would shut down its MP3 service due to the proliferation of pirating. Its blog service was launched in September 2006. In December 2007, the company officially launched its own search engine, Youdao, to replace its partnership with Google since 2000. It went on to develop a series of applications under the brand, including a shopping assistant, Youdao dictionary, and more. NetEase was China's second most popular Google search term that year, behind rival Sina. NetEase's official website address is 163.com. It was attributed to the past when Chinese internet users had to dial "163" to access the Internet, before the availability of broadband.
In January 2011, the company announced the launch of a new online luxury goods shopping platform, L.163.com. Said platform was later shut down in December of that year. NetEase launched Lofter, an online forum for various internet subcultures, in August 2011. It has gone on to be one of the most popular platforms for fan fiction in China. In 2018, NetEase Blog was shut down, with users instructed to transfer their content to Lofter. In March 2012, the official name of the company was changed from NetEase.com, Inc to NetEase, Inc. In April, the company began testing a restaurant recommendation mobile app called "Fan Fan". In October 2013, Coursera announced a partnership with NetEase to launch Coursera Zone, a Chinese-language web portal. NetEase launched an online course platform with educational content in 2014.
Tencent sued NetEase alleging copyright infringement in 2014. It used the leverage from the suit to convince the company to sublicense music rights. The resulting sublicensing arrangement became a model used by other online music platforms in China. In 2015, the company launched Yanxuan, an e-commerce platform. In January 2015, NetEase announced the launch of Kaola.com, a cross-border e-commerce platform that focused on selling goods from overseas merchants, to compete directly with Alibaba and JD.com. By 2016, its shares had increased by 200% over the previous three years. By 2017, NetEase was the largest provider of free e-mail services in China, with over 940 million users since 2017. The company also ran 188.com and 126.com. In 2019, the company sold off Kaola.com to Alibaba for $2 billion.
NetEase carried out a secondary listings on the Hong Kong Exchanges and Clearing in June 2020. In August 2020, NetEase announced a capital and business alliance with anime studio Satelight. In November 2022, the company announced it had invested in Norwegian fitness startup PlayPulse. In March 2023, NetEase launched the Anici anime brand, making a variety of animation for various partners.
NetEase Games
In 2001, the company formed NetEase Games to focus on gaming. In December, the company launched its proprietary MMORPG Westward Journey Online . It reached 22 million users, with an average of over 400,000 concurrent players, by 2006. In 2008, it started a partnership with Blizzard Entertainment to publish the studio's games in China.
In 2013, the company licensed Hearthstone, Blizzard's free-to-play online strategy card game. In an effort to bring its games to English speaking audiences, NetEase opened its first U.S. office, in the San Francisco Bay Area, in February 2015. In March, a mobile version of Fantasy Westward Journey was released. Within two hours, it reached the number one spot on the top free games chart. The game hit 60 million registered users, with a concurrent user peak of over two million in the first year. It also licensed Cookie Jam and F1 Race Stars. In May, NetEase announced an investment in Helsinki-based developer Reforged Studios. In June, the company also announced a licensing agreement with Blizzard to publish the video game Overwatch.
By 2016, the company had a portfolio of over ninety mobile games, with forty one more in development. In May 2016, NetEase announced a new partnership with Microsoft and Mojang Studios to bring Minecraft to Asia. Free to play versions for PC, iOS, and Android launched in August, September, and October of the following year. In October 2017, the game had nearly 30 million players. By May 2018, NetEase had over 100 million users. Since 2018, NetEase announced a new partnership with Konami to bring the mobile version of Pro Evolution Soccer series (later replaced by eFootball since 2022) to China.
The company partnered with Mattel in January 2018 to launch a new game developer named Mattel163. It invested US$100 million in Bungie for a minority stake in the company and a seat on the board of directors in June 2018. NetEase took over publishing duties of EVE Online in China, starting in August 2018. That November, Blizzard announced Diablo Immortal, a mobile RPG that would be co-developed by NetEase. The game was also confirmed for PC and released in June 2022. It did not release in China until the following month.
Former Capcom employee Ryosuke Yoshida opened Ouka Studios in June 2020. In August, NetEase teamed with CCP Games to release EVE Echoes, a mobile version of EVE Online. NetEase, The Pokémon Company, and Game Freak, made an expanded version of Pokémon Quest called Pokémon Adventure, released in China on 13 May 2021. It contains regular updates and events unlike other versions. It invested in Japanese developer Grounding Inc. in September 2021. NetEase acquired Grasshopper Manufacture from GungHo Online Entertainment in October 2021. When indie publisher Devolver Digital went public on the London Stock Exchange in November 2021, NetEase purchased an 8% stake in the company. Toshihiro Nagoshi, Daisuke Sato, and several former Sega employees established Nagoshi Studio in January 2022.
After a 14-year partnership, Blizzard Activision ended its licensing agreement with NetEase in November 2022. As a result, World of Warcraft, Hearthstone, Warcraft III: Reforged, Overwatch, StarCraft, Diablo III, and Heroes of the Storm were shut down in China on January 23, 2023. It took a year and a half before a new agreement could be reached in April 2024. The two companies also agreed to distribute NetEase titles on Xbox platforms.
In November 2022, it acquired a stake in Liquid Swords, founded by Just Cause game director Christofer Sundberg in 2020. In May 2022, Jack Emmert founded Jackalope Games in Austin, Texas. It was rebranded as Jackalyptic Games on May 18, 2023, and entered into a partnership with Games Workshop. In July 2022, NetEase teamed with former Halo Studios employee Jerry Hook to establish Jar Of Sparks and also invested in Polish VR studio Something Random. It acquired Quantic Dream in August, following a 2019 minority investment. Something Wicked Games founder Jeff Gardiner also announced that NetEase had invested $13.2 million for the studio. Former Capcom producer Hiroyuki Kobayashi, established GPTRACK50 in October 2022. In November 2022, NetEase made a strategic investment in Rebel Wolves, founded by former CD Projekt employee Konrad Tomaszkiewicz. Riot Games sued NetEase over alleged copyright violation concerning Valorant in 2022.
NetEase acquired the studio SkyBox Labs in January 2023. In February, NetEase opened the studio Spliced. Former Marvelous vice president Toshinori Aoki and BlazBlue game creator Toshimichi Mori opened Studio Flare, with funding from NetEase. It launched Anchor Point Studios in April, under Control game designer Paul Ehreth. Former Ubisoft employee Sean Crooks opened Bad Brain Game Studios and Dragon Quest producer Ryutaro Ichimura established PinCool in May 2023. In August, NetEase established T-Minus Zero Entertainment, founded by Bethesda and BioWare veterans. Former Blizzard employee Greg Street established Fantastic Pixel Castle in November 2023. Mac Walters also established Worlds Untold. David Vonderhaar opened BulletFarm in February 2024.
In March, NetEase and Marvel Games announced Marvel Rivals, a team-based PVP shooter featuring characters from Marvel Comics. The game was released in December 2024 on Windows platforms, PlayStation 5, and Xbox Series X and Series S. It saw 10 million registered users within the first three days and reached 40 million players by February 2025, proving to be a major success for the publisher. In October 2024, it was announced that NetEase was developing and publishing Destiny: Rising, a free-to-play RPG shooter on mobile, in partnership with Bungie. It was released in August 2025.
Since 2024, NetEase has been looking to divest foreign investments due to changes in the video game industry. In order to create a smaller and tighter portfolio to better compete with the likes of Tencent and MiHoYo's Genshin Impact, funding to over a dozen studios were cut. Many studios were shut down, a majority of them having been acquired only five years prior. Ouka Studios was shut down in August 2024, following the release of Visions of Mana. Worlds Untold paused its operation in November 2024.
Jar of Sparks was shut down in January 2025. NetEase shut down T-Minus Zero in August before selling it in September. It shut down Fantastic Pixel Castle and Bad Brain Game Studios in November. NetEase also ended its partnership with Jackalyptic Games, which had been working on an unannounced MMO based on the Warhammer table top wargame. PinCool's debut game Pritto Prisoner was published by Initiate Games in December 2025.
Although NetEase published the 2024 remaster of Shadows of the Damned and is the copyright holder for Romeo Is a Dead Man, Grasshopper Manufacture entered negotiations with multiple publishers before settling on self-publishing its latest title, while GPTRACK50 partnered with SEGA to publish the game, Stupid Never Dies. A NetEase spokesman confirmed that Nagoshi Studio would no longer receive funding starting May 2026 and Gang of Dragon would still require an additional $44 million to be completed. Liquid Swords has produced the game Samson: A Tyndalston Story.
In 2026, Mattel acquired full ownership of Mattel163 from NetEase for $159 million.
Music streaming
In April 2013, NetEase launched a music streaming service called NetEase Cloud Music. In 2017, it received enough funding to be valued at over $1 billion, receiving unicorn status. In December 2017, NetEase signed a licensing agreement with Kobalt Music Group, gaining access to over 600,000 songs in its catalog.
While rival Tencent held licensing deals with the big three record labels, NetEase focused on independent artists. By 2018, over 70,000 independent artists had uploaded over 1.2 million songs to the platform. In November 2018, NetEase signed a non-exclusive partnership with indie label Merlin Network. in September 2019, Alibaba announced it had invested $700 million to gain a minority stake in NetEase Cloud Music. The service surpassed 800 million registered users by the end of 2019 a 200 million increase from the year before.
In 2020, NetEase entered into licensing agreements with Warner Chappell Music and Universal Music Group, giving users access to the publishers' catalog. In May 2021, NetEase entered into a direct digital distribution relationship with Sony Music Entertainment. NetEase spun off its music streaming business as a separate company in August, listing it on the Hong Kong Stock Exchange.
NetEase Comics
In 2015, the company launched NetEase Comics to focus on the comic book business. In 2017, NetEase signed a collaboration deal with Marvel Comics to publish comics in China and create Chinese superheroes, including Swordmaster and Aero. By 2018, its online platform had published more than 2,000 comic book series and 40 million registered users. However, at the end of the year, NetEase sold its comics business to Bilibili while retaining the copyright to its Marvel series.
Chinese government regulation
In October 2020, the Cyberspace Administration of China ordered NetEase to undergo "rectification" and temporarily suspend certain comment functions, after censors found inappropriate comments on the news app.
Game studios under NetEase
Studios under Thunder Fire Studio
Former studios
Strategic investments
Games developed and published by NetEase Games
Licensed online games
Three-year agreement to license Overwatch in PRC
Agreement to license Minecraft and the pocket edition in China
Operated the Chinese third-party Minecraft Hypixel server, which was shut down on 30 June 2020
Assumed the publishing of Eve Online in the Chinese market in October 2018
Game technology
NetEase develops two in-house game engines for some video games: Messiah Engine and NeoX.
Pig farming
In 2009, NetEase founder Ding Lei announced his intention to modernize pig farming in China. The company's agricultural affiliate Weiyang set up a pig farm in Anji county, Huzhou, Zhejiang province in 2011. The state of the art facility included tracking sensors, data analysis, soothing music, artificial intelligence, and Wi-Fi. The public could also track the pigs online.
In November 2016, the company held an online auction that sold three of its Jeju Black pigs for a total of $75,000. Since the meat has gone to market, NetEase has sold it on the company's Yanxuan e-commerce platform. Meituan Dianping, Sinovation Ventures, and JD.com invested in the endeavor in 2017. By 2018, the facility was overseeing the rearing and slaughter of 20,000 organic free-range hogs each year.
In October 2017, the company announced that it had established a second farm in Gao'an, Jiangxi. NetEase announced in September 2019 that it would invest 1.5 billion yuan ($211 million) to build a pig farm in Shaoxing.
स्रोत: विकिपीडिया (अंग्रेज़ी), CC BY-SA 4.0 · विकिपीडिया पर देखें ↗
10-वर्षीय प्रदर्शन राजस्व, शुद्ध आय, मार्जिन और ईपीएस रुझान
मूल्यांकन P/E, P/S, P/B, EV/EBITDA अनुपात — क्या स्टॉक महंगा है या सस्ता?
| मेट्रिक | 5Y रुझान | NTES | 5Y औसत | सहकर्मी माध्यिका | निर्णय |
|---|---|---|---|---|---|
| P/E | 11.25Y औसत ≈13.0 | ≈13.0 | · | · | |
| P/S | 3.35Y औसत ≈3.1 | ≈3.1 | · | · | |
| P/B | 2.35Y औसत ≈2.6 | ≈2.6 | · | · | |
| Price / FCF (मूल्य / FCF) | 7.55Y औसत ≈9.7 | ≈9.7 | · | · | |
| Price / Cash Flow (मूल्य / नकदी प्रवाह) | 7.45Y औसत ≈9.2 | ≈9.2 | · | · | |
| Price / Tangible Book (मूल्य / मूर्त पुस्तक) | 2.45Y औसत ≈2.6 | ≈2.6 | · | · |
सहकर्मी माध्यिका को प्रति मीट्रिक मानकीकृत आधार पर गणना की जाती है और यह हमेशा इस स्टॉक के लिए दिखाए गए TTM/MRQ आधार से मेल नहीं खा सकती है।
लाभप्रदता सकल, परिचालन और शुद्ध मार्जिन; ROE, ROA, ROIC
| मेट्रिक | 5Y रुझान | NTES | 5Y औसत | सहकर्मी माध्यिका | निर्णय |
|---|---|---|---|---|---|
| Gross Margin (सकल मार्जिन) | 64.3%5Y औसत ≈59.2% | ≈59.2% | · | · | |
| Operating Margin (परिचालन मार्जिन) | 31.8%5Y औसत ≈25.2% | ≈25.2% | · | · | |
| EBITDA Margin (EBITDA मार्जिन) | 33.8%5Y औसत ≈27.9% | ≈27.9% | · | · | |
| Pretax Margin (प्रीटैक्स मार्जिन) | 36.2%5Y औसत ≈30.5% | ≈30.5% | · | · | |
| Net Profit Margin (शुद्ध लाभ मार्जिन) | 30.9%5Y औसत ≈25.6% | ≈25.6% | · | · | |
| ROA | 16.7%5Y औसत ≈14.5% | ≈14.5% | · | · | |
| ROE | 23.3%5Y औसत ≈22.2% | ≈22.2% | · | · | |
| ROIC | 19.1%5Y औसत ≈16.8% | ≈16.8% | · | · |
वित्तीय स्वास्थ्य ऋण, तरलता, शोधन क्षमता — बैलेंस शीट की मजबूती
| मेट्रिक | 5Y रुझान | NTES | 5Y औसत | सहकर्मी माध्यिका | निर्णय |
|---|---|---|---|---|---|
| Current Ratio (वर्तमान अनुपात) | 3.45Y औसत ≈2.7 | ≈2.7 | · | · | |
| Quick Ratio (त्वरित अनुपात) | 1.45Y औसत ≈0.9 | ≈0.9 | · | · |
विकास राजस्व, EPS और शुद्ध आय वृद्धि: YoY, 3Y CAGR, 5Y CAGR
इस टिकर के लिए अभी तक कोई फंडामेंटल डेटा नहीं है।
पूंजी दक्षता एसेट टर्नओवर, इन्वेंटरी टर्नओवर, प्राप्य टर्नओवर
| मेट्रिक | 5Y रुझान | NTES | 5Y औसत | सहकर्मी माध्यिका | निर्णय |
|---|---|---|---|---|---|
| Asset Turnover (परिसंपत्ति टर्नओवर) | 0.55Y औसत ≈0.6 | ≈0.6 | · | · | |
| Inventory Turnover (इन्वेंटरी टर्नओवर) | 63.85Y औसत ≈54.2 | ≈54.2 | · | · | |
| Receivables Turnover (प्राप्य टर्नओवर) | 20.55Y औसत ≈18.3 | ≈18.3 | · | · | |
| Revenue / Employee (राजस्व / कर्मचारी (रिपोर्ट की गई हेडकाउंट, यफाइनांस)। व्युत्पन्न — संग्रहीत SEC-XBRL अवधारणा नहीं है।) | ≈$4.4M | · | · | · |
मान · ≈ 5Y औसत · उद्योग माध्य · माध्य के सापेक्ष निर्णय
लाभांश यील्ड, भुगतान अनुपात, लाभांश इतिहास, 5Y CAGR
| एक्स-डेट | राशि | मुद्रा | यील्ड |
|---|---|---|---|
| सित 3, 2026 | $0.48 | USD | ≈2.5% |
| जून 5, 2026 | $0.72 | USD | ≈2.5% |
| मा 16, 2026 | $1.16 | USD | ≈2.5% |
| दिस् 5, 2025 | $0.57 | USD | ≈2.2% |
| अग 28, 2025 | $0.57 | USD | ≈2.1% |
| मई 30, 2025 | $0.68 | USD | ≈2.3% |
| मा 6, 2025 | $1.22 | USD | ≈3.6% |
| नव 29, 2024 | $0.44 | USD | ≈2.8% |
| सित 6, 2024 | $0.44 | USD | ≈3.2% |
| जून 6, 2024 | $0.50 | USD | ≈2.8% |
| मा 13, 2024 | $1.08 | USD | ≈2.3% |
| नव 30, 2023 | $0.50 | USD | ≈1.5% |
| सित 7, 2023 | $0.53 | USD | ≈1.7% |
| जून 8, 2023 | $0.47 | USD | ≈1.7% |
| मा 8, 2023 | $0.27 | USD | ≈1.7% |
| दिस् 1, 2022 | $0.44 | USD | ≈2.2% |
| अग 31, 2022 | $0.36 | USD | ≈1.5% |
| जून 7, 2022 | $0.32 | USD | ≈1.2% |
| मा 10, 2022 | $0.41 | USD | ≈1.5% |
| नव 30, 2021 | $0.23 | USD | ≈0.77% |
Earnings History EPS वास्तविक बनाम अनुमान, आश्चर्य %, बीट दर, अगली आय तिथि
| Period | रिपोर्ट | EPS Actual | EPS अनुमान | आश्चर्य |
|---|---|---|---|---|
| 30 जून 2026 | अग 20, 2026 | $12.02 | $15.51 | -22.5% |
| 31 मार्च 2026 | मई 21, 2026 | $17.46 | $15.45 | 13.0% |
| 31 दिसमबर 2025 | $10.95 | $14.48 | -24.4% | |
| 30 सितमबर 2025 | $14.73 | $15.07 | -2.3% | |
| 30 जून 2025 | $14.81 | $15.22 | -2.7% | |
| 31 मार्च 2025 | $17.51 | $14.26 | 22.8% |
पूर्ण मौलिक सभी मेट्रिक्स प्रति वर्ष — आय विवरण, बैलेंस शीट, नकदी प्रवाह
आय विवरण
| मेट्रिक | रुझान | 2025 | 2024 | 2023 | 2022 | 2021 | 2020 | 2019 | 2018 | 2017 | 2016 | 2015 | 2014 |
|---|---|---|---|---|---|---|---|---|---|---|---|---|---|
| Revenue | $112.63B | $105.30B | $103.47B | $96.50B | $87.61B | $73.67B | $59.24B | $51.18B | $44.44B | $38.18B | $22.80B | $11.71B | |
| Cost of Revenue | $40.22B | $39.49B | $40.40B | $43.73B | $40.64B | $34.68B | $27.69B | $23.83B | $19.39B | $16.52B | $9.40B | $3.26B | |
| Gross Profit | $72.40B | $65.81B | $63.06B | $52.77B | $46.97B | $38.98B | $31.56B | $27.35B | $25.04B | $21.66B | $13.40B | $8.45B | |
| R&D Expense | $17.72B | $17.52B | $16.48B | $15.04B | $14.08B | $10.37B | $8.41B | $7.38B | $4.16B | $3.05B | $2.16B | $1.32B | |
| SG&A Expense | $4.23B | $4.55B | $4.90B | $4.70B | $4.26B | $3.37B | $3.13B | $3.08B | $2.38B | $1.51B | $1.01B | $468M | |
| Operating Expenses | $36.57B | $36.22B | $35.35B | $33.14B | $30.55B | $24.44B | $17.76B | $17.37B | $12.05B | $9.03B | $6.13B | $3.69B | |
| Operating Income | $35.83B | $29.58B | $27.71B | $19.63B | $16.42B | $14.54B | $13.79B | $9.98B | $12.99B | $12.63B | $7.27B | $4.77B | |
| Other Non-op | $1.09B | $602M | $1.05B | $847M | $710M | $737M | $439M | $587M | $272M | $378M | $45M | $82M | |
| Pretax Income | $40.83B | $35.72B | $34.06B | $24.25B | $21.10B | $15.37B | $16.38B | $11.08B | $13.84B | $13.90B | $8.11B | $5.46B | |
| Income Tax | $6.03B | $5.46B | $4.70B | $5.03B | $4.13B | $3.04B | $2.91B | $2.46B | $2.16B | $2.10B | $1.27B | $663M | |
| Net Income | $34.80B | $30.26B | $29.36B | $19.84B | $16.98B | $12.33B | $21.43B | $6.48B | $10.85B | $11.79B | $6.84B | $4.76B | |
| EPS (Basic) | $10.59 | $9.28 | $9.15 | $6.23 | $5.07 | $3.65 | $6.59 | $1.90 | $3.25 | $3.54 | $2.05 | $1.46 | |
| EPS (Diluted) | $10.48 | $9.19 | $9.05 | $6.17 | $5.01 | $3.60 | $6.53 | $1.89 | $3.23 | $3.51 | $2.04 | $1.45 | |
| Shares (Basic) | 3,186,454,000 | 3,200,453,000 | 3,216,475,000 | 3,263,455,000 | 3,325,864,000 | 3,305,448,000 | 3,220,473,000 | 3,235,324,000 | 3,290,312,000 | 3,281,729,000 | 3,284,382,000 | 3,264,450,000 | |
| Shares (Diluted) | 3,218,174,000 | 3,230,602,000 | 3,252,029,000 | 3,296,014,000 | 3,367,478,000 | 3,349,759,000 | 3,249,972,000 | 3,254,689,000 | 3,315,478,000 | 3,307,109,000 | 3,305,213,000 | 3,277,049,000 | |
| EBITDA | $38.08B | $32.00B | $30.76B | $22.49B | $19.69B | $18.00B | $16.40B | $9.98B | $12.96B | $12.96B | $7.45B | $4.94B |
बैलेंस शीट
| मेट्रिक | रुझान | 2025 | 2024 | 2023 | 2022 | 2021 | 2020 | 2019 | 2018 | 2017 | 2016 | 2015 | 2014 |
|---|---|---|---|---|---|---|---|---|---|---|---|---|---|
| Cash & Equivalents | $47.17B | $51.38B | $21.43B | $24.89B | $14.50B | $9.12B | $3.25B | $4.98B | $2.76B | $5.44B | $6.07B | $2.02B | |
| Short-term Investments | $22.80B | $10.76B | $4.44B | $7.62B | $12.28B | $13.27B | $15.31B | $11.67B | $9.74B | $11.58B | $5.01B | $2.06B | |
| Receivables | $5.34B | $5.67B | $6.42B | $5.00B | $5.51B | $4.58B | $4.17B | $4.00B | $3.62B | $4.25B | $2.61B | $873M | |
| Inventory | $689M | $572M | $695M | $994M | $965M | $592M | $651M | $1.07B | $5.47B | $1.58B | $818M | $28M | |
| Prepaid Expense | $7.66B | $6.42B | $6.08B | $5.45B | $6.24B | $6.08B | $4.82B | $3.93B | $3.82B | $3.70B | $2.70B | $1.42B | |
| Other Current Assets | $198M | $144M | $132M | $155M | $126M | $100M | $118M | $91M | $233M | $87M | $120M | $45M | |
| Current Assets | $180.62B | $153.32B | $142.69B | $131.60B | $113.12B | $107.83B | $85.11B | $68.72B | $61.95B | $49.38B | $34.41B | $27.73B | |
| PP&E (Net) | $8.43B | $8.52B | $8.08B | $6.34B | $5.43B | $4.55B | $4.62B | $4.67B | $3.77B | $2.42B | $2.09B | $1.28B | |
| PP&E (Gross) | $16.14B | $15.87B | $15.18B | $12.61B | $10.71B | $8.99B | $8.13B | $7.30B | $5.54B | $3.82B | $3.21B | $2.25B | |
| Accum. Depreciation | $7.68B | $7.18B | $6.92B | $6.27B | $5.28B | $4.44B | $3.51B | $2.63B | $1.78B | $1.40B | $1.12B | $968M | |
| Goodwill | $1.86B | $1.86B | $1.86B | $2.17B | $595M | $319M | · | · | · | · | · | · | |
| Other Non-current Assets | $3.71B | $5.08B | $5.94B | $6.81B | $4.01B | $5.11B | $5.67B | $2.93B | $1.11B | $500M | $318M | $192M | |
| Total Assets | $221.42B | $195.99B | $185.92B | $172.76B | $153.64B | $141.87B | $112.12B | $86.97B | $71.03B | $58.03B | $41.16B | $30.35B | |
| Accounts Payable | $643M | $721M | $881M | $1.51B | $985M | $1.13B | $1.21B | $1.20B | $2.44B | $1.40B | $701M | $411M | |
| Accrued Liabilities | $15.95B | $14.23B | $12.67B | $11.12B | $9.03B | $7.01B | $5.29B | $5.01B | $4.69B | $3.22B | $2.22B | $1.36B | |
| Current Liabilities | $52.37B | $49.67B | $53.84B | $56.83B | $50.50B | $46.74B | $38.24B | $35.11B | $23.75B | $19.18B | $11.67B | $6.76B | |
| Capital Leases | $232M | $413M | $556M | $673M | $732M | $475M | $280M | · | · | · | · | · | |
| Deferred Tax | $2.64B | $2.17B | $2.30B | $2.13B | $1.35B | $713M | $382M | · | · | $34M | $81M | · | |
| Other Non-current Liabilities | $1.07B | $816M | $715M | $605M | $366M | $149M | $177M | $49M | $18M | $200.0K | $85M | $106M | |
| Total Liabilities | $56.31B | $53.50B | $57.84B | $63.89B | $54.22B | $48.08B | $39.08B | $35.56B | $23.98B | $19.57B | $11.83B | $6.86B | |
| Total Debt | · | $428M | $428M | $3.65B | $1.28B | · | · | · | · | · | · | · | |
| Common Stock | $3M | $3M | $3M | $3M | $3M | $3M | $3M | $3M | $3M | $3M | $3M | $3M | |
| Retained Earnings | $149.75B | $130.33B | $112.21B | $91.07B | $77.49B | $64.16B | $56.39B | $44.00B | $42.73B | $35.33B | $26.42B | $21.22B | |
| Treasury Stock | $1.52B | $4.47B | $12.69B | $10.91B | $20.50B | $10.45B | · | · | · | · | · | · | |
| AOCI | $-238M | $1.01B | $617M | $432M | $-828M | $-650M | $-71M | $17M | $37M | $61M | $27M | · | |
| Stockholders' Equity | $160.30B | $138.69B | $124.29B | $104.73B | $95.33B | $82.13B | $61.45B | $45.23B | $45.73B | $38.19B | $29.24B | $23.39B | |
| Liabilities + Equity | $221.42B | $195.99B | $185.92B | $172.76B | $153.64B | $141.87B | $112.12B | $86.97B | $71.03B | $58.03B | $41.16B | $30.35B | |
| Shares Outstanding | 3,192,111,251 | 3,167,959,016 | 3,321,276,000 | 3,321,276,000 | 3,446,311,000 | 3,446,311,000 | 3,228,531,000 | 3,199,018,000 | 3,283,217,000 | 3,281,480,000 | 3,286,932,000 | 3,268,019,000 |
नकदी प्रवाह
| मेट्रिक | रुझान | 2025 | 2024 | 2023 | 2022 | 2021 | 2020 | 2019 | 2018 | 2017 | 2016 | 2015 | 2014 |
|---|---|---|---|---|---|---|---|---|---|---|---|---|---|
| D&A | $2.25B | $2.42B | $3.06B | $2.86B | $3.28B | $3.46B | $2.61B | $2.06B | $792M | $328M | $182M | $174M | |
| Stock-based Comp | $3.65B | $3.88B | $3.24B | $3.17B | $3.04B | $2.66B | $2.40B | $2.47B | $1.98B | $990M | $684M | $349M | |
| Deferred Tax | $-1.25B | $321M | $131M | $490M | $408M | $88M | $151M | $-71M | $-438M | $67M | $-147M | $-117M | |
| Other Non-cash | $11.30B | $2.80B | $-455M | $1.34B | $1.23B | $6.35B | $-9.38B | $2.40B | $-1.33B | $2.50B | $622M | $710M | |
| Operating Cash Flow | $50.74B | $39.68B | $35.33B | $27.71B | $24.93B | $24.89B | $17.22B | $13.42B | $11.89B | $15.49B | $8.08B | $5.87B | |
| CapEx | $1.07B | $1.28B | $2.30B | $2.10B | $1.60B | $1.06B | $1.21B | $2.17B | $1.65B | $1.14B | $866M | $537M | |
| Investing Cash Flow | $-33.18B | $17.92B | $-17.04B | $-7.37B | $-7.08B | $-29.19B | $-22.14B | $-13.57B | $-12.86B | $-11.86B | $-2.54B | · | |
| Stock Issued | · | · | · | · | · | $21.91B | · | · | · | · | · | · | |
| Stock Repurchased | · | · | · | · | · | · | · | $7.52B | $2.06B | $1.20B | $132M | · | |
| Net Stock Activity | · | · | · | · | · | $21.91B | · | $-7.52B | $-2.06B | $-1.20B | $-132M | · | |
| Dividends Paid | $13.83B | $11.17B | $8.01B | $6.72B | $3.51B | $4.28B | $8.84B | $1.44B | $3.26B | $2.55B | $1.47B | $1.98B | |
| Financing Cash Flow | $-20.16B | $-27.34B | $-21.47B | $-10.24B | $-12.59B | $9.91B | $1.08B | $1.59B | $-1.30B | $-2.25B | $-1.63B | · | |
| Net Change in Cash | $-2.98B | $30.27B | $-3.38B | $10.21B | $5.21B | $5.77B | $-3.81B | $1.52B | $-2.28B | $1.51B | $4.05B | $563M | |
| Taxes Paid | $6.43B | $5.19B | $4.90B | $5.09B | $3.55B | $2.05B | $3.19B | $2.00B | $2.71B | $1.10B | $1.12B | $551M | |
| Free Cash Flow | $49.67B | $38.40B | $33.03B | $25.61B | $23.32B | $23.83B | $16.01B | $10.89B | $10.05B | $14.35B | $7.21B | $5.34B |
लाभप्रदता
| मेट्रिक | रुझान | 2025 | 2024 | 2023 | 2022 | 2021 | 2020 | 2019 | 2018 | 2017 | 2016 | 2015 | 2014 |
|---|---|---|---|---|---|---|---|---|---|---|---|---|---|
| Gross Margin | 64.3% | 62.5% | 61.0% | 54.7% | 53.6% | 52.9% | 53.3% | 42.3% | 47.9% | 56.7% | · | 67.7% | |
| Operating Margin | 31.8% | 28.1% | 26.8% | 20.3% | 18.7% | 19.7% | 23.3% | 11.8% | 22.5% | 33.1% | · | 38.2% | |
| Net Margin | 30.9% | 28.7% | 28.4% | 20.6% | 19.4% | 16.7% | 36.2% | 9.7% | 20.1% | 30.4% | · | 38.1% | |
| Pretax Margin | 36.2% | 33.9% | 32.9% | 25.1% | 24.1% | 20.9% | 27.7% | 13.3% | 24.1% | 36.4% | · | 43.7% | |
| EBITDA Margin | 33.8% | 30.4% | 29.7% | 23.3% | 22.5% | 24.4% | 27.7% | 14.9% | 23.9% | 33.9% | · | 39.6% | |
| ROA | 16.7% | 15.8% | 16.4% | 12.2% | 11.5% | 9.7% | 21.5% | 8.2% | 16.8% | 23.4% | 18.8% | 17.3% | |
| ROE | 23.3% | 23.0% | 25.6% | 19.8% | 19.1% | 17.2% | 40.2% | 14.2% | 25.9% | 34.4% | 25.6% | 21.8% | |
| ROIC | 19.1% | 18.0% | 19.1% | 14.3% | 13.7% | 14.2% | 18.4% | 12.6% | 22.2% | 28.1% | 21.0% | 17.9% |
तरलता और शोधन क्षमता
| मेट्रिक | रुझान | 2025 | 2024 | 2023 | 2022 | 2021 | 2020 | 2019 | 2018 | 2017 | 2016 | 2015 | 2014 |
|---|---|---|---|---|---|---|---|---|---|---|---|---|---|
| Current Ratio | 3.4 | 3.1 | 2.7 | 2.3 | 2.2 | 2.3 | 2.2 | 2.0 | 2.6 | 2.6 | 2.9 | 4.1 | |
| Quick Ratio | 1.4 | 1.4 | 0.6 | 0.7 | 0.6 | 0.6 | 0.6 | 0.6 | 0.7 | 1.1 | 1.2 | 0.7 | |
| Debt / Equity | · | 0.0 | 0.0 | 0.0 | 0.0 | · | · | · | · | · | · | · | |
| LT Debt / Equity | · | 0.0 | 0.0 | 0.0 | 0.0 | · | · | · | · | · | · | · |
दक्षता
| मेट्रिक | रुझान | 2025 | 2024 | 2023 | 2022 | 2021 | 2020 | 2019 | 2018 | 2017 | 2016 | 2015 | 2014 |
|---|---|---|---|---|---|---|---|---|---|---|---|---|---|
| Asset Turnover | 0.5 | 0.6 | 0.6 | 0.6 | 0.6 | 0.6 | 0.6 | 0.9 | 0.8 | 0.8 | · | 0.5 | |
| Inventory Turnover | 63.8 | 62.3 | 47.8 | 44.7 | 52.2 | 54.5 | 32.3 | 7.4 | 8.0 | 13.8 | 22.2 | · | |
| Receivables Turnover | 20.5 | 17.4 | 18.1 | 18.4 | 17.4 | 16.8 | 14.5 | 17.0 | 13.7 | 11.1 | · | 19.6 |
प्रति शेयर
| मेट्रिक | रुझान | 2025 | 2024 | 2023 | 2022 | 2021 | 2020 | 2019 | 2018 | 2017 | 2016 | 2015 | 2014 |
|---|---|---|---|---|---|---|---|---|---|---|---|---|---|
| Book Value / Share | $50.22 | $43.78 | $38.71 | $32.49 | $29.12 | $24.52 | $19.03 | $14.14 | $13.93 | $11.64 | $8.90 | $7.16 | |
| Revenue / Share | $35.00 | $32.59 | $31.82 | $29.28 | $26.02 | $21.99 | $18.23 | $20.63 | $16.32 | $11.54 | · | $3.81 | |
| Cash Flow / Share | $15.77 | $12.28 | $10.86 | $8.41 | $7.40 | $7.43 | $5.30 | $4.12 | $3.59 | $4.68 | $2.44 | $1.79 | |
| Cash / Share | $14.78 | $16.22 | $6.67 | $7.72 | $4.43 | $2.72 | $1.01 | $1.68 | $0.84 | $1.66 | $1.85 | $0.62 | |
| EPS (TTM) | $10.48 | $9.19 | $9.05 | $6.17 | $5.01 | $3.60 | $6.53 | $1.89 | $3.23 | $3.51 | $2.04 | $1.45 |
मूल्यांकन (TTM)
| मेट्रिक | रुझान | 2025 | 2024 | 2023 | 2022 | 2021 | 2020 | 2019 | 2018 | 2017 | 2016 | 2015 | 2014 |
|---|---|---|---|---|---|---|---|---|---|---|---|---|---|
| Revenue TTM | $112.63B | $105.30B | $103.47B | $96.50B | $87.61B | $73.67B | $59.24B | $51.18B | $44.44B | $38.18B | $22.80B | $11.71B | |
| Net Income TTM | $34.80B | $30.26B | $29.36B | $19.84B | $16.98B | $12.33B | $21.43B | $6.48B | $10.85B | $11.79B | $6.84B | $4.76B | |
| Market Cap | $439.30B | $282.61B | $299.12B | $234.13B | $333.21B | $320.77B | $198.00B | $150.59B | $226.59B | $141.33B | $119.14B | $64.80B | |
| Enterprise Value | · | $220.90B | $273.68B | $205.28B | $307.71B | · | · | · | · | · | · | · | |
| P/E | 13.1 | 9.7 | 10.3 | 11.8 | 20.3 | 26.6 | 9.4 | 24.9 | 21.4 | 12.3 | 17.8 | 13.7 | |
| P/S | 3.9 | 2.7 | 2.9 | 2.4 | 3.8 | 4.4 | 3.3 | 2.9 | 5.1 | 3.7 | 5.2 | 5.5 | |
| P/B | 2.7 | 2.0 | 2.4 | 2.2 | 3.5 | 3.9 | 3.2 | 3.3 | 5.0 | 3.7 | 4.1 | 2.8 | |
| P / Tangible Book | 2.8 | 2.1 | 2.4 | 2.3 | 3.5 | 3.9 | · | · | · | · | · | · | |
| P / Cash Flow | 8.7 | 7.1 | 8.5 | 8.4 | 13.4 | 12.9 | 11.5 | 11.2 | 19.1 | 9.1 | 14.8 | 11.0 | |
| P / FCF | 8.8 | 7.4 | 9.1 | 9.1 | 14.3 | 13.5 | 12.4 | 13.8 | 22.6 | 9.8 | 16.5 | 12.1 | |
| EV / EBITDA | · | 6.9 | 8.9 | 9.1 | 15.6 | · | · | · | · | · | · | · | |
| EV / FCF | · | 5.8 | 8.3 | 8.0 | 13.2 | · | · | · | · | · | · | · | |
| EV / Revenue | · | 2.1 | 2.6 | 2.1 | 3.5 | · | · | · | · | · | · | · | |
| Dividend Yield | 3.1% | 4.0% | 2.7% | 2.9% | 1.1% | 1.3% | 4.5% | 0.96% | 1.4% | 1.8% | 1.2% | 3.1% | |
| Earnings Yield | 7.6% | 10.3% | 9.7% | 8.5% | 4.9% | 3.8% | 10.7% | 4.0% | 4.7% | 8.2% | 5.6% | 7.3% | |
| Payout Ratio | 39.7% | 36.9% | 27.3% | 33.9% | 20.7% | 34.7% | 41.2% | 22.2% | 30.0% | 21.9% | 21.8% | 41.7% | |
| Annual Payout | $13.83B | $11.17B | $8.01B | $6.72B | $3.51B | $4.28B | $8.84B | $1.44B | $3.26B | $2.55B | $1.47B | $1.98B |
प्रति शेयर
| मेट्रिक | रुझान | Q4 2009 | Q4 2008 | Q4 2007 | Q4 2006 | Q4 2005 | Q4 2004 | Q4 2003 | Q4 2002 | Q4 2001 |
|---|---|---|---|---|---|---|---|---|---|---|
| EPS (TTM) | $0.57 | $0.49 | · | · | · | · | · | · | · |
मूल्यांकन (TTM)
| मेट्रिक | रुझान | Q4 2009 | Q4 2008 | Q4 2007 | Q4 2006 | Q4 2005 | Q4 2004 | Q4 2003 | Q4 2002 | Q4 2001 |
|---|---|---|---|---|---|---|---|---|---|---|
| Revenue TTM | $3.82B | · | · | · | · | · | · | · | · | |
| Net Income TTM | $1.85B | $1.60B | · | · | · | · | · | · | · | |
| P/E | 13.2 | 9.0 | · | · | · | · | · | · | · | |
| Earnings Yield | 7.6% | 11.1% | · | · | · | · | · | · | · |
सबसे हाल की अवधि बाईं ओर · शून्य मान इस प्रकार दिखाए गए हैं ·
वित्तीय विवरण आय विवरण, बैलेंस शीट, नकदी प्रवाह — वार्षिक, पिछले 5 वर्ष
| मेट्रिक | 2025-12-31 | 2024-12-31 | 2023-12-31 | 2022-12-31 | 2021-12-31 |
|---|---|---|---|---|---|
| राजस्व | $112.63B | $105.30B | $103.47B | $96.50B | $87.61B |
| सकल मार्जिन % | 64.3% | 62.5% | 61.0% | 54.7% | 53.6% |
| परिचालन मार्जिन % | 31.8% | 28.1% | 26.8% | 20.3% | 18.7% |
| शुद्ध आय | $34.80B | $30.26B | $29.36B | $19.84B | $16.98B |
| तनुकरणित EPS | $10.48 | $9.19 | $9.05 | $6.17 | $5.01 |
| मेट्रिक | 2025-12-31 | 2024-12-31 | 2023-12-31 | 2022-12-31 | 2021-12-31 |
|---|---|---|---|---|---|
| ऋण / इक्विटी | · | 0.0 | 0.0 | 0.0 | 0.0 |
| वर्तमान अनुपात | 3.4 | 3.1 | 2.7 | 2.3 | 2.2 |
| त्वरित अनुपात | 1.4 | 1.4 | 0.6 | 0.7 | 0.6 |
| मेट्रिक | 2025-12-31 | 2024-12-31 | 2023-12-31 | 2022-12-31 | 2021-12-31 |
|---|---|---|---|---|---|
| फ्री कैश फ्लो | $49.67B | $38.40B | $33.03B | $25.61B | $23.32B |
संस्थागत मालिक (13F) 500 फाइलर्स · $7.3B कुल · तिथि अनुसार 30 जून 2026
संस्थान जो अपनी तिमाही SEC फॉर्म 13F में इस स्टॉक को होल्ड करने की रिपोर्ट करते हैं। केवल लॉन्ग पोजीशन; एक ही फाइलर अलग-अलग ऑप्शन लेग्स के लिए दो बार दिखाई दे सकता है। बड़े ऑफसेटिंग पुट/कॉल लेग्स आमतौर पर मार्केट-मेकिंग या हेज्ड इन्वेंट्री को दर्शाते हैं, न कि दिशात्मक विश्वास को।
| नई स्थितियाँ | बाहर निकली पोजीशन | बढ़ाया | घटा हुआ | शुद्ध शेयर परिवर्तन |
|---|---|---|---|---|
| 81 (+14 पिछली तिमाही की तुलना में) | 42 (-26 पिछली तिमाही की तुलना में) | 183 (+30 पिछली तिमाही की तुलना में) | 131 (-16 पिछली तिमाही की तुलना में) | -5.0M |
Q1 2026 की तुलना में। SEC फॉर्म 13F फाइलिंग तिमाही के अंत के 45 दिनों के भीतर देय होती है, साथ ही देर से फाइल करने वालों के लिए एक छोटा बफर भी होता है — उस विंडो के भीतर आने वाली तिमाहियों को सबसे हालिया पूरी तरह से रिपोर्ट की गई जोड़ी के पक्ष में छोड़ दिया जाता है।
| संस्था | मूल्य | शेयर | % ट्रैक किए गए 13F का | प्रकार |
|---|---|---|---|---|
| UBS AM, a distinct business unit of UBS ASSET MANAGEMENT AMERICAS LLC | $904022514 | 8075956 | 12.32% | शेयर |
| Ninety One UK Ltd | $800437080 | 6246584 | 10.91% | शेयर |
| Orbis Allan Gray Ltd | $448937337 | 3503491 | 6.12% | शेयर |
| FMR LLC | $322497741 | 2516761 | 4.40% | शेयर |
| Harding Loevner LP | $291381617 | 2258205 | 3.97% | शेयर |
| Dodge & Cox | $277099675 | 2162476 | 3.78% | शेयर |
| Invesco Ltd. | $262303477 | 2047007 | 3.58% | शेयर |
| MASSACHUSETTS FINANCIAL SERVICES CO /MA/ | $222019043 | 1572437 | 3.03% | शेयर |
| GQG Partners LLC | $157160250 | 1226473 | 2.14% | शेयर |
| AMERICAN CENTURY COMPANIES INC | $148775409 | 1161038 | 2.03% | शेयर |
| Fisher Asset Management, LLC | $146837766 | 1145916 | 2.00% | शेयर |
| BlackRock, Inc. | $140758470 | 1098474 | 1.92% | शेयर |
| MORGAN STANLEY | $135674315 | 1058794 | 1.85% | शेयर |
| ARROWSTREET CAPITAL, LIMITED PARTNERSHIP | $133977161 | 1045553 | 1.83% | शेयर |
| DIMENSIONAL FUND ADVISORS LP | $131811931 | 1028063 | 1.80% | शेयर |
| RENAISSANCE TECHNOLOGIES LLC | $124524914 | 971788 | 1.70% | शेयर |
| LAZARD ASSET MANAGEMENT LLC | $110893959 | 865413 | 1.51% | शेयर |
| Man Group plc | $95755434 | 747272 | 1.31% | शेयर |
| Temasek Holdings (Private) Ltd | $90737728 | 708114 | 1.24% | शेयर |
| BANK OF AMERICA CORP /DE/ | $86731510 | 676850 | 1.18% | शेयर |
| Capital International Investors | $79591785 | 620917 | 1.09% | शेयर |
| UBS Group AG | $79588779 | 621108 | 1.09% | शेयर |
| Davis Selected Advisers | $78544448 | 612955 | 1.07% | शेयर |
| Greenwoods Asset Management Hong Kong Ltd. | $76964856 | 600631 | 1.05% | शेयर |
| Capital World Investors | $75446525 | 588782 | 1.03% | शेयर |
| CAUSEWAY CAPITAL MANAGEMENT LLC | $73348874 | 572412 | 1.00% | शेयर |
| VAN ECK ASSOCIATES CORP | $69632429 | 543409 | 0.95% | शेयर |
| NORTHERN TRUST CORP | $66410734 | 518267 | 0.91% | शेयर |
| Ruffer LLP | $62452868 | 487913 | 0.85% | शेयर |
| Ninety One North America, Inc. | $62277067 | 486008 | 0.85% | शेयर |
| BNP PARIBAS FINANCIAL MARKETS | $52212565 | 407465 | 0.71% | शेयर |
| BRANDES INVESTMENT PARTNERS, LP | $48503691 | 378489 | 0.66% | शेयर |
| MILLENNIUM MANAGEMENT LLC | $47076970 | 367387 | 0.64% | शेयर |
| D. E. Shaw & Co., Inc. | $44336440 | 346000 | 0.60% | शेयर |
| Amundi | $43126926 | 336561 | 0.59% | शेयर |
| TODD ASSET MANAGEMENT LLC | $42602362 | 332458 | 0.58% | शेयर |
| SUSQUEHANNA INTERNATIONAL GROUP, LLP | $39749028 | 310200 | 0.54% | कॉल ऑप्शन |
| Carrhae Capital LLP | $39284777 | 306577 | 0.54% | शेयर |
| Point72 Asset Management, L.P. | $37958143 | 296224 | 0.52% | शेयर |
| WELLINGTON MANAGEMENT GROUP LLP | $36855627 | 287620 | 0.50% | शेयर |
| NORDEA INVESTMENT MANAGEMENT AB | $29539289 | 229040 | 0.40% | शेयर |
| Swedbank AB | $29100594 | 227100 | 0.40% | शेयर |
| ENVESTNET ASSET MANAGEMENT INC | $28301308 | 220862 | 0.39% | शेयर |
| SIH Partners, LLLP | $26784720 | 209027 | 0.37% | शेयर |
| SUSQUEHANNA INTERNATIONAL GROUP, LLP | $26409654 | 206100 | 0.36% | पुट ऑप्शन |
| Capital International, Inc./CA/ | $24617104 | 192111 | 0.34% | शेयर |
| ASSETMARK, INC | $23208953 | 181122 | 0.32% | शेयर |
| Capital Wealth Planning, LLC | $21300841 | 166231 | 0.29% | शेयर |
| MY.Alpha Management HK Advisors Ltd | $20178334 | 157471 | 0.28% | शेयर |
| WELLS FARGO & COMPANY/MN | $19920085 | 155456 | 0.27% | शेयर |
कार्यकर्ता और 5%+ मालिक 4 होल्डिंग्स
जिन निवेशकों ने SEC शेड्यूल 13D दाखिल किया है — जारीकर्ता को प्रभावित करने के इरादे से 5% से अधिक लाभकारी स्वामित्व (कार्यकर्ता दांव, बोर्ड अभियान, M&A)। प्रत्येक पंक्ति उस फाइलर की स्थिति की सबसे हालिया ज्ञात स्थिति दिखाती है।
| फाइलर | दाखिल किया | दांव | स्थिति | उद्देश्य | फाइलिंग |
|---|---|---|---|---|---|
| अघोषित रिपोर्टिंग व्यक्ति | 9 मार्च 2005 | · | प्रारंभिक फाइलिंग | · | SEC |
| अघोषित रिपोर्टिंग व्यक्ति | 9 मार्च 2005 | · | प्रारंभिक फाइलिंग | · | SEC |
| अघोषित रिपोर्टिंग व्यक्ति | 20 दिसमबर 2004 | · | प्रारंभिक फाइलिंग | · | SEC |
| अघोषित रिपोर्टिंग व्यक्ति | 6 जुलाई 2004 | · | प्रारंभिक फाइलिंग | · | SEC |
Purpose is an automated classification of the filer's own stated purpose (SEC Item 4) — not investment advice. "—" means no clear purpose was stated or the text could not be classified.
कंपनी के अंदरूनी सूत्र 2 इनसाइडर्स · 2 अधिकारी · 0 निदेशक
| अंदरूनी | भूमिका | अंतिम गतिविधि | शेयरों का स्वामित्व | खरीद 12m | बिक्री 12m | नेट 12m |
|---|---|---|---|---|---|---|
| Bin Mo | Vice President, Finance | 2 सितमबर 2026 S | 0 | 0 | 1 | $-86378 |
| Paul William Boltz JR | General Counsel | 29 जून 2026 S | 12223 | 0 | 1 | $-1283000 |
SEC फॉर्म 3/4/5 फाइलिंग से अंदरूनी सूत्र; नेट = केवल ओपन-मार्केट P/S
ईटीएफ स्वामित्व 18 ETFs द्वारा धारित
वजन केवल प्रत्यक्ष इक्विटी होल्डिंग्स (N-PORT) को दर्शाता है; लीवरेज्ड या डेरिवेटिव-आधारित फंड में अतिरिक्त स्वैप एक्सपोजर हो सकता है जो नहीं दिखाया गया है।
| फंड | भार | इकाइयाँ | तिथि अनुसार | स्रोत |
|---|---|---|---|---|
| PGJ · Invesco Exchange-Traded Fund Trust | 6.83% | 47705 SH | 1 अक्टूबर 2026 | दैनिक |
| SOCL · Global X Funds | 5.65% | 38524 NS | 31 जुलाई 2026 | N-PORT |
| ODDS · Pacer Funds Trust | 4.82% | 1458 NS | 31 जुलाई 2026 | N-PORT |
| EBIZ · Global X Funds | 4.03% | 8592 NS | 31 जुलाई 2026 | N-PORT |
| DINT · Davis Fundamental ETF Trust | 2.62% | 57107 NS | 31 जुलाई 2026 | N-PORT |
| DWLD · Davis Fundamental ETF Trust | 1.82% | 83408 NS | 31 जुलाई 2026 | N-PORT |
| ABLG · Abacus FCF ETF Trust | 1.51% | 1828 NS | 31 जुलाई 2026 | N-PORT |
| PID · Invesco Exchange-Traded Fund Trust | 1.48% | 103193 SH | 1 अक्टूबर 2026 | दैनिक |
| TIIV · ETF Series Solutions | 1.35% | 3326 NS | 31 जुलाई 2026 | N-PORT |
| DEHP · Dimensional ETF Trust | 1.11% | 35080 NS | 31 जुलाई 2026 | N-PORT |
| TRFM · ETF Series Solutions | 0.34% | 6323 NS | 31 जुलाई 2026 | N-PORT |
| DFSE · Dimensional ETF Trust | 0.32% | 14536 NS | 31 जुलाई 2026 | N-PORT |
| QLVE · FlexShares Trust | 0.26% | 330 NS | 31 जुलाई 2026 | N-PORT |
| PNQI · Invesco Exchange-Traded Fund Trust | 0.26% | 11286 SH | 1 अक्टूबर 2026 | दैनिक |
| DFEM · Dimensional ETF Trust | 0.18% | 118021 NS | 31 जुलाई 2026 | N-PORT |
| FTLS · First Trust Exchange-Traded Fund III | 0.11% | 21313 NS | 31 जुलाई 2026 | N-PORT |
| DFAE · Dimensional ETF Trust | 0.09% | 67006 NS | 31 जुलाई 2026 | N-PORT |
| DFAX · Dimensional ETF Trust | 0.06% | 51836 NS | 31 जुलाई 2026 | N-PORT |
NTES विश्लेषक सर्वसम्मति तेजी और मंदी के विश्लेषक राय, 12-महीने का मूल्य लक्ष्य, अपसाइड
12-महीने का मूल्य लक्ष्य
33 विश्लेषक · 2026-09-27माध्य लक्ष्य $162.71 +38.8%
ताज़ा समाचार इस कंपनी का उल्लेख करने वाली हालिया सुर्खियां
ट्रेडिंग सिग्नल प्रवेश मूल्य और जोखिम/इनाम अनुपात के साथ हालिया खरीद/बिक्री संकेत
अभी कोई खुला सिग्नल नहीं — कोई कार्ड भरा नहीं है, और यह ईमानदार है।
मेरे मेट्रिक्स आपकी व्यक्तिगत वॉचलिस्ट — पूर्ण फंडामेंटल से चयनित पंक्तियाँ
उन मेट्रिक्स को चुनें जो आपके लिए मायने रखते हैं — ऊपर फुल फंडामेंटल्स में किसी भी पंक्ति के बगल में + पर क्लिक करें।
आपका चयन सहेजा गया है और यह सभी टिकर में आपके साथ रहता है।