PKX POSCO HOLDINGS INC. American Depositary Shares (Each representing 1/4th of a share of Common Stock)
NYSE · Metals & Mining · SEC EDGAR पर देखें ↗ बंद अक्ट 2, 2026 10-K/10-Q अप्र 29, 2026PKX स्टॉक स्नैपशॉट मूल्य, बाजार पूंजीकरण, P/E, EPS, ROE, ऋण/इक्विटी, 52-सप्ताह की सीमा
PKX स्टॉक मूल्य चार्ट तकनीकी संकेतकों के साथ दैनिक OHLCV — पैन, ज़ूम और अपना दृश्य कस्टमाइज़ करें
बार ग्रैन्युलैरिटी चयनित अवधि के अनुसार अनुकूलित होती है — बार के लिए ओपन/हाई/लो/क्लोज देखने के लिए चार्ट पर होवर करें।
POSCO HOLDINGS INC. American Depositary Shares (Each representing 1/4th of a share of Common Stock) के बारे में विकिपीडिया से कंपनी का अवलोकन
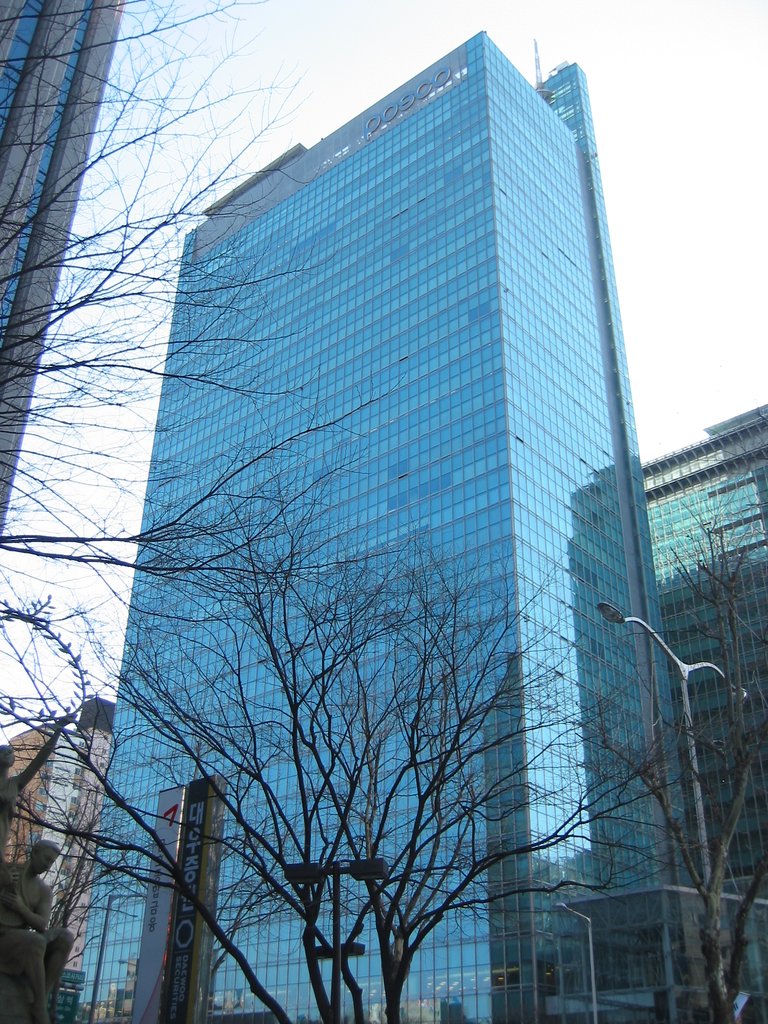
POSCO (formerly Pohang Iron and Steel Company) is a South Korean steel manufacturer headquartered in Pohang, South Korea. It had an output of 42,000,000 metric tons (41,000,000 long tons; 46,000,000 short tons) of crude steel in 2015, making it the world's Seventh-largest steelmaker by this measure. In 2010, it was the world's largest steel manufacturing company by market value. Also, in 2024, it was named as the world's 233rd-largest corporation by the Fortune Global 500.
POSCO currently operates two integrated steel mills in South Korea, in Pohang and Gwangyang. POSCO previously operated a joint venture with U.S. Steel, USS-POSCO Industries, in Pittsburg, California, United States, but U.S. Steel acquired full ownership of the facility in February 2020.
History
1968–1971
In the 1960s, the South Korean government invested in constructing a steel plant for self-sufficiency. The Korean government created Pohang Iron and Steel Company, Ltd (POSCO) in 1968 and appointed as president of the mill a competent retired army general and friend of President Park Chung Hee, Park Tae-joon, a man with a track record of having turned around the government-owned Korea Tungsten Company. Construction of the Pohang plant began on April 1, 1970, and was dedicated on July 3, 1973, with an initial annual capacity of 1.03 million metric tons.
Construction of the initial plant was funded by Japan through the Third South Korea-Japan Ministerial Meeting in 1969. Financing included US$119 million in government grants and loans, US$54 million in credit from the Export-Import Bank of Japan, and technical assistance from corporations such as Nippon Steel. This cooperation followed the normalization of relations with Japan in 1965.
1972–1992
In 1972, POSCO began selling plate products. It focused on the domestic market, aiming to supply quality iron and steel to "related" domestic companies below export prices.
Beginning in 1973, South Korea's government used its National Investment Fund and the Korea Development Bank to invest large amounts of money into what Park Chung-hee's government viewed as the six strategic industries: steel, non-ferrous metals, shipbuilding, industrial machinery, electronics, and petrochemicals. This strategy helped develop companies POSCO and reduced input costs for production in downstream industries as well.
By the late 1980s, POSCO had grown into the "fifth biggest steel company in the noncommunist world," producing millions of tons worth trillions of won. In 1988, the second-phase mill was completed in Gwangyang. POSCO was rated the world's most productive steel manufacturer during that time.
Pohang University of Science and Technology (POSTECH)
POSCO CEO Park Tae-joon was quoted as saying, "You can import coal and machines, but you cannot import talent". Park realized the need for Korea to educate their youth in science and technology to ensure Korea's position in the high technology arena. Park founded the Pohang University of Science and Technology (POSTECH) in 1986 as Korea's first science and technology research-oriented university with the mission to educate young Koreans who can contribute to national prosperity through the advancement in science and technology. In 2012 and 2013, the Times Higher Education ranked POSTECH 1st in their "100 Under 50 Young Universities" rankings.
1992–1997
Changes in managerial systems and organizational structure accelerated in 1993 when POSCO's president and founder, Park Tae-Joon, who had wielded absolute managerial authority for more than 25 years, resigned.
With the change in leadership—from Park Tae-Joon to Ryu-Sang Bu, POSCO increased decentralization and diversification. POSCO's management emphasized greater flexibility, autonomy, and consensual decision-making processes. The chairman also moved to devolve more autonomy to the profit centers and changing from a strictly hierarchical organizational structure to one based on teams.
In July 1994, POSCO created two subsidiary companies, POSTEEL and POSTRADE. POSTEEL is the domestic sales and service arm of the company, while POSTRADE handles international trading of POSCO products. Both subsidiaries commenced full operation in September 1994, with all international POSCO affiliates transferred to POSTRADE by the end of that year. The landmark Posteel Tower on Tehran Street, in Seoul's Gangnam district (not to be confused with the POSCO Center, also on Tehran Street) was completed in 2003.
1997–2000
In 1997, Seoul announced that it was going to transform POSCO into a private company in line with the government's new policy of privatizing state-owned enterprises. The government planned to retain a majority share of the stock; initial reports in the South Korean press in 1998 indicated that the sale of public shares was going slower than anticipated. However, the administration led by Kim Young Sam changed the initial policy direction of privatization of POSCO and decided not to sell government-owned stock to keep it as a government investment enterprise.
But, the Kim Dae Jung administration following the Kim Young Sam administration listed privatization of public enterprise as a high priority policy in economic policy agenda to implement mainly because of outbreak of the economic crisis. The new administration decided to privatize POSCO and by 1998, the South Korean government had reduced its ownership of shares in POSCO to less than 20%, and more than 58% of the shares in POSCO were in the hands of foreign investors. In 2000, full privatization of POSCO was completed.
2001–present
As part of the privatization process, new Chairman Lee Ku-Taek began efforts to introduce a professional management and governance system of global standards for POSCO. Under the new governance system, management made accountability to shareholders a priority. POSCO also introduced a new performance-based evaluation and compensation system. Throughout most of its privatization drive, POSCO increased its revenue and business profit. Thanks to robust demand at home and in China, POSCO recorded the largest profits in the global steel industry in 2004. Net earnings from POSCO's array of steel products – used in everything from screws to skyscrapers – shot up 80% to $1.66 billion in 2004 from the previous year.
On June 30, 2006, POSCO completed the construction of its sixth continuous galvanizing line (CGL) at its Gwangyang mill in the South Jeolla Province. With this new addition, POSCO became the number 2 producer of sheet-steel just behind Arcelor.
With increasing global competition, POSCO looked to China and India for new opportunities. South Korean wages were too high to support a whole range of activities and POSCO looked elsewhere for new projects while keeping the areas where it has a comparative advantage in South Korea. By 2006, POSCO had 26 subsidiaries and invested over $2.4 billion in fresh investment on mainland China, especially in galvanized and stainless steel to supply global auto and appliance makers that have opened plants there. In 2006, POSCO started operating the Zhangjiagang Pohang Stainless Steel (ZPSS) steel mill capable of producing 600,000 tons of stainless steel and hot-rolled products annually in China's Jiangsu Province. As a result, POSCO became the first foreign firm operating an integrated stainless steel mill in China, handling the entire production process from smelting iron ore to finished products, including the cold rolled stainless plant it already operates.
In early 2007, Warren Buffett's Berkshire Hathaway purchased a 4% stake in POSCO. Berkshire sold its share later in 2014.
In May 2012, Nippon Steel filed a lawsuit against POSCO, which was established in the 1960s with technical assistance from Nippon Steel, for illegally acquiring the technology for grain-oriented electrical steel sheets developed by Nippon Steel. It was alleged that POSCO hired ex-employees of Nippon Steel to obtain the technology. An ex-POSCO official stated that the company's Tokyo research centre was effectively an espionage base, whose primary purpose was to collect information about Japanese steel companies on orders from the Korean head office. The lawsuit was settled in 2015 through an agreement under which POSCO paid 30 billion yen to Nippon Steel.
POSCO has maintained its presence in Russia through its local subsidiary, even as the country faces widespread condemnation and international sanctions for its invasion of Ukraine. Operating through its Russian subsidiary, POSCO remains engaged in the Russian market, a decision that has drawn criticism for undermining global efforts to economically isolate Russia. While numerous companies have withdrawn from the Russian market in response to the ongoing war, POSCO's decision to continue operations has sparked significant criticism. Observers argue that its actions contradict global efforts to isolate Russia economically and may be seen as enabling a regime responsible for atrocities and the loss of innocent lives in Ukraine.
In June 2022, POSCO is temporarily cutting production lines in Pohang plants as thousands of truckers go on a strike for higher pay, causing disrupted cargo transport in the country. In July 2026, POSCO sold its stainless steel plant in China.
POSCO in India
In June 2005, POSCO signed a memorandum of understanding with the State of Orissa in India. Under the agreement, POSCO plans to invest US$12 billion to construct a plant with four blast furnaces, an electricity plant, housing, and an annual production capacity of 12,000,000 metric tons (12,000,000 long tons; 13,000,000 short tons) of steel, which is slated to start production in 2010. The project, which would start with a 3,000,000-metric-ton (3,000,000-long-ton; 3,300,000-short-ton) capacity initially, would fetch revenue for the government to the tune of Rs 700 crore to Rs 800 crore (Rs 7-8 billion) annually. It would also provide direct employment to 13,000 people and ensure indirect employment for another 35,000. The Odisha state government also promised to provide a total of 600 million tons of iron sources, and will allow POSCO to use iron ore from these sources over the next 30 years. If the project goes ahead, it will be the single largest foreign direct investment in India as well as being the world's biggest greenfield steel plant ever.
However, from 2005 till date (as of August 7, 2010), the India project has not been able to proceed due to strong opposition from the local residents in the area proposed to be given for the steel plant. There have been allegations that the federal and State governments have been illegally trying to take lands and forests for the project, in violation of the Forest Rights Act. There have also been claims that the project will only benefit the company while displacing more people than it employs, damaging the environment and taking India's mineral resources at a very low price.
Further, a study undertaken by the Mining Zone Peoples' Solidarity Group, an international research group focused on India, finds evidence of irregularities in dealings with state, bureaucracy and judiciary and questions and debunks the social, economic and environmental claims that the project has made.
The MoU between POSCO and State of Odisha expired in 2010. Following allegations that the ministry had not adhered to Forest Rights Act, Ministry of Environment and Forests (MoEF) set up the N.C. Saxena committee in July 2010 to review the clearance. Despite the committee's report indicating that provisions of the Forest Rights Act had been violated, the MoEF issued final order on January 31, 2011, and gave environment clearance to POSCO. In May 2013, the National Green Tribunal (NGT) halted land acquisition for the POSCO projects. In July 2013, POSCO completed land acquisition despite the order given by NGT. In December 2013, POSCO began construction of a boundary wall around its plant site. In December 2013, the NGT criticised the forest clearance granted by the Union Ministry of Environment and Forests (MoEF) to the proposed steel plant of South Korean steel giant, POSCO, in Odisha. There have been reports that during protests and land acquisition during Feb - Mar 2013, there has been bombing attack on the resisting villages and naked protest against the police atrocity.
The Central Government of India came out confident on 15 January 2014 that with the renewal of environment clearance, South Korean steel giant POSCO's project in Odisha would take off soon. After a meeting with visiting South Korean Minister of Trade, Industry and Energy Yoon Sang-jick, Mr. Sharma told the media: "So far, 1,700 acres of land — out of 2,718 acres — have been transferred to POSCO and the rest will soon be given." On July 17, 2015, news reported that South Korean steelmaker POSCO may halt a $12 billion US dollar plan agreed with Odisha, India a decade ago due to the delay in regulatory approvals. In 2016, POSCO confirms with National Green Tribunal (NGT) that it will suspend the steel plant project in Odisha, India. POSCO finally exited from this project on March 18, 2017 (Saturday).
On 13 January 2022, the Adani Group announced that it had signed an MoU with POSCO to explore the setting up of an Integrated Steel Mill in Mundra, Gujarat, with an estimated total investment of US$5 billion.
POSCO in other developing countries
POSCO have pursued investment opportunities in other developing countries such as Vietnam and Mexico. It was announced in August 2006 that POSCO will build a large-scale steel mill in southern Vietnam. POSCO plans to build the US$1 billion plant in two phases for hot-rolled by the end of 2012 and cold rolled products by the time of December 2009. When completed, the mill is expected to produce three-million tons of steel products annually. Posco also plans to build a $250 million plant in the city of Altamira, Mexico, to produce 400,000 tons of galvanized steel sheet a year for automakers. The venture will be Posco's first wholly owned steel-plate plant in North America. Posco began construction in early 2008, and started operations in 2009, producing galvanized and galvannealed steel.
In February 2013 POSCO signed a Memorandum of Understanding with Afferro Mining, Inc, with a view to developing iron ore resources in Cameroon. In December 2013, the steel plant Krakatau Posco – a joint venture with Krakatau Steel – in Cilegon, Indonesia began operation. Its annual production capability is 3 million tons of steel. Posco Holdings opened a 25,000-ton lithium hydroxide factory in Güemes, Argentina in October 2024.
Operations
Head Office
POSCO's Headquarters, along with the POSCO Center, form the 'brain' of the company, overseeing major tasks, such as the management, planning, and finances of the steelworks at Pohang and Gwangyang. The construction of POSCO headquarters at 1 Goedong-dong, Nam-gu, Pohang, was completed on April 1, 1987.
Pohang and Gwangyang Steelworks
Pohang - Constructed in four phases between April 1970 and February 1981 along Korea's southeast coast, the nation's first integrated steelworks has produced 230 million tons of pig iron through March 2004 - enough to build some 250 million compact cars. Crude Steel Production (2008) = 13.6 million tons.
Gwangyang - Constructed in four phases between September 1982 and October 1992 on Korea's southern coast, the nation's second integrated steelworks. Gwangyang focus on manufacturing automotive steel, high-strength structure steel, API line pipe steel, and other strategic product categories. Crude Steel Production (2008) = 17.4 million tons.
=== Subsidiaries ===
स्रोत: विकिपीडिया (अंग्रेज़ी), CC BY-SA 4.0 · विकिपीडिया पर देखें ↗
10-वर्षीय प्रदर्शन राजस्व, शुद्ध आय, मार्जिन और ईपीएस रुझान
मूल्यांकन P/E, P/S, P/B, EV/EBITDA अनुपात — क्या स्टॉक महंगा है या सस्ता?
| मेट्रिक | 5Y रुझान | PKX | 5Y औसत | सहकर्मी माध्यिका | निर्णय |
|---|---|---|---|---|---|
| P/E | 0.05Y औसत ≈0.0 | ≈0.0 | · | · |
सहकर्मी माध्यिका को प्रति मीट्रिक मानकीकृत आधार पर गणना की जाती है और यह हमेशा इस स्टॉक के लिए दिखाए गए TTM/MRQ आधार से मेल नहीं खा सकती है।
लाभप्रदता सकल, परिचालन और शुद्ध मार्जिन; ROE, ROA, ROIC
| मेट्रिक | 5Y रुझान | PKX | 5Y औसत | सहकर्मी माध्यिका | निर्णय |
|---|---|---|---|---|---|
| Gross Margin (सकल मार्जिन) | 7.4%5Y औसत ≈9.6% | ≈9.6% | · | · | |
| Operating Margin (परिचालन मार्जिन) | 2.1%5Y औसत ≈4.9% | ≈4.9% | · | · | |
| EBITDA Margin (EBITDA मार्जिन) | 8.2%5Y औसत ≈10.0% | ≈10.0% | · | · | |
| Pretax Margin (प्रीटैक्स मार्जिन) | 1.7%5Y औसत ≈4.8% | ≈4.8% | · | · | |
| Net Profit Margin (शुद्ध लाभ मार्जिन) | 1.0%5Y औसत ≈3.4% | ≈3.4% | · | · | |
| ROA | 0.66%5Y औसत ≈2.9% | ≈2.9% | · | · | |
| ROE | 1.2%5Y औसत ≈5.3% | ≈5.3% | · | · | |
| ROIC | 1.2%5Y औसत ≈5.5% | ≈5.5% | · | · |
वित्तीय स्वास्थ्य ऋण, तरलता, शोधन क्षमता — बैलेंस शीट की मजबूती
| मेट्रिक | 5Y रुझान | PKX | 5Y औसत | सहकर्मी माध्यिका | निर्णय |
|---|---|---|---|---|---|
| Current Ratio (वर्तमान अनुपात) | 1.95Y औसत ≈2.0 | ≈2.0 | · | · | |
| Quick Ratio (त्वरित अनुपात) | 0.55Y औसत ≈0.5 | ≈0.5 | · | · | |
| Interest Coverage (ब्याज कवरेज) | 1.45Y औसत ≈6.5 | ≈6.5 | · | · |
विकास राजस्व, EPS और शुद्ध आय वृद्धि: YoY, 3Y CAGR, 5Y CAGR
इस टिकर के लिए अभी तक कोई फंडामेंटल डेटा नहीं है।
पूंजी दक्षता एसेट टर्नओवर, इन्वेंटरी टर्नओवर, प्राप्य टर्नओवर
| मेट्रिक | 5Y रुझान | PKX | 5Y औसत | सहकर्मी माध्यिका | निर्णय |
|---|---|---|---|---|---|
| Asset Turnover (परिसंपत्ति टर्नओवर) | 0.75Y औसत ≈0.8 | ≈0.8 | · | · | |
| Inventory Turnover (इन्वेंटरी टर्नओवर) | 4.65Y औसत ≈4.7 | ≈4.7 | · | · | |
| Receivables Turnover (प्राप्य टर्नओवर) | 6.35Y औसत ≈7.5 | ≈7.5 | · | · | |
| Revenue / Employee (राजस्व / कर्मचारी (रिपोर्ट की गई हेडकाउंट, यफाइनांस)। व्युत्पन्न — संग्रहीत SEC-XBRL अवधारणा नहीं है।) | ≈$180.12B | · | · | · |
मान · ≈ 5Y औसत · उद्योग माध्य · माध्य के सापेक्ष निर्णय
लाभांश यील्ड, भुगतान अनुपात, लाभांश इतिहास, 5Y CAGR
| एक्स-डेट | राशि | मुद्रा | यील्ड |
|---|---|---|---|
| अग 28, 2025 | $0.45 | USD | ≈3.4% |
| मई 28, 2025 | $0.46 | USD | ≈4.0% |
| फ़र 28, 2025 | $0.44 | USD | ≈3.9% |
| सित 30, 2024 | $0.45 | USD | ≈3.3% |
| जून 28, 2024 | $0.47 | USD | ≈3.6% |
| मा 28, 2024 | $0.47 | USD | ≈3.0% |
| मा 27, 2024 | $0.45 | USD | ≈2.3% |
| फ़र 28, 2024 | $0.47 | USD | ≈2.4% |
| सित 28, 2023 | $0.48 | USD | ≈1.8% |
| जून 29, 2023 | $0.47 | USD | ≈2.3% |
| मा 30, 2023 | $0.47 | USD | ≈3.0% |
| दिस् 29, 2022 | $0.38 | USD | ≈2.7% |
| सित 29, 2022 | $0.37 | USD | ≈2.9% |
| जून 29, 2022 | $0.74 | USD | ≈1.6% |
| दिस् 26, 2012 | $1.33 | USD | ≈2.1% |
| जून 27, 2012 | $0.37 | USD | ≈2.1% |
| दिस् 28, 2011 | $1.29 | USD | ≈2.1% |
| जून 27, 2011 | $0.45 | USD | ≈2.0% |
| दिस् 28, 2010 | $1.68 | USD | ≈2.0% |
| जून 25, 2010 | $0.43 | USD | ≈0.42% |
Earnings History EPS वास्तविक बनाम अनुमान, आश्चर्य %, बीट दर, अगली आय तिथि
| Period | रिपोर्ट | EPS Actual | EPS अनुमान | आश्चर्य |
|---|---|---|---|---|
| 30 जून 2026 | $9055.00 | $4587.54 | 97.4% | |
| 31 मार्च 2026 | $6178.00 | $4920.20 | 25.6% | |
| 31 दिसमबर 2025 | $-2980.02 | $4153.96 | -171.7% | |
| 30 सितमबर 2025 | $5565.00 | $4451.32 | 25.0% | |
| 30 जून 2025 | $2114.00 | $4537.04 | -53.4% | |
| 31 मार्च 2025 | $-2980.02 | $4153.96 | -171.7% |
पूर्ण मौलिक सभी मेट्रिक्स प्रति वर्ष — आय विवरण, बैलेंस शीट, नकदी प्रवाह
आय विवरण
| मेट्रिक | रुझान | 2025 | 2024 | 2023 | 2022 | 2021 | 2020 | 2019 | 2018 | 2017 | 2016 |
|---|---|---|---|---|---|---|---|---|---|---|---|
| Revenue | $68.99T | $73.46T | $77.06T | $85.00T | $76.01T | $57.47T | $64.79T | $65.15T | $60.19T | $52.94T | |
| Cost of Revenue | $63.85T | $67.97T | $70.64T | $77.32T | $64.15T | $52.80T | $58.46T | $57.13T | $51.92T | $46.27T | |
| Gross Profit | $5.14T | $5.49T | $6.42T | $7.68T | $11.85T | $4.67T | $6.32T | $8.03T | $8.27T | $6.67T | |
| R&D Expense | $527.18B | $555.56B | $518.41B | $536.27B | $468.55B | $468.13B | $499.77B | $526.60B | $486.89B | $444.80B | |
| Operating Income | $1.48T | $1.45T | $2.74T | $4.34T | $8.78T | $2.05T | $3.22T | $4.04T | $4.20T | $2.28T | |
| Interest Expense | $1.09T | $1.05T | $1.00T | $607.46B | $439.83B | $638.80B | $755.71B | $741.30B | $653.12B | $658.73B | |
| Interest Income | $3.22T | $5.21T | $3.83T | $4.83T | $2.73T | $2.68T | $1.87T | $1.71T | $2.37T | $2.23T | |
| Pretax Income | $1.14T | $1.33T | $2.64T | $4.05T | $9.39T | $1.97T | $3.13T | $3.62T | $4.10T | $1.41T | |
| Income Tax | $612.13B | $320.95B | $789.37B | $461.53B | $2.21T | $224.27B | $1.09T | $1.68T | $1.19T | $379.54B | |
| Net Income | $690.69B | $1.13T | $1.70T | $3.16T | $6.61T | $1.58T | $1.86T | $1.71T | $2.76T | $1.35T | |
| EPS (Basic) | $9134.00 | $14853.00 | $22383.00 | $41634.00 | $87191.00 | $19900.00 | $23189.00 | $21177.00 | · | · | |
| EPS (Diluted) | $9134.00 | $12640.00 | $22383.00 | $39296.00 | $85240.00 | $19900.00 | $23189.00 | · | · | · | |
| Shares (Basic) | 75,620,779 | 75,767,552 | 75,869,542 | 75,814,870 | 75,696,150 | 79,120,963 | 80,113,759 | 80,000,606 | 79,998,600 | 79,996,389 | |
| Shares (Diluted) | 75,620,779 | 77,990,432 | 75,869,542 | 78,906,375 | 76,688,340 | 79,120,963 | 80,113,759 | · | · | · | |
| EBITDA | $5.64T | $5.44T | $6.56T | $8.03T | $12.35T | $5.68T | $6.68T | $7.31T | $7.49T | · |
बैलेंस शीट
| मेट्रिक | रुझान | 2025 | 2024 | 2023 | 2022 | 2021 | 2020 | 2019 | 2018 | 2017 | 2016 |
|---|---|---|---|---|---|---|---|---|---|---|---|
| Cash & Equivalents | $8.45B | $9.19B | $12.31B | $7.51B | $8.94B | $3.10B | $2.08B | $1.67B | $1.90B | $11.96B | |
| Receivables | $11.18T | $10.82T | $10.80T | $9.70T | $9.98T | $8.11T | $9.07T | $9.13T | $8.82T | · | |
| Inventory | $13.74T | $14.18T | $14.56T | $16.13T | $16.10T | $9.64T | $11.23T | $12.15T | $10.79T | $9.52T | |
| Current Assets | $43.58T | $44.07T | $46.73T | $48.24T | $47.42T | $36.40T | $35.14T | $34.15T | $31.84T | $29.66T | |
| PP&E (Net) | $42.29T | $39.85T | $35.21T | $31.78T | $29.60T | $29.40T | $29.93T | $30.02T | $31.88T | $33.77T | |
| Goodwill | $826.77B | $357.85B | $403.17B | $442.49B | $735.97B | $903.89B | $1.10T | $1.13T | $1.35T | $1.38T | |
| Total Assets | $105.29T | $103.44T | $101.49T | $99.02T | $92.30T | $79.68T | $79.37T | $78.78T | $79.79T | $80.14T | |
| Current Liabilities | $23.07T | $22.74T | $22.47T | $23.43T | $21.27T | $17.21T | $16.55T | $19.43T | $19.49T | $18.94T | |
| Total Liabilities | $42.89T | $42.00T | $41.89T | $40.83T | $37.58T | $32.08T | $31.61T | $32.10T | $32.46T | $34.37T | |
| Retained Earnings | $53.20T | $53.64T | $53.81T | $52.92T | $51.48T | $46.06T | $45.05T | $44.16T | $42.97T | $41.13T | |
| Stockholders' Equity | $55.76T | $55.39T | $54.15T | $52.48T | $50.38T | $44.29T | $44.46T | $43.33T | $43.66T | $42.33T |
नकदी प्रवाह
| मेट्रिक | रुझान | 2025 | 2024 | 2023 | 2022 | 2021 | 2020 | 2019 | 2018 | 2017 | 2016 |
|---|---|---|---|---|---|---|---|---|---|---|---|
| D&A | $4.16T | $3.98T | $3.82T | $3.69T | $3.58T | $3.62T | $3.46T | $3.27T | $3.30T | $3.21T | |
| Other Non-cash | $-278.00B | $1.55T | $646.21B | $-658.39B | $-3.93T | $3.48T | $679.13B | $890.19B | $-446.34B | · | |
| Operating Cash Flow | $4.57T | $6.66T | $6.17T | $6.19T | $6.26T | $8.69T | $6.00T | $5.87T | $5.61T | $5.27T | |
| CapEx | $5.67T | $7.67T | $6.73T | $4.93T | $3.07T | $3.15T | $2.52T | $2.14T | $2.29T | $2.32T | |
| Investing Cash Flow | $-6.69T | $-4.49T | $-7.39T | $-4.22T | $-5.58T | $-6.26T | $-3.68T | $-2.65T | $-3.82T | $-3.75T | |
| Dividends Paid | $915.22B | $844.20B | $815.45B | $1.22T | $1.31T | $659.14B | $946.22B | $723.93B | $863.45B | $708.97B | |
| Financing Cash Flow | $2.40T | $-2.30T | $-178.59B | $1.32T | $-768.67B | $-1.09T | $-1.51T | $-3.20T | $-1.57T | $-3.95T | |
| Free Cash Flow | $-1.09T | $-1.01T | $-565.59B | $1.26T | $3.19T | $5.53T | $3.49T | $3.73T | $3.32T | · | |
| Levered FCF | $-1.60T | $-1.80T | $-1.27T | $720.99B | $2.85T | $4.97T | $2.99T | $3.34T | $2.86T | · |
लाभप्रदता
| मेट्रिक | रुझान | 2025 | 2024 | 2023 | 2022 | 2021 | 2020 | 2019 | 2018 | 2017 | 2016 |
|---|---|---|---|---|---|---|---|---|---|---|---|
| Gross Margin | 7.4% | 7.5% | 8.3% | 9.0% | 15.6% | 8.1% | 9.8% | 12.3% | 13.7% | · | |
| Operating Margin | 2.1% | 2.0% | 3.5% | 5.1% | 11.6% | 3.6% | 5.0% | 6.2% | 7.0% | · | |
| Net Margin | 1.0% | 1.5% | 2.2% | 3.7% | 8.7% | 2.8% | 2.9% | 2.6% | 4.6% | · | |
| Pretax Margin | 1.7% | 1.8% | 3.4% | 4.8% | 12.3% | 3.4% | 4.8% | 5.5% | 6.8% | · | |
| EBITDA Margin | 8.2% | 7.4% | 8.5% | 9.4% | 16.2% | 9.9% | 10.3% | 11.2% | 12.4% | · | |
| ROA | 0.66% | 1.1% | 1.7% | 3.3% | 7.7% | 2.0% | 2.4% | 2.2% | 3.5% | · | |
| ROE | 1.2% | 2.1% | 3.2% | 6.1% | 14.0% | 3.6% | 4.2% | 3.9% | 6.4% | · | |
| ROIC | 1.2% | 2.0% | 3.5% | 7.3% | 13.3% | 4.1% | 4.7% | 5.0% | 6.8% | · |
तरलता और शोधन क्षमता
| मेट्रिक | रुझान | 2025 | 2024 | 2023 | 2022 | 2021 | 2020 | 2019 | 2018 | 2017 | 2016 |
|---|---|---|---|---|---|---|---|---|---|---|---|
| Current Ratio | 1.9 | 1.9 | 2.1 | 2.1 | 2.2 | 2.1 | 2.1 | 1.8 | 1.6 | · | |
| Quick Ratio | 0.5 | 0.5 | 0.5 | 0.4 | 0.5 | 0.5 | 0.5 | 0.5 | 0.0 | · | |
| Interest Coverage | 1.4 | 1.4 | 2.7 | 7.1 | 20.0 | 3.2 | 4.3 | 5.5 | 6.4 | · |
दक्षता
| मेट्रिक | रुझान | 2025 | 2024 | 2023 | 2022 | 2021 | 2020 | 2019 | 2018 | 2017 | 2016 |
|---|---|---|---|---|---|---|---|---|---|---|---|
| Asset Turnover | 0.7 | 0.7 | 0.8 | 0.9 | 0.9 | 0.7 | 0.8 | 0.8 | 0.8 | · | |
| Inventory Turnover | 4.6 | 4.7 | 4.6 | 4.8 | 5.0 | 5.1 | 5.0 | 5.0 | 5.1 | · | |
| Receivables Turnover | 6.3 | 6.8 | 7.5 | 8.6 | 8.4 | 6.7 | 7.1 | 7.3 | · | · |
प्रति शेयर
| मेट्रिक | रुझान | 2025 | 2024 | 2023 | 2022 | 2021 | 2020 | 2019 | 2018 | 2017 | 2016 |
|---|---|---|---|---|---|---|---|---|---|---|---|
| Revenue / Share | $912274.89 | $941902.82 | $1015645.37 | $1077271.84 | $991144.17 | · | · | · | · | · | |
| Cash Flow / Share | $60458.38 | $85441.96 | $81293.43 | $78406.40 | $81620.82 | · | · | · | · | · | |
| EPS (TTM) | $9134.00 | $12640.00 | $22383.00 | $39296.00 | $85240.00 | $19900.00 | $23189.00 | · | · | · |
मूल्यांकन (TTM)
| मेट्रिक | रुझान | 2025 | 2024 | 2023 | 2022 | 2021 | 2020 | 2019 | 2018 | 2017 | 2016 |
|---|---|---|---|---|---|---|---|---|---|---|---|
| Revenue TTM | $68.99T | $73.46T | $77.06T | $85.00T | $76.01T | $57.47T | $64.79T | $65.15T | $60.19T | · | |
| Net Income TTM | $690.69B | $1.13T | $1.70T | $3.16T | $6.61T | $1.58T | $1.86T | $1.71T | $2.76T | · | |
| P/E | 0.0 | 0.0 | 0.0 | 0.0 | 0.0 | 0.0 | 0.0 | · | · | · | |
| Earnings Yield | 17166.0% | 29151.3% | 23533.8% | 72142.5% | 146234.4% | 31937.1% | 45810.0% | · | · | · | |
| Payout Ratio | 132.5% | 75.0% | 48.0% | 38.6% | 19.8% | 41.7% | 50.7% | 42.3% | 31.3% | · | |
| Annual Payout | $915.22B | $844.20B | $815.45B | $1.22T | $1.31T | $659.14B | $946.22B | $723.93B | $863.45B | · |
मूल्यांकन (TTM)
| मेट्रिक | रुझान | Q4 2016 | Q4 2015 | Q4 2014 | Q4 2013 | Q4 2012 | Q4 2011 | Q4 2010 | Q4 2009 | Q4 2008 | Q4 2007 | Q4 2006 | Q4 2005 | Q4 2004 | Q4 2003 | Q4 2002 | Q4 2001 |
|---|---|---|---|---|---|---|---|---|---|---|---|---|---|---|---|---|---|
| Revenue TTM | $52.94T | $58.52T | · | · | · | · | · | · | · | · | · | · | · | · | · | · | |
| Net Income TTM | $1.35T | $171.49B | · | · | · | · | · | · | · | · | · | · | · | · | · | · | |
| Annual Payout | $708.97B | $822.57B | · | · | · | · | · | · | · | · | · | · | · | · | · | · |
सबसे हाल की अवधि बाईं ओर · शून्य मान इस प्रकार दिखाए गए हैं ·
वित्तीय विवरण आय विवरण, बैलेंस शीट, नकदी प्रवाह — वार्षिक, पिछले 5 वर्ष
| मेट्रिक | 2025-12-31 | 2024-12-31 | 2023-12-31 | 2022-12-31 | 2021-12-31 |
|---|---|---|---|---|---|
| राजस्व | $68.99T | $73.46T | $77.06T | $85.00T | $76.01T |
| सकल मार्जिन % | 7.4% | 7.5% | 8.3% | 9.0% | 15.6% |
| परिचालन मार्जिन % | 2.1% | 2.0% | 3.5% | 5.1% | 11.6% |
| शुद्ध आय | $690.69B | $1.13T | $1.70T | $3.16T | $6.61T |
| तनुकरणित EPS | $9134.00 | $12640.00 | $22383.00 | $39296.00 | $85240.00 |
| मेट्रिक | 2025-12-31 | 2024-12-31 | 2023-12-31 | 2022-12-31 | 2021-12-31 |
|---|---|---|---|---|---|
| वर्तमान अनुपात | 1.9 | 1.9 | 2.1 | 2.1 | 2.2 |
| त्वरित अनुपात | 0.5 | 0.5 | 0.5 | 0.4 | 0.5 |
| मेट्रिक | 2025-12-31 | 2024-12-31 | 2023-12-31 | 2022-12-31 | 2021-12-31 |
|---|---|---|---|---|---|
| फ्री कैश फ्लो | $-1.09T | $-1.01T | $-565.59B | $1.26T | $3.19T |
संस्थागत मालिक (13F) 188 फाइलर्स · $692.5M कुल · तिथि अनुसार 30 सितमबर 2026
संस्थान जो अपनी तिमाही SEC फॉर्म 13F में इस स्टॉक को होल्ड करने की रिपोर्ट करते हैं। केवल लॉन्ग पोजीशन; एक ही फाइलर अलग-अलग ऑप्शन लेग्स के लिए दो बार दिखाई दे सकता है। बड़े ऑफसेटिंग पुट/कॉल लेग्स आमतौर पर मार्केट-मेकिंग या हेज्ड इन्वेंट्री को दर्शाते हैं, न कि दिशात्मक विश्वास को।
| नई स्थितियाँ | बाहर निकली पोजीशन | बढ़ाया | घटा हुआ | शुद्ध शेयर परिवर्तन |
|---|---|---|---|---|
| 31 (-6 पिछली तिमाही की तुलना में) | 19 (+7 पिछली तिमाही की तुलना में) | 99 (+7 पिछली तिमाही की तुलना में) | 32 (+5 पिछली तिमाही की तुलना में) | +3.4M |
Q1 2026 की तुलना में। SEC फॉर्म 13F फाइलिंग तिमाही के अंत के 45 दिनों के भीतर देय होती है, साथ ही देर से फाइल करने वालों के लिए एक छोटा बफर भी होता है — उस विंडो के भीतर आने वाली तिमाहियों को सबसे हालिया पूरी तरह से रिपोर्ट की गई जोड़ी के पक्ष में छोड़ दिया जाता है।
| संस्था | मूल्य | शेयर | % ट्रैक किए गए 13F का | प्रकार |
|---|---|---|---|---|
| BlackRock, Inc. | $146405795 | 2849471 | 21.14% | शेयर |
| MORGAN STANLEY | $86992133 | 1693111 | 12.56% | शेयर |
| DIMENSIONAL FUND ADVISORS LP | $49834084 | 969912 | 7.20% | शेयर |
| STATE STREET CORP | $46194114 | 899068 | 6.67% | शेयर |
| AMERICAN CENTURY COMPANIES INC | $37077812 | 721639 | 5.35% | शेयर |
| GOLDMAN SACHS GROUP INC | $27009139 | 525674 | 3.90% | शेयर |
| Creative Planning | $24546628 | 477747 | 3.54% | शेयर |
| Quantinno Capital Management LP | $19142257 | 372562 | 2.76% | शेयर |
| BNP PARIBAS FINANCIAL MARKETS | $15814558 | 307796 | 2.28% | शेयर |
| VANGUARD GROUP INC | $15173257 | 285158 | 2.19% | शेयर |
| VANGUARD CAPITAL MANAGEMENT LLC | $13868335 | 269917 | 2.00% | शेयर |
| NORTHERN TRUST CORP | $13587133 | 264444 | 1.96% | शेयर |
| Qube Research & Technologies Ltd | $12757037 | 248288 | 1.84% | शेयर |
| RENAISSANCE TECHNOLOGIES LLC | $9037742 | 175900 | 1.31% | शेयर |
| Point72 Asset Management, L.P. | $8466294 | 164778 | 1.22% | शेयर |
| VAN ECK ASSOCIATES CORP | $8167930 | 158971 | 1.18% | शेयर |
| BARCLAYS PLC | $7349292 | 143038 | 1.06% | शेयर |
| Vanguard Personalized Indexing Management, LLC | $6898279 | 134260 | 1.00% | शेयर |
| UBS Group AG | $6214308 | 120948 | 0.90% | शेयर |
| BANK OF AMERICA CORP /DE/ | $5213066 | 101461 | 0.75% | शेयर |
| NLB Skladi, upravljanje premozenja, d.o.o. | $4645112 | 90407 | 0.67% | शेयर |
| JANE STREET GROUP, LLC | $4593269 | 89398 | 0.66% | शेयर |
| QUADRANT CAPITAL GROUP LLC | $4420273 | 86031 | 0.64% | शेयर |
| RHUMBLINE ADVISERS | $4159307 | 80952 | 0.60% | शेयर |
| STIFEL FINANCIAL CORP | $4085076 | 79506 | 0.59% | शेयर |
| XTX Topco Ltd | $3647774 | 70996 | 0.53% | शेयर |
| Connor, Clark & Lunn Investment Management Ltd. | $3546813 | 69031 | 0.51% | शेयर |
| Ramirez Asset Management, Inc. | $3396697 | 66109 | 0.49% | शेयर |
| Laird Norton Wetherby Trust Company, LLC | $3361537 | 65425 | 0.49% | शेयर |
| FMR LLC | $3309732 | 64417 | 0.48% | शेयर |
| Vident Advisory, LLC | $3156163 | 61428 | 0.46% | शेयर |
| D. E. Shaw & Co., Inc. | $3009018 | 58564 | 0.43% | शेयर |
| IEQ CAPITAL, LLC | $2944564 | 57310 | 0.43% | शेयर |
| MARSHALL WACE, LLP | $2826105 | 55004 | 0.41% | शेयर |
| Grantham, Mayo, Van Otterloo & Co. LLC | $2691952 | 52393 | 0.39% | शेयर |
| Corient Private Wealth LP | $2608101 | 50761 | 0.38% | शेयर |
| US BANCORP \DE\ | $2518956 | 49026 | 0.36% | शेयर |
| Frank, Rimerman Advisors LLC | $2501435 | 48685 | 0.36% | शेयर |
| Sequoia Financial Advisors, LLC | $2487814 | 48420 | 0.36% | शेयर |
| Walleye Capital LLC | $2410287 | 46911 | 0.35% | शेयर |
| CIBC WORLD MARKET INC. | $2153850 | 41920 | 0.31% | शेयर |
| Cerity Partners LLC | $2138005 | 41612 | 0.31% | शेयर |
| CITADEL ADVISORS LLC | $2065270 | 40196 | 0.30% | शेयर |
| O'SHAUGHNESSY ASSET MANAGEMENT, LLC | $1897515 | 36931 | 0.27% | शेयर |
| SIGNATUREFD, LLC | $1892891 | 36841 | 0.27% | शेयर |
| BANK OF MONTREAL /CAN/ | $1804671 | 35124 | 0.26% | शेयर |
| PNC Financial Services Group, Inc. | $1591414 | 30973 | 0.23% | शेयर |
| BAROMETER CAPITAL MANAGEMENT INC. | $1572228 | 30600 | 0.23% | शेयर |
| CITIGROUP INC | $1515967 | 29505 | 0.22% | शेयर |
| FIRST TRUST ADVISORS LP | $1504461 | 29281 | 0.22% | शेयर |
ईटीएफ स्वामित्व 8 ETFs द्वारा धारित
वजन केवल प्रत्यक्ष इक्विटी होल्डिंग्स (N-PORT) को दर्शाता है; लीवरेज्ड या डेरिवेटिव-आधारित फंड में अतिरिक्त स्वैप एक्सपोजर हो सकता है जो नहीं दिखाया गया है।
| फंड | भार | इकाइयाँ | तिथि अनुसार | स्रोत |
|---|---|---|---|---|
| DFEV · Dimensional ETF Trust | 0.10% | 36718 NS | 31 जुलाई 2026 | N-PORT |
| DEXC · Dimensional ETF Trust | 0.10% | 5681 NS | 31 जुलाई 2026 | N-PORT |
| GTO · Invesco Actively Managed Exchange-T… | 0.05% | 1381000 | 2 अक्टूबर 2026 | दैनिक |
| DFAE · Dimensional ETF Trust | 0.04% | 64167 NS | 31 जुलाई 2026 | N-PORT |
| DFEM · Dimensional ETF Trust | 0.02% | 32368 NS | 31 जुलाई 2026 | N-PORT |
| DFAX · Dimensional ETF Trust | 0.01% | 23704 NS | 31 जुलाई 2026 | N-PORT |
| VEU · VANGUARD INTERNATIONAL EQUITY INDEX… | 0.01% | 251282 SH | 19 अगस्त 2026 | दैनिक |
| VT · VANGUARD INTERNATIONAL EQUITY INDEX… | 0.00% | 18635 SH | 19 अगस्त 2026 | दैनिक |
PKX विश्लेषक सर्वसम्मति तेजी और मंदी के विश्लेषक राय, 12-महीने का मूल्य लक्ष्य, अपसाइड
12-महीने का मूल्य लक्ष्य
1 विश्लेषक · 2026-09-28माध्य लक्ष्य $68.04 +18.1%
ताज़ा समाचार इस कंपनी का उल्लेख करने वाली हालिया सुर्खियां
मेरे मेट्रिक्स आपकी व्यक्तिगत वॉचलिस्ट — पूर्ण फंडामेंटल से चयनित पंक्तियाँ
उन मेट्रिक्स को चुनें जो आपके लिए मायने रखते हैं — ऊपर फुल फंडामेंटल्स में किसी भी पंक्ति के बगल में + पर क्लिक करें।
आपका चयन सहेजा गया है और यह सभी टिकर में आपके साथ रहता है।