
CMSD CMS Energy Corporation 5.875% Junior Subordinated Notes due 2079
NYSE · Utilities · ดูใน SEC EDGAR ↗ ปิด ต.ค. 2, 2026 10-K/10-Q ก.ค. 28, 2026CMSD ภาพรวมหุ้น ราคา, มูลค่าหลักทรัพย์ตามราคาตลาด, P/E, EPS, ROE, อัตราส่วนหนี้สินต่อทุน, ช่วงราคา 52 สัปดาห์
CMSD กราฟราคาหุ้น OHLCV รายวันพร้อมตัวชี้วัดทางเทคนิค — แพน ซูม และปรับแต่งมุมมองของคุณ
ความละเอียดของแท่งเทียนจะปรับตามช่วงเวลาที่เลือก — เลื่อนเมาส์เหนือแผนภูมิเพื่อดูราคาเปิด/สูงสุด/ต่ำสุด/ปิดของแท่งเทียน
เกี่ยวกับ CMS Energy Corporation 5.875% Junior Subordinated Notes due 2079 ภาพรวมบริษัทจาก Wikipedia
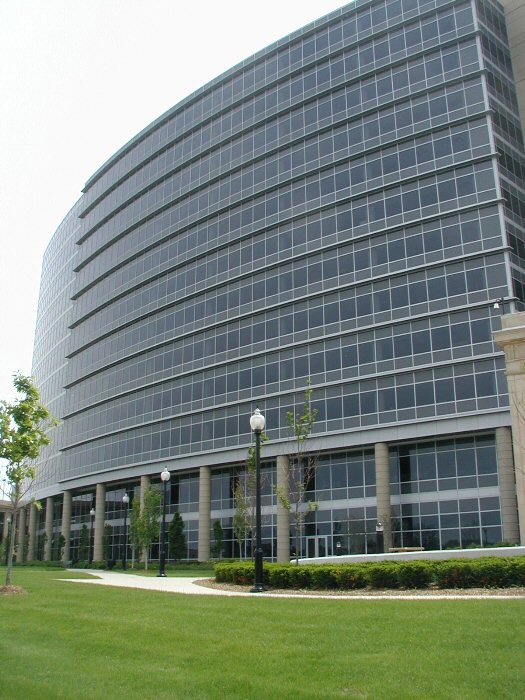
CMS Energy Corporation is an American energy company based in Jackson, Michigan, that is focused principally on utility operations in Michigan. Its principal business is Consumers Energy, a public utility that provides electricity and natural gas to more than 6 million of Michigan's 10 million residents. Its non-utility businesses are focused primarily on domestic independent power production. Consumers Energy has operated since 1886.
NorthStar Clean Energy's primary businesses are independent power production and natural gas transmission.
History
CMS Energy was formed in 1987 as a holding company with its principal subsidiaries as Consumers Energy and NorthStar Clean Energy. On October 23, 1987, CMS Energy became a publicly owned company and was listed at the New York Stock Exchange. The company's history dates back to 1886, when William Augustine Foote and Samuel Jarvis initially approached Jackson, Michigan officials and asked them to support efforts to illuminate Jackson's downtown with electric arc lights. They formed a company, Jackson Electric Light Works in 1888. In 1889, they built a hydro plant project at the Trowbridge Dam on the Kalamazoo River in Allegan. Foote, after seeing some early success, began consolidating his small power companies and formed Commonwealth Power Company.
In 1907, Foote and Jarvis built Croton Hydro project on the Muskegon River, the first project in the world that could transmit 110,000 volts of electricity. In 1920, Foote and Jarvis offered preferred shares of their company to the public to secure sufficient financing to enter other energy and power generation sectors. Over the next decades the company built several coal-fired, natural gas, nuclear and electric facilities. In 1946, the company formed a strategic partnership with Panhandle Company to convert former natural gas fields to underground natural gas storage areas. CMS Energy's primary subsidiary, Consumers Energy, announced Michigan's first nuclear power plant in 1961, Big Rock Point in Charlevoix, Michigan.
The company announced another nuclear plant, Palisades Nuclear Generating Station on Lake Michigan, which first produced electricity in December, 1971 to serve 400,000 people a day. CMS Energy owned the plant until 2006, when it was sold to Entergy. It then announced a gas reforming plant to furnish heat for Michigan homes in 1971. This plant was the first of its kind in North America to produce synthetic gas, converting impure liquid petroleum into pipeline-quality natural gas.
In 1987, CMS Energy, a holding company with its principal subsidiaries as Consumers Power and CMS Enterprises was formed. Consumers Power was rebranded Consumers Energy in 1997. The firm was one of the first companies to introduce an online billing system in the late 1990s.
In 2001, the firm entered into an exploration agreement with Eritrea for oil exploration in the Dismin Block of the Red Sea.
In 2002, CMS Energy founded EnerBank USA.
In 2003, the firm moved its headquarters to One Energy Plaza in Jackson, Michigan. In 2007, the company announced plans to invest $6 billion in Michigan's energy future to support new power plant technology and identify new energy sources. In 2014, Consumers Energy opened Cross Winds Energy Park in Michigan's Tuscola County and signed a contract with General Electric to supply 621.79-kilowatt wind turbine engines for the project which has a total generating capacity of 105 megawatts.
Oct 1, 2021, CMS Energy Completes Sale of EnerBank USA to Regions Bank.
On Nov 1st 2022, CMS Enterprises changes name to NorthStar Clean Energy as it begins to serve more corporate clients.
Sustainability and Environment
In 2015, 9 percent of CMS Energy's power comes from renewable energy sources. Primary CMS Energy subsidiary Consumers Energy joined the Wildlife Habitat Council as an active member. By 2007, all power facilities received the Clean Corporate Citizen award from the Michigan Department of Environmental Quality.
Awards
Consumers Energy, CMS Energy's primary subsidiary, was named Energy Star Partner of the Year in 2014 and 2015 for excellence in sustainable energy efficiency programs. In 2014, Consumers Energy was ranked among the top 15 most sustainable energy providers. Later that year, CMS Energy received Edison Electric Institute's Index Award for top cumulative shareholder return in the small cap category. The firm received the 2015 Emergency Recovery Award for its electricity restoration efforts during the December 2013 North American storm complex.
Criticism
In December 2011, the non-partisan organization Public Campaign criticized CMS Energy for spending $3.48 million on lobbying and not paying any taxes during 2008-2010, instead getting $29 million in tax rebates, despite making a profit of $415 million, and increasing executive pay by 79% to $900.4 million in 2010 for its top 5 executives.
Philanthropy
CMS Energy has helped establish and finance numerous research, educational and cultural institutes in the United States. Consumers Energy was given the William Booth Award in 2013 by The Salvation Army in recognition of its long history of philanthropic activities and leadership for the PeopleCare assistance program.
CMS Energy participates in internship and cooperative education programs to build career opportunities in Michigan. Consumers Energy has also worked on early childhood development and education in Michigan and has also received Wildlife Habitat Council (WHC) compliant certificates for its efforts to promote environmental education.
แหล่งที่มา: Wikipedia (ภาษาอังกฤษ), CC BY-SA 4.0 · ดูบน Wikipedia ↗
ผลการดำเนินงาน 10 ปี แนวโน้มรายได้ กำไรสุทธิ อัตรากำไร และ EPS
การประเมินมูลค่า อัตราส่วน P/E, P/S, P/B, EV/EBITDA — หุ้นมีราคาแพงหรือถูก?
| ตัวชี้วัด | แนวโน้ม 5 ปี | CMSD | ค่าเฉลี่ย 5 ปี | ค่ามัธยฐานของกลุ่มอุตสาหกรรม | บทสรุป |
|---|---|---|---|---|---|
| P/B (MRQ) | 0.7 | · | · | · |
ค่ามัธยฐานของกลุ่มบริษัทคำนวณตามมาตรฐานสำหรับแต่ละตัวชี้วัด และอาจไม่ตรงกับเกณฑ์ TTM/MRQ ที่แสดงสำหรับหุ้นนี้เสมอไป
ความสามารถในการทำกำไร อัตรากำไรขั้นต้น, อัตรากำไรจากการดำเนินงาน และอัตรากำไรสุทธิ; ROE, ROA, ROIC
ยังไม่มีข้อมูลพื้นฐานเพียงพอที่จะคำนวณกลุ่มอัตราส่วนนี้
สุขภาพทางการเงิน หนี้สิน, สภาพคล่อง, ความสามารถในการชำระหนี้ — ความแข็งแกร่งของงบดุล
| ตัวชี้วัด | แนวโน้ม 5 ปี | CMSD | ค่าเฉลี่ย 5 ปี | ค่ามัธยฐานของกลุ่มอุตสาหกรรม | บทสรุป |
|---|---|---|---|---|---|
| หนี้สินต่อทุน (MRQ) | 1.9 | · | · | · | |
| อัตราส่วนสภาพคล่อง (MRQ) | 0.9 | · | · | · | |
| หนี้สินระยะยาว / ส่วนของผู้ถือหุ้น (MRQ) | 1.9 | · | · | · |
การเติบโต การเติบโตของรายได้, EPS และกำไรสุทธิ: YoY, CAGR 3 ปี, CAGR 5 ปี
ยังไม่มีข้อมูลพื้นฐานเพียงพอที่จะคำนวณกลุ่มอัตราส่วนนี้
ประสิทธิภาพของเงินทุน อัตราหมุนเวียนสินทรัพย์, อัตราหมุนเวียนสินค้าคงคลัง, อัตราหมุนเวียนลูกหนี้
ยังไม่มีข้อมูลพื้นฐานเพียงพอที่จะคำนวณกลุ่มอัตราส่วนนี้
มูลค่า · ≈ ค่าเฉลี่ย 5 ปี · ค่าเฉลี่ยอุตสาหกรรม · การตัดสินใจเทียบกับค่าเฉลี่ย
เงินปันผล ผลตอบแทน, อัตราการจ่ายเงินปันผล, ประวัติเงินปันผล, CAGR 5 ปี
| วันที่ไม่ได้รับสิทธิปันผล | จำนวน | สกุลเงิน | ผลตอบแทน |
|---|---|---|---|
| ส.ค. 17, 2026 | $0.37 | USD | ≈6.9% |
| พ.ค. 15, 2026 | $0.37 | USD | ≈6.4% |
| ก.พ. 13, 2026 | $0.37 | USD | ≈6.2% |
| พ.ย. 14, 2025 | $0.37 | USD | ≈6.1% |
| ส.ค. 15, 2025 | $0.37 | USD | ≈6.3% |
| พ.ค. 16, 2025 | $0.37 | USD | ≈6.7% |
| ก.พ. 14, 2025 | $0.37 | USD | ≈6.2% |
| พ.ย. 15, 2024 | $0.37 | USD | ≈6.0% |
| ส.ค. 16, 2024 | $0.37 | USD | ≈6.0% |
| พ.ค. 16, 2024 | $0.37 | USD | ≈6.0% |
| ก.พ. 14, 2024 | $0.37 | USD | ≈6.0% |
| พ.ย. 15, 2023 | $0.37 | USD | ≈6.2% |
| ส.ค. 16, 2023 | $0.37 | USD | ≈6.2% |
| พ.ค. 16, 2023 | $0.37 | USD | ≈6.1% |
| ก.พ. 13, 2023 | $0.37 | USD | ≈6.0% |
| พ.ย. 15, 2022 | $0.37 | USD | ≈6.2% |
| ส.ค. 16, 2022 | $0.37 | USD | ≈5.8% |
| พ.ค. 16, 2022 | $0.37 | USD | ≈6.0% |
| ก.พ. 11, 2022 | $0.36 | USD | ≈5.6% |
| พ.ย. 15, 2021 | $0.37 | USD | ≈5.5% |
ประวัติผลประกอบการ EPS จริงเทียบกับประมาณการ, เปอร์เซ็นต์ส่วนต่าง%, อัตราการชนะ, วันประกาศผลประกอบการครั้งถัดไป
| งวด | รายงาน | EPS Actual | EPS คาด | ส่วนต่าง |
|---|---|---|---|---|
| 30 มิถุนายน 2026 | $0.37 | $0.36 | 1.6% | |
| 31 มีนาคม 2026 | $1.13 | $1.11 | 1.9% | |
| 31 ธันวาคม 2025 | $0.94 | $0.95 | -1.2% | |
| 30 กันยายน 2025 | $0.93 | $0.85 | 8.9% | |
| 30 มิถุนายน 2025 | $0.71 | $0.70 | 2.1% | |
| 31 มีนาคม 2025 | $1.02 | $1.02 | -0.41% |
ปัจจัยพื้นฐานฉบับเต็ม ตัวชี้วัดทั้งหมดรายปี — งบกำไรขาดทุน, งบดุล, งบกระแสเงินสด
งบดุล
| ตัวชี้วัด | แนวโน้ม | 2025 |
|---|---|---|
| Cash & Equivalents | $509M | |
| Other Current Assets | $160M | |
| Current Assets | $3.47B | |
| PP&E (Net) | $30.68B | |
| Accum. Depreciation | $10.13B | |
| Other Non-current Assets | $398M | |
| Total Assets | $39.94B | |
| Current Liabilities | $3.55B | |
| Deferred Tax | $3.25B | |
| Other Non-current Liabilities | $392M | |
| Long-term Debt | $18.76B | |
| Common Stock | $3M | |
| Retained Earnings | $2.44B | |
| AOCI | $-36M | |
| Stockholders' Equity | $9.14B | |
| Liabilities + Equity | $39.94B | |
| Shares Outstanding | 306,400,000 |
งบกำไรขาดทุน
| ตัวชี้วัด | แนวโน้ม | Q2 2026 | Q1 2026 | Q2 2025 | Q1 2025 |
|---|---|---|---|---|---|
| Revenue | $1.83B | $2.73B | $1.84B | $2.45B | |
| Operating Expenses | $1.56B | $2.24B | $1.52B | $1.95B | |
| Operating Income | $264M | $490M | $317M | $494M | |
| Other Non-op | $75M | $75M | $137M | $50M | |
| Pretax Income | $129M | $362M | $255M | $358M | |
| Income Tax | $33M | $85M | $62M | $63M | |
| Net Income | $120M | $340M | $201M | $304M | |
| EPS (Basic) | $0.38 | $1.10 | $0.67 | $1.01 | |
| EPS (Diluted) | $0.37 | $1.10 | $0.66 | $1.01 | |
| Shares (Basic) | 310,200,000 | 306,400,000 | 298,500,000 | 298,200,000 | |
| Shares (Diluted) | 310,800,000 | 307,100,000 | 299,100,000 | 299,100,000 | |
| EBITDA | $572M | $902M | · | · |
งบดุล
| ตัวชี้วัด | แนวโน้ม | Q2 2026 | Q1 2026 | Q2 2025 | Q1 2025 |
|---|---|---|---|---|---|
| Cash & Equivalents | $241M | $175M | · | · | |
| Other Current Assets | $243M | $225M | · | · | |
| Current Assets | $2.87B | $3.02B | · | · | |
| PP&E (Net) | $32.33B | $31.53B | · | · | |
| Accum. Depreciation | $10.50B | $10.38B | · | · | |
| Other Non-current Assets | $302M | $341M | · | · | |
| Total Assets | $40.91B | $40.28B | · | · | |
| Current Liabilities | $3.06B | $3.59B | · | · | |
| Deferred Tax | $3.40B | $3.35B | · | · | |
| Other Non-current Liabilities | $444M | $417M | · | · | |
| Long-term Debt | $19.04B | $18.86B | · | · | |
| Total Debt | $19.04B | $18.86B | · | · | |
| Common Stock | $3M | $3M | · | · | |
| Retained Earnings | $2.55B | $2.60B | · | · | |
| AOCI | $-35M | $-35M | · | · | |
| Stockholders' Equity | $9.77B | $9.47B | · | · | |
| Liabilities + Equity | $40.91B | $40.28B | · | · | |
| Shares Outstanding | 313,600,000 | 308,900,000 | · | · |
กระแสเงินสด
| ตัวชี้วัด | แนวโน้ม | Q2 2026 | Q1 2026 | Q2 2025 | Q1 2025 |
|---|---|---|---|---|---|
| D&A | $308M | $412M | $288M | $388M | |
| Other Non-cash | · | $-47M | · | · | |
| Operating Cash Flow | $622M | $705M | · | $1.00B | |
| CapEx | $967M | $1.04B | · | $888M | |
| Investing Cash Flow | $-1.02B | $-1.07B | · | $-918M | |
| Debt Issued | $909M | $258M | · | $1.20B | |
| Net Debt Issued | · | $54M | · | · | |
| Stock Issued | $362M | $166M | · | $3M | |
| Net Stock Activity | · | $166M | · | · | |
| Financing Cash Flow | $480M | $16M | · | $266M | |
| Net Change in Cash | $82M | $-352M | · | $348M | |
| Free Cash Flow | · | $-334M | · | · |
ความสามารถในการทำกำไร
| ตัวชี้วัด | แนวโน้ม | Q2 2026 | Q1 2026 | Q2 2025 | Q1 2025 |
|---|---|---|---|---|---|
| Operating Margin | 14.4% | 17.9% | · | · | |
| Net Margin | 6.6% | 12.4% | · | · | |
| Pretax Margin | 7.0% | 13.3% | · | · | |
| EBITDA Margin | 31.3% | 33.0% | · | · | |
| ROA | 0.31% | 0.89% | · | · | |
| ROE | 1.3% | 3.8% | · | · | |
| ROIC | 0.68% | 1.3% | · | · |
สภาพคล่องและความสามารถในการชำระหนี้
| ตัวชี้วัด | แนวโน้ม | Q2 2026 | Q1 2026 | Q2 2025 | Q1 2025 |
|---|---|---|---|---|---|
| Current Ratio | 0.9 | 0.8 | · | · | |
| Quick Ratio | 0.1 | 0.0 | · | · | |
| Debt / Equity | 1.9 | 2.0 | · | · | |
| LT Debt / Equity | 1.9 | 1.8 | · | · |
ประสิทธิภาพ
| ตัวชี้วัด | แนวโน้ม | Q2 2026 | Q1 2026 | Q2 2025 | Q1 2025 |
|---|---|---|---|---|---|
| Asset Turnover | 0.0 | 0.1 | · | · |
ต่อหุ้น
| ตัวชี้วัด | แนวโน้ม | Q2 2026 | Q1 2026 | Q2 2025 | Q1 2025 |
|---|---|---|---|---|---|
| Book Value / Share | $31.17 | $30.64 | · | · | |
| Revenue / Share | $5.88 | $8.89 | · | · | |
| Cash Flow / Share | · | $2.30 | · | · | |
| Cash / Share | $0.77 | $0.57 | · | · | |
| Dividend / Share | $0.57 | $0.57 | $0.54 | $0.54 | |
| EPS (TTM) | $3.33 | $3.62 | $3.39 | $3.38 |
การประเมินมูลค่า (TTM)
| ตัวชี้วัด | แนวโน้ม | Q2 2026 | Q1 2026 | Q2 2025 | Q1 2025 |
|---|---|---|---|---|---|
| Revenue TTM | $8.81B | $8.82B | $8.02B | $7.79B | |
| Net Income TTM | $1.03B | $1.11B | $1.02B | $1.02B | |
| Market Cap | $6.87B | $6.83B | · | · | |
| Enterprise Value | $25.66B | $25.51B | · | · | |
| P/E | 6.6 | 6.1 | 6.5 | 6.7 | |
| P/S | 0.8 | 0.8 | 0.8 | 0.9 | |
| P/B | 0.7 | 0.7 | · | · | |
| P / Tangible Book | 0.7 | 0.7 | · | · | |
| P / Cash Flow | · | 9.7 | · | · | |
| EV / Revenue | 2.9 | 2.9 | 3.0 | 3.0 | |
| Earnings Yield | 15.2% | 16.4% | 15.3% | 14.8% |
ช่วงเวลาล่าสุดอยู่ทางซ้าย · ค่า null แสดงเป็น ·
งบการเงิน งบกำไรขาดทุน, งบดุล, งบกระแสเงินสด — รายปี, 5 ปีล่าสุด
ยังไม่มีข้อมูลพื้นฐานเพียงพอที่จะสร้างงบการเงินนี้
ยังไม่มีข้อมูลพื้นฐานเพียงพอที่จะสร้างงบการเงินนี้
ยังไม่มีข้อมูลพื้นฐานเพียงพอที่จะสร้างงบการเงินนี้
ผู้ถือครองสถาบัน (13F) 2 รายงาน · $20K ทั้งหมด · ณ วันที่ 30 มิถุนายน 2026
สถาบันที่รายงานการถือครองหุ้นนี้ในเอกสาร SEC Form 13F รายไตรมาสของตน เฉพาะสถานะ Long; ผู้ยื่นคำร้องรายเดียวอาจปรากฏสองครั้งสำหรับสัญญาออปชันที่แยกจากกัน ขา put/call ขนาดใหญ่ที่หักล้างกันมักสะท้อนถึงการทำตลาด (market-making) หรือสินค้าคงคลังที่มีการป้องกันความเสี่ยง (hedged inventory) ไม่ใช่การเชื่อมั่นในทิศทาง
| พอร์ตใหม่ | ตำแหน่งที่ปิดไปแล้ว | เพิ่มขึ้น | ลดลง | การเปลี่ยนแปลงสุทธิของจำนวนหุ้น |
|---|---|---|---|---|
| 0 (-1 เทียบกับไตรมาสก่อน) | 0 (-1 เทียบกับไตรมาสก่อน) | 1 (+1 เทียบกับไตรมาสก่อน) | 1 (+1 เทียบกับไตรมาสก่อน) | +478 |
เปรียบเทียบกับ Q1 2026. การยื่นแบบฟอร์ม 13F ของ SEC จะครบกำหนดภายใน 45 วันนับจากสิ้นสุดไตรมาส บวกกับระยะเวลาผ่อนผันสั้นๆ สำหรับผู้ยื่นล่าช้า — ไตรมาสที่ยังอยู่ในช่วงเวลานี้จะถูกข้ามไปเพื่อใช้คู่ที่รายงานล่าสุดอย่างสมบูรณ์
| สถาบัน | มูลค่า | หุ้น | % ของ 13F ที่ติดตาม | ประเภท |
|---|---|---|---|---|
| First Command Advisory Services, Inc. | $16,075 | 734 | 81.20% | หุ้น |
| PNC Financial Services Group, Inc. | $3,723 | 170 | 18.80% | หุ้น |
ผู้บริหารบริษัท 1 รายชื่อผู้บริหาร · ผู้บริหาร 1 คน · กรรมการ 0 คน
| ผู้บริหารภายใน | บทบาท | กิจกรรมล่าสุด | หุ้นที่ถือครอง | ซื้อ 12 เดือน | ขาย 12 เดือน | สุทธิ 12 เดือน |
|---|---|---|---|---|---|---|
| Srikanth Maddipati | EVP/CFO | 31 กรกฎาคม 2026 P | 34,895 | 1 | 0 | $14,492 |
ผู้บริหารจากเอกสาร SEC Form 3/4/5; สุทธิ = เฉพาะการซื้อขายในตลาดเปิด
การถือครอง ETF ถือโดย ETF 1 ราย
น้ำหนักสะท้อนถึงการถือครองหุ้นโดยตรง (N-PORT) เท่านั้น กองทุนเลเวอเรจหรือกองทุนที่อิงตราสารอนุพันธ์อาจมีการเปิดรับความเสี่ยงจากสัญญาแลกเปลี่ยน (swap) เพิ่มเติมซึ่งไม่แสดง
| กองทุน | น้ำหนัก | หน่วย | ณ วันที่ | แหล่งที่มา |
|---|---|---|---|---|
| FPE · First Trust Exchange-Traded Fund III | 0.25% | 705,428 NS | 31 กรกฎาคม 2026 | N-PORT |
CMSD ความเห็นหลายต่อหลายของนักวิเคราะห์ มุมมองนักวิเคราะห์ทั้งเชิงบวกและเชิงลบ, ราคาเป้าหมาย 12 เดือน, อัพไซด์
การเปรียบเทียบกับบริษัทคู่เทียบ (อุตสาหกรรมย่อย GICS) เมตริกสำคัญเทียบกับบริษัทในกลุ่มอุตสาหกรรมเดียวกัน
ตามปีงบประมาณ ราคา ณ ราคาปิดสิ้นสุดปีงบประมาณล่าสุดของแต่ละบริษัท
| Ticker | มูลค่าตลาด | P/E | รายได้ YoY | อัตรากำไรสุทธิ | ROE | อัตรากำไรขั้นต้น |
|---|---|---|---|---|---|---|
| CMSD | · | · | · | · | · | · |
| WEC | $34.32B | 21.9 | 14.0% | 15.9% | 11.2% | · |
| PEG | $39.99B | 19.0 | 18.2% | 17.3% | 12.6% | · |
| AEE | $27.60B | 18.7 | 15.4% | 16.6% | 11.5% | · |
| DTE | · | · | · | · | · | · |
| CNP | $25.03B | 24.0 | 8.3% | 11.2% | 9.5% | · |
| CMS | $21.43B | 19.8 | 13.6% | 12.5% | 12.3% | · |
| NI | $19.98B | 21.4 | 23.5% | 14.2% | 10.2% | · |
| BKH | $5.24B | 17.4 | 8.6% | 12.6% | 8.0% | · |
| NWE | $3.96B | 22.0 | 6.4% | 11.2% | 6.3% | · |
| NWE | $3.96B | 22.0 | 6.4% | 11.2% | 6.3% | · |
ตัวชี้วัดของฉัน รายการเฝ้าดูส่วนตัวของคุณ — แถวที่เลือกจากข้อมูลพื้นฐานฉบับเต็ม
เลือกตัวชี้วัดที่สำคัญสำหรับคุณ — คลิกเครื่องหมาย + ถัดจากแถวใดก็ได้ใน Fundamentals ฉบับเต็มด้านบน
การเลือกของคุณถูกบันทึกและจะติดตามคุณไปในทุกสัญลักษณ์หุ้น