HON Honeywell International Inc. - Common Stock

NASDAQ · Industrial Conglomerates · ดูใน SEC EDGAR ↗
$219.58
ราคา · ส.ค. 21, 2026
ข้อมูลพื้นฐาน ณ วันที่ ก.ค. 24, 2026

เกี่ยวกับ Honeywell International Inc. - Common Stock ภาพรวมบริษัทจาก Wikipedia

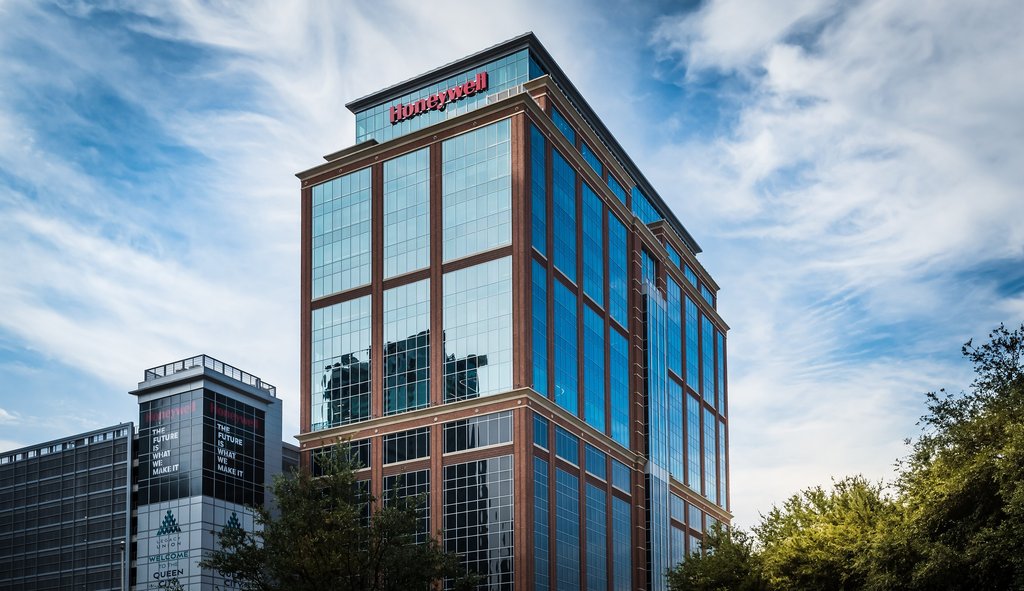
Honeywell International Inc. is an American publicly traded, multinational conglomerate corporation headquartered in Charlotte, North Carolina. It primarily operates in three areas of business: building automation, industrial automation, and energy and sustainability solutions (ESS). Honeywell also operates Sandia National Laboratories under contract with the U.S. Department of Energy. Honeywell is a Fortune 500 company, ranked 115th in 2023. In 2025, the corporation had a global workforce of approximately 101,000 employees. As of 2025, its chairman and chief executive officer was Vimal Kapur.

อ่านเพิ่มเติม

Honeywell International Inc. is an American publicly traded, multinational conglomerate corporation headquartered in Charlotte, North Carolina. It primarily operates in three areas of business: building automation, industrial automation, and energy and sustainability solutions (ESS). Honeywell also operates Sandia National Laboratories under contract with the U.S. Department of Energy. Honeywell is a Fortune 500 company, ranked 115th in 2023. In 2025, the corporation had a global workforce of approximately 101,000 employees. As of 2025, its chairman and chief executive officer was Vimal Kapur.

The corporation's name, Honeywell International Inc., is a product of the merger of Honeywell Inc. and AlliedSignal in 1999. The corporation headquarters were consolidated with AlliedSignal's headquarters in Morristown, New Jersey. The combined company chose the name "Honeywell" because of the considerable brand recognition. Honeywell was a component of the Dow Jones Industrial Average index from 1999 to 2008. Prior to 1999, its corporate predecessors were included dating back to 1925, including early entrants in the computing and thermostat industries.

In 2020, Honeywell rejoined the Dow Jones Industrial Average index. In 2021, it moved its stock listing from the New York Stock Exchange to the Nasdaq.

In 2025, Honeywell announced it would split into three companies: Honeywell Technologies, Honeywell Aerospace, and Solstice Advanced Materials. It has been estimated that the aerospace and automation businesses could be worth as much as $104 billion and $94 billion, respectively, after the split.

History

The Butz Thermo-Electric Regulator Company was founded in 1885 when the Swiss-born Albert Butz invented the damper-flapper, a thermostat used to control coal furnaces, bringing automated heating system regulation into homes. In 1888, after a falling out with his investors, Butz left the company and transferred the patents to the legal firm Paul, Sanford, and Merwin, who renamed the company the Consolidated Temperature Controlling Company.

As the years passed, CTCC struggled with debt and the company underwent several name changes. After it was renamed the Electric Heat Regulator Company in 1893, W. R. Sweatt, a stockholder in the company, was sold "an extensive list of patents" and named secretary-treasurer. By 1900, Sweatt had bought out the remaining shares of the company from the other stockholders.

1906 Honeywell Heating Specialty Company founded

In 1906, Mark Honeywell founded the Honeywell Heating Specialty Company in Wabash, Indiana, to manufacture and market his invention, the mercury seal generator.

1922–1934 Mergers and acquisitions

As Honeywell's company grew, thanks in part to the acquisition of Jewell Manufacturing Company in 1922 to better automate his heating system, it began to clash with the Electric Heat Regulator Company now-renamed Minneapolis Heat Regulator Company. In 1927, this led to the merging of both companies into the publicly held Minneapolis-Honeywell Regulator Company. Honeywell was named the company's first president, alongside W.R. Sweatt as its first chairman.

In 1929, combined assets were valued at over $3.5 million, with less than $1 million in liabilities just months before Black Monday. In 1931, Minneapolis-Honeywell began a period of expansion and acquisition when it purchased the Time-O-Stat Controls Company, giving the company access to a greater number of patents for its controls systems.

W.R. Sweatt and his son Harold provided 75 years of uninterrupted leadership for the company. W.R. Sweatt faced hardship and turned an innovative idea – thermostatic heating control – into a successful business.

1934–1941 International growth

Harold took over in 1934, leading Honeywell through a period of growth and global expansion that set the stage for Honeywell to become a global technology leader. The merger into the Minneapolis-Honeywell Regulator Company proved to be a saving grace for the corporation.

1934 marked Minneapolis-Honeywell's first foray into the international market, when it acquired the Brown Instrument Company and inherited its relationship with the Yamatake Company of Tokyo, a Japan-based distributor. Later in 1934, Minneapolis-Honeywell started distributorships across Canada, as well as one in the Netherlands, its first European office. This expansion into international markets continued in 1936, with its first distributorship in London, as well as its first foreign assembly facility being established in Canada. By 1937, ten years after the merger, Minneapolis-Honeywell had over 3,000 employees, with $16 million in annual revenue.

World War II

With the outbreak of World War II, Minneapolis-Honeywell was approached by the US military for engineering and manufacturing projects. In 1941, Minneapolis-Honeywell developed a superior tank periscope, camera stabilizers, and the C-1 autopilot.

The C-1 revolutionized precision bombing and was ultimately used on the two B-29 bombers that dropped atomic bombs on Japan in 1945. The success of these projects led Minneapolis-Honeywell to open an Aero division in Chicago on October 5, 1942. This division was responsible for the development of the formation stick to control autopilots, more accurate fuel quantity indicators for aircraft, and the turbo supercharger.

In 1950, Minneapolis-Honeywell's Aero division was contracted for the controls on the first US nuclear submarine, USS Nautilus. In 1951, the company acquired Intervox Company for their sonar, ultrasonic, and telemetry technologies. Honeywell also helped develop and manufacture the RUR-5 ASROC for the US Navy.

1950–1970s

In 1953, in cooperation with the USAF Wright-Air Development Center, Honeywell developed an automated control unit, that could control an aircraft through various stages of a flight, from taxiing to takeoff to the point where the aircraft neared its destination and the pilot took over for landing. Called the Automatic Master Sequence Selector, the onboard control operated similarly to a player piano to relay instructions to the aircraft's autopilot at certain way points during the flight, significantly reducing the pilot's workload. Technologically, this effort had parallels to contemporary efforts in missile guidance and numerical control. Honeywell also developed the Wagtail missile with the USAF.

From the 1950s until the mid-1970s, Honeywell was the United States' importer of Japanese company Asahi Optical's Pentax cameras and photographic equipment. These products were labeled "Heiland Pentax" and "Honeywell Pentax" in the U.S. In 1953, Honeywell introduced its most famous product, the T-86 Round thermostat.

In 1961, James H. Binger became Honeywell's president and in 1965 its chairman. Binger revamped the company sales approach, placing emphasis on profits rather than on volume. He stepped up the company's international expansion – it had six plants producing 12% of the company's revenue. He officially changed the company's corporate name from "Minneapolis-Honeywell Regulator Co." to "Honeywell", to better represent their colloquial name. Throughout the 1960s, Honeywell continued to acquire other businesses, including Security Burglar Alarm Company in 1969.

In the 1970s, after one member of a group called FREE on the Minneapolis campus (U of M) of the University of Minnesota asked five major companies with local offices to explain their attitudes toward gay men and women, three responded quickly, insisting that they did not discriminate against gay people in their hiring policies. Only Honeywell objected to hiring gay people. Later in the 1970s, when faced with a denial of access to students, Honeywell "quietly [reversed] its hiring policy".

The beginning of the 1970s saw Honeywell focus on process controls, with Honeywell merging its computer operations with GE's information systems in 1970, and later acquiring GE's process control business. With the acquisition, Honeywell took over responsibility for GE's ongoing Multics operating system project. The design and features of Multics greatly influenced the Unix operating system. Multics influenced many of the features of Honeywell/GE's GECOS and GCOS8 General Comprehensive Operating System operating systems. Honeywell, Groupe Bull, and Control Data Corporation formed a joint venture in Magnetic Peripherals Inc. which became a major player in the hard disk drive market.

Honeywell was the worldwide leader in 14-inch disk drive technology in the OEM marketplace in the 1970s and early 1980s, especially with its SMD (Storage Module Drive) and CMD (Cartridge Module Drive). In the second half of the 1970s, Honeywell started to look to international markets again, acquiring the French Compagnie Internationale pour l’Informatique in 1976. In 1984, Honeywell formed Honeywell High Tech Trading to lease their foreign marketing and distribution to other companies abroad, in order to establish a better position in those markets. Under Binger's stewardship from 1961 to 1978 he expanded the company into such fields as defense, aerospace, and computing.

During and after the Vietnam Era, Honeywell's defense division produced a number of products, including cluster bombs, missile guidance systems, napalm, and land mines. Minnesota-Honeywell Corporation completed flight tests on an inertia guidance sub-system for the X-20 project at Eglin Air Force Base, Florida, utilizing an NF-101B Voodoo by August 1963. The X-20 project was canceled in December 1963. The Honeywell Project, founded in 1968, organized protests against the company to persuade it to abandon weapons production

In 1980, Honeywell bought Incoterm Corporation to compete in both the airline reservations system networks and bank teller markets.

Honeywell Information Systems

In April 1955, Minneapolis-Honeywell started a joint venture with Raytheon called Datamatic to enter the computer market and compete with IBM. In 1957, its first computer, the DATAmatic 1000, was sold and installed. By the release of the DATAmatic 1000, however, Minneapolis-Honeywell bought Raytheon's interest in Datamatic and turned it into the Electronic Data Processing division, later Honeywell Information Systems (HIS) of Minneapolis-Honeywell.

Honeywell purchased minicomputer pioneer Computer Control Corporation (3C's) in 1966, renaming it as Honeywell's Computer Control Division. Through most of the 1960s, Honeywell was one of the "Snow White and the Seven Dwarfs" of computing. IBM was "Snow White", while the dwarfs were the seven significantly smaller computer companies: Burroughs, Control Data Corporation, General Electric, Honeywell, NCR, RCA, and UNIVAC. Later, when their number had been reduced to five, they were known as "The BUNCH", after their initials: Burroughs, UNIVAC, NCR, Control Data Corporation, and Honeywell.

In 1970, Honeywell acquired GE's computer business, rebadging General Electric's 600-series mainframes to Honeywell 6000 series computers, supporting GCOS, Multics, and CP-6, while forming Honeywell Information Systems. In 1973, it shipped a high speed non-impact printer called the Honeywell Page Printing System.

From 1974 to 1987, under the leadership of CEO Edson W. Spencer, the company began a shift away from computers and focused instead on aeronautics and industrial technology.

In 1975, it purchased Xerox Data Systems, whose Sigma computers had a small but loyal customer base. Some of Honeywell's systems were minicomputers, such as their Series 60 Model 6 and Model 62 and their Honeywell 200. The latter was an attempt to penetrate the IBM 1401 market. In 1987, HIS merged with Groupe Bull, a global joint venture with Compagnie des Machines Bull of France and NEC Corporation of Japan to become Honeywell Bull. In 1988 Honeywell Bull was consolidated into Groupe Bull and in 1989 renamed to Bull, a Worldwide Information Systems Company. By 1991, Honeywell was no longer involved in the computer business.

1985–1999 integrations

Aerospace and defense

1986 marked a new direction for Honeywell, beginning with the acquisition of the Sperry Aerospace Group from the Unisys Corporation. In 1990, Honeywell spun off its Defense and Marine Systems business into Alliant Techsystems, as well as their Test Instruments division and Signal Analysis Center to streamline the company's focus. Honeywell continues to supply aerospace products including electronic guidance systems, cockpit instrumentation, lighting, and primary propulsion and secondary power turbine engines. In 1996, Honeywell acquired Duracraft and began marketing its products in the home comfort sector.

Honeywell is in the consortium that runs the Pantex Plant that assembles all of the nuclear bombs in the United States arsenal. Honeywell Federal Manufacturing & Technologies, successor to the defense products of AlliedSignal, operates the Kansas City Plant which produces and assembles 85 percent of the non-nuclear components of the bombs.

Home and building controls

Honeywell began the SmartHouse project, to combine heating, cooling, security, lighting, and appliances into one easily controlled system. They continued the trend in 1987 by releasing new security systems, and fire and radon detectors. In 1992, in another streamlining effort, Honeywell combined its Residential Controls, Commercial Systems, and Protections Services divisions into Home and Building Control, which then acquired the Enviracare air cleaner business. By 1995, Honeywell had condensed into three divisions: Space and Aviation Control, Home and Building Control, and Industrial Control.

Industrial control

Honeywell dissolved its partnership with Yamatake Company and consolidated its Process Control Products Division, Process Management System Division, and Micro Switch Division into one Industrial Control Group in 1998. It has further acquired Measurex System and Leeds & Northrup to strengthen its portfolio in 1997.

1999–2002 merger, takeovers

AlliedSignal and Pittway

On June 7, 1999, Honeywell was acquired by AlliedSignal, who elected to retain the Honeywell name for its brand recognition. The former Honeywell moved their headquarters of 114 years to AlliedSignal's in Morristown, New Jersey. While "technically, the deal looks more like an acquisition than a merger...from a strategic standpoint, it is a merger of equals." AlliedSignal's 1998 revenue was reported at $15.1 billion to Honeywell's $8.4 billion, but together the companies share huge business interests in aerospace, chemical products, automotive parts, and building controls.

The corporate headquarters were consolidated to AlliedSignal's headquarters in Morristown, New Jersey, rather than Honeywell's former headquarters in Minneapolis, Minnesota. When Honeywell closed its corporate headquarters in Minneapolis, over one thousand employees lost their jobs. A few moved to Morristown or other company locations, but the majority were forced to find new jobs or retire. Soon after the merger, the company's stock fell significantly, and did not return to its pre-merger level until 2007.

In 2000, the new Honeywell acquired Pittway for $2.2 billion to gain a greater share of the fire-protection and security systems market, and merged it into their Home and Building Control division, taking on Pittway's $167 million in debt. Analyst David Jarrett commented that "while Honeywell offered a hefty premium, it's still getting Pittway for a bargain" at $45.50 per share, despite closing at $29 the week before. Pittway's Ademco products complemented Honeywell's existing unified controls systems.

General Electric Company

In October 2000, Honeywell, then valued at over $21 billion, accepted a takeover bid from then-CEO Jack Welch of General Electric. The American Department of Justice cleared the merger, while "GE teams swooped down on Honeywell" and "GE executives took over budget planning and employee reviews." However, on July 3, 2001, the European Commission's competition commissioner, Mario Monti, blocked the move. This decision was taken on the grounds that with GE's dominance of the large jet engine market, led by the General Electric CF34 turbofan engine, its leasing services (GECAS), and Honeywell's portfolio of regional jet engines and avionics, the new company would be able to "bundle" products and stifle competition through the creation of a horizontal monopoly.

US regulators disagreed, finding that the merger would improve competition and reduce prices; United States Assistant Attorney General Charles James called the EU's decision "antithetical to the goals of antitrust law enforcement." This led to a drop in morale and general tumult throughout Honeywell. The then-CEO Michael Bonsignore was fired as Honeywell looked to turn its business around.

2002–2014 acquisitions and further expansion

In January 2002, Knorr-Bremse —who had been operating in a joint venture with Honeywell International Inc. —assumed full ownership of its ventures in Europe, Brazil, and the USA. Bendix Commercial Vehicle Systems became a subsidiary of Knorr-Bremse AG.

In February 2002, Honeywell's board appointed its next CEO and chairman, David M. Cote. Since 2002, Honeywell has made more than 80 acquisitions and 60 divestitures, and increasing its labor force to 131,000 as a result of these acquisitions. Honeywell's stock nearly tripled from $35.23 in April 2002 to $99.39 in January 2015.

Honeywell made a £1.2bn ($2.3bn) bid for Novar plc in December 2004. The acquisition was finalized in March 2005. In October 2005, Honeywell bought out Dow's 50% stake in UOP for $825 million, giving them complete control over the joint venture in petrochemical and refining technology. In May 2010, Honeywell outbid UK-based Cinven and acquired the French company Sperian Protection for $1.4 billion, which was then incorporated into its automation and controls safety unit.

2015–present

In 2015, the headquarters were moved to Morris Plains, New Jersey. The headquarters in Morris Plains included a 475,000-square-foot building on 40 acres.

In December 2015, Honeywell acquired Elster for US$5.1B, entering the space of gas, electricity, and water meters with a specific focus on smart meters. Honeywell International Inc. then acquired the 30% stake in UOP Russell LLC it didn't own already for roughly $240 million in January 2016.

In April 2016, Honeywell acquired Xtralis, a provider of aspirating smoke detection, perimeter security technologies, and video analytics software, for $480 million, from funds advised by Pacific Equity Partners and Blum Capital Partners. In May 2016, Honeywell International Inc. settled its patent dispute regarding Google subsidiary Nest Labs, whose thermostats Honeywell claimed infringed on several of its patents. Google parent Alphabet Inc. and Honeywell said it reached a "patent cross-license" agreement that "fully resolves" the long-standing dispute. Honeywell sued Nest Labs in 2012. In 2017, Honeywell opened a new software center in Atlanta, Georgia.

David Cote stepped down as CEO on April 1, 2017, and was succeeded by Darius Adamczyk, who had been promoted to president and chief operating officer (COO) in 2016. Cote served as executive chairman until April 2018. In October 2017, Honeywell announced plans to spin off its Homes, ADI Global Distribution, and Transportation Systems businesses into two separate, publicly traded companies by the end of 2018.

In 2018, Honeywell spun off both Honeywell Turbo Technologies, now Garrett Advancing Motion, and its consumer products business, Resideo. Both companies are publicly traded on the New York Stock Exchange. For the fiscal year 2019, Honeywell reported net income of US$6.230 billion, with an annual revenue of US$36.709 billion, a decrease of 19.11% over the previous fiscal cycle. Honeywell's market capitalization was valued at over US$113.25 billion in September 2020.

Honeywell relocated its corporate headquarters in October 2019 to Charlotte, North Carolina. In July 2019, Honeywell moved employees into a temporary headquarters building in Charlotte before their new building was complete.

In 2020, Honeywell Forge launched as an analytics platform software for industrial and commercial applications such as aircraft, building, industrial, worker and cyber-security. In collaboration with Carnegie Mellon University National Robotics Engineering Center, the Honeywell Robotics was created in Pittsburgh to focus on supply chain transformation. The Honeywell robotic unloader grabs packages in tractor-trailers then places them on conveyor belts for handlers to sort.

In May 2019, GoDirect Trade launched as an online marketplace for surplus aircraft parts such as engines, electronics, and APU parts. In March 2020, Honeywell announced that its quantum computer is based on trapped ions. Its expected quantum volume is at least 64, which Honeywell's CEO called the world's most powerful quantum computer. In November 2021, Honeywell announced the spinoff of its quantum division into a separate company named "Quantinuum".

In March 2023, Honeywell announced Vimal Kapur as its next CEO, effective June 1, 2023. In December 2023, Honeywell agreed to acquire Carrier Global's security business for approximately $5 billion.

In February 2024, Honeywell filed a lawsuit against Lone Star Aerospace, Inc., alleging that their software products infringe on five patents.

On October 1, 2024, Honeywell partnered with Google to integrate data with generative AI with an aim to streamline autonomous operations for its customers.

On October 8, 2024, it was announced that the company's advanced materials division would be spun-off into a new company.

On February 6, 2025, it was announced that Honeywell would be spun-off into three independent companies after activist investor Elliott Investment Management who is in favor of the split took a major stake in the company. With its aerospace, automation, and previously announced advanced materials segments being split into separate companies.

On May 22, 2025, the company announced it was acquiring Johnson Matthey's Catalyst Technologies arm for £1.8 billion.

COVID-19 pandemic

In response to the COVID-19 pandemic, Honeywell converted some of its manufacturing facilities in Rhode Island, Arizona, Michigan and Germany to produce supplies of personal protective equipment for healthcare workers. In April 2020, Honeywell began production of N95 masks at the company's factories in Smithfield and Phoenix, aiming to produce 20 million masks a month. Honeywell's facilities in Muskegon and Germany were converted to produce hand sanitiser for government agencies.

Several state governments contracted Honeywell to produce N95 particulate-filtering face masks during the pandemic. The North Carolina Task Force for Emergency Repurposing of Manufacturing (TFERM) awarded Honeywell a contract for the monthly delivery of 100,000 N95 masks. In April 2020, Los Angeles Mayor Eric Garcetti announced a deal with Honeywell to produce 24 million N95 masks to distribute to healthcare workers and first responders.

In May 2020, United States President Donald Trump visited the Honeywell Aerospace Technologies facility in Phoenix, where he acknowledged the "incredibly patriotic and hard-working men and women of Honeywell" for making N95 masks and referred to the company's production as a "miraculous achievement".

In April 2021, Will.i.am and Honeywell collaborated on Xupermask, a mask made of silicon and athletic mesh fabric that has LED lights, 3-speed fans and noise-canceling headphones in the mask.

In November 2024, Honeywell announced its intention to sell its personal protective equipment business to Protective Industrial Products for almost $1.33 billion in cash. The sale of this PPE business is expected to close by the first half of 2025.

After the divestment of PPE business, the company is planning to retain its gas detection portfolio.

Business groups

The company operates four business groups – Honeywell Aerospace Technologies, Building Automation, Safety and Productivity Solutions (SPS), and Performance Materials and Technologies (PMT). Business units within the company are as follows:

Honeywell Aerospace Technologies provides avionics, aircraft engines, flight management systems, and service solutions to manufacturers, airlines, airport operations, militaries, and space programs. It comprises Commercial Aviation, Defense & Space, and Business & General Aviation. In January 2014, Honeywell Aerospace Technologies launched its SmartPath Precision Landing System at Malaga-Costa del Sol Airport in Spain, which augments GPS signals to make them suitable for precision approach and landing, before broadcasting the data to approaching aircraft.

In July 2014, Honeywell's Transportation Systems merged with the Aerospace division due to similarities between the businesses. In April 2018, Honeywell announced to develop laser communication products for satellite communication in collaboration with Ball Aerospace and plans future volume production. In June 2018 Honeywell spun off and rebranded its Transportation Systems as Garrett.

Building Automation and Honeywell Safety and Productivity Solutions were created when Automation and Control Solutions was split into two in July 2016. Building Automation comprises Honeywell Building Solutions, Environmental and Energy Solutions, and Honeywell Security and Fire. In December 2017, Honeywell announced that it had acquired SCAME, an Italy-based company, to add new fire and gas safety capabilities to its portfolio. Honeywell Safety and Productivity Solutions comprises Scanning & Mobility, Sensing and Internet of Things, and Industrial safety.

Honeywell Performance Materials and Technologies comprises six business units: Honeywell UOP, Honeywell Process Solutions, Fluorine Products, Electronic Materials, Resins & Chemicals, and Specialty Materials. Products include process technology for oil and gas processing, fuels, films and additives, special chemicals, electronic materials, and renewable transport fuels.

Corporate governance

Honeywell's current chief executive officer is Vimal Kapur. As of June 2023, the members of the board are:

Acquisitions since 2002

Honeywell's acquisitions have consisted largely of businesses aligned with the company's existing technologies. The acquired companies are integrated into one of Honeywell's five business groups (Aerospace Technologies (AT), Building Automation (BA), Safety and Productivity Solutions (SPS), Energy and Sustainability Solutions (ESS), or Performance Materials and Technologies (PMT)) but retain their original brand name.

Environmental issues

The United States Environmental Protection Agency states that no corporation has been linked to a greater number of Superfund toxic waste sites than Honeywell. In 2007, Honeywell ranked 44th in a list of US corporations most responsible for air pollution, releasing more than 4.25 million kg (9.4 million pounds) of toxins per year into the air. In 2001, Honeywell agreed to pay $150,000 in civil penalties and to perform $772,000 worth of reparations for environmental violations involving:

failure to prevent or repair leaks of hazardous organic pollutants into the air

failure to repair or report refrigeration equipment containing chlorofluorocarbons

inadequate reporting of benzene, ammonia, nitrogen oxide, dichlorodifluoromethane, sulfuric acid, sulfur dioxide, and caprolactam emissions

In 2003, a federal judge in Newark, New Jersey, ordered the company to perform an estimated $400 million environmental remediation of chromium waste, citing "a substantial risk of imminent damage to public health and safety and imminent and severe damage to the environment." In 2003, Honeywell paid $3.6 million to avoid a federal trial regarding its responsibility for trichloroethylene contamination in Lisle, Illinois. In 2004, the State of New York announced that it would require Honeywell to complete an estimated $448 million cleanup of more than 74,000 kg (165,000 lbs) of mercury and other toxic waste dumped into Onondaga Lake in Syracuse, New York, from a former Allied Chemical property.

Honeywell established three water treatment plants by November 2014. The chemicals cleanup site removed 7 tons of mercury. In November 2015, Audubon New York gave the Thomas W. Keesee Jr. Conservation Award to Honeywell for its cleanup efforts in “one of the most ambitious environmental reclamation projects in the United States.” By December 2017, Honeywell completed dredging the lake. Later in December, the Department of Justice filed a settlement requiring Honeywell to pay a separate $9.5 million in damages, as well build 20 restoration projects on the shore to help repair the greater area surrounding the lake.

In 2005, the state of New Jersey sued Honeywell, Occidental Petroleum, and PPG to compel cleanup of more than 100 sites contaminated with chromium, a metal linked to lung cancer, ulcers, and dermatitis. In 2008, the state of Arizona made a settlement with Honeywell to pay a $5 million fine and contribute $1 million to a local air-quality cleanup project, after allegations of breaking water-quality and hazardous-waste laws on hundreds of occasions between 1974 and 2004.

In 2006, Honeywell announced that its decision to stop manufacturing mercury switches had resulted in reductions of more than 11,300 kg (24,900 lb) of mercury, 2,800 kg (6,200 lb) of lead, and 1,500 kg (3,300 lb) of chromic acid use. The largest reduction represents 5% of mercury use in the United States. For this, Honeywell received the EPA's 2006 National Partnership for Environmental Priorities (NPEP) Achievement Award, recognizing Honeywell's leadership in reducing mercury use.

Leadership

Presidents and chairmen of the company have been:

President

Mark Charles Honeywell, 1927–1934

Harold Wilson Sweatt, 1934–1952

Paul Barclay Wishart, 1952–1960

James Henry Binger, 1960–1965

Stephen Flaherty Keating, 1965–1974

Edson White Spencer, 1974–1978

James Joseph Renier, 1986–1988

David Larry Moore, 1993–1997

Giannantonio Ferrari, 1997–2000

Robert D. Johnson, 1999–2000

Darius Adamczyk, 2016–2018

Vimal Kapur, 2022–2024

Chairman of the Board

Mark Charles Honeywell, 1934–1954

Harold Wilson Sweatt, 1954–1965

James Henry Binger, 1965–1975

Stephen Flaherty Keating, 1975–1978

Edson White Spencer, 1978–1988

James Joseph Renier, 1988–1993

Michael Robert Bonsignore, 1993–2000

Lawrence Arthur Bossidy, 2000–2002

David M. Cote, 2002–2018

Darius Adamczyk, 2018–2024

Vimal Kapur, 2024–present

แหล่งที่มา: Wikipedia (ภาษาอังกฤษ), CC BY-SA 4.0 · ดูบน Wikipedia ↗

Wikidata ↗

HON ภาพรวมหุ้น ราคา, มูลค่าหลักทรัพย์ตามราคาตลาด, P/E, EPS, ROE, อัตราส่วนหนี้สินต่อทุน, ช่วงราคา 52 สัปดาห์

ราคา
$219.57
มูลค่าตลาด
$139.50B
P/E (TTM)
29.8
EPS (TTM)
$7.36
รายได้ (TTM)
$37.44B
อัตราเงินปันผล
2.1%
ROE
29.1%
D/E หนี้สิน/ทุน
0.4
ช่วง 52 สัปดาห์
$187 – $452

HON กราฟราคาหุ้น OHLCV รายวันพร้อมตัวชี้วัดทางเทคนิค — แพน ซูม และปรับแต่งมุมมองของคุณ

ผลการดำเนินงาน 10 ปี แนวโน้มรายได้ กำไรสุทธิ อัตรากำไร และ EPS

รายได้และกำไรสุทธิ $37.44B
10-point trend, -4.7%
2016-12-31 2025-12-31
EPS $7.36
10-point trend, +18.5%
2016-12-31 2025-12-31
กระแสเงินสดอิสระ $5.42B
10-point trend, +23.1%
2016-12-31 2025-12-31
อัตรากำไร 12.6%
5-point trend, +3.7%
2016-12-31 2020-12-31

การประเมินมูลค่า อัตราส่วน P/E, P/S, P/B, EV/EBITDA — หุ้นมีราคาแพงหรือถูก?

ตัวชี้วัด
แนวโน้ม 5 ปี
HON
ค่ามัธยฐานของกลุ่มอุตสาหกรรม
P/E (TTM)
2-point trend, +8.4%
29.8
23.2
P/S (TTM)
2-point trend, -16.9%
3.7
1.9
P/B
2-point trend, +20.0%
10.0
8.0
EV / EBITDA
2-point trend, -6.4%
13.9
Price / FCF (ราคาต่อกระแสเงินสดอิสระ)
2-point trend, -18.5%
25.7

ความสามารถในการทำกำไร อัตรากำไรขั้นต้น, อัตรากำไรจากการดำเนินงาน และอัตรากำไรสุทธิ; ROE, ROA, ROIC

ตัวชี้วัด
แนวโน้ม 5 ปี
HON
ค่ามัธยฐานของกลุ่มอุตสาหกรรม
Operating Margin (อัตรากำไรจากการดำเนินงาน)
2-point trend, -3.9%
21.7%
Net Profit Margin (อัตรากำไรสุทธิ)
5-point trend, -21.6%
12.6%
11.4%
ROA
5-point trend, -26.1%
6.3%
5.9%
ROE
5-point trend, -5.2%
29.1%
29.1%
ROIC
2-point trend, +10.8%
33.5%

สุขภาพทางการเงิน หนี้สิน, สภาพคล่อง, ความสามารถในการชำระหนี้ — ความแข็งแกร่งของงบดุล

ตัวชี้วัด
แนวโน้ม 5 ปี
HON
ค่ามัธยฐานของกลุ่มอุตสาหกรรม
Debt / Equity (หนี้สินต่อทุน)
5-point trend, +122.2%
0.4
Current Ratio (อัตราส่วนสภาพคล่อง)
5-point trend, -0.2%
1.3
1.4
Quick Ratio (อัตราส่วนเงินสด)
5-point trend, -6.7%
0.9

การเติบโต การเติบโตของรายได้, EPS และกำไรสุทธิ: YoY, CAGR 3 ปี, CAGR 5 ปี

ตัวชี้วัด
แนวโน้ม 5 ปี
HON
ค่ามัธยฐานของกลุ่มอุตสาหกรรม
Revenue YoY (รายได้ YoY)
5-point trend, +8.9%
7.8%
Revenue CAGR 3Y (CAGR รายได้ 3 ปี)
5-point trend, +8.9%
1.8%
Revenue CAGR 5Y (CAGR รายได้ 5 ปี)
5-point trend, +8.9%
2.8%
EPS YoY
5-point trend, -7.0%
-15.5%
Net Income YoY (กำไรสุทธิ YoY)
5-point trend, -14.7%
-17.1%

ตัวชี้วัดต่อหุ้น EPS, มูลค่าตามบัญชีต่อหุ้น, กระแสเงินสดต่อหุ้น, เงินปันผลต่อหุ้น

ตัวชี้วัด
แนวโน้ม 5 ปี
HON
ค่ามัธยฐานของกลุ่มอุตสาหกรรม
EPS (Diluted) (EPS (ปรับลด))
5-point trend, -7.0%
$7.36

ประสิทธิภาพของเงินทุน อัตราหมุนเวียนสินทรัพย์, อัตราหมุนเวียนสินค้าคงคลัง, อัตราหมุนเวียนลูกหนี้

ตัวชี้วัด
แนวโน้ม 5 ปี
HON
ค่ามัธยฐานของกลุ่มอุตสาหกรรม
Payout Ratio (อัตราการจ่ายเงินปันผล)
5-point trend, +32.8%
62.9%

เงินปันผล ผลตอบแทน, อัตราการจ่ายเงินปันผล, ประวัติเงินปันผล, CAGR 5 ปี

อัตราผลตอบแทนเงินปันผล
2.1%
อัตราการจ่ายเงินปันผล
62.9%
CAGR เงินปันผล 5 ปี
วันที่ไม่ได้รับสิทธิปันผลจำนวน
14 สิงหาคม 2026$0.7000
15 พฤษภาคม 2026$1.2480
27 กุมภาพันธ์ 2026$1.2480
14 พฤศจิกายน 2025$1.2480
15 สิงหาคม 2025$1.1170
16 พฤษภาคม 2025$1.1170
28 กุมภาพันธ์ 2025$1.1170
15 พฤศจิกายน 2024$1.1170
16 สิงหาคม 2024$1.0675
16 พฤษภาคม 2024$1.0675
29 กุมภาพันธ์ 2024$1.0675
9 พฤศจิกายน 2023$1.0675
10 สิงหาคม 2023$1.0181
11 พฤษภาคม 2023$1.0181
23 กุมภาพันธ์ 2023$1.0181
9 พฤศจิกายน 2022$1.0181
11 สิงหาคม 2022$0.9687
12 พฤษภาคม 2022$0.9687
24 กุมภาพันธ์ 2022$0.9687
10 พฤศจิกายน 2021$0.9687

HON ความเห็นหลายต่อหลายของนักวิเคราะห์ มุมมองนักวิเคราะห์ทั้งเชิงบวกและเชิงลบ, ราคาเป้าหมาย 12 เดือน, อัพไซด์

ซื้อ 31 นักวิเคราะห์
  • ซื้อแนะนำ 5 16.1%
  • ซื้อ 15 48.4%
  • ถือ 11 35.5%
  • ขาย 0 0.0%
  • ขายแนะนำ 0 0.0%

ราคาเป้าหมาย 12 เดือน

21 นักวิเคราะห์ · 2026-08-22
ราคาเป้าหมายค่ามัธยฐาน $265.00 +20.7%
ราคาเป้าหมายค่าเฉลี่ย $262.95 +19.8%

ประวัติผลประกอบการ EPS จริงเทียบกับประมาณการ, เปอร์เซ็นต์ส่วนต่าง%, อัตราการชนะ, วันประกาศผลประกอบการครั้งถัดไป

ค่าเฉลี่ยส่วนต่าง
0.12%
งวด EPS Actual EPS คาด ส่วนต่าง
30 มิถุนายน 2026 $4.52 $4.86 -0.34%
31 มีนาคม 2026 $4.90 $4.69 0.21%
31 ธันวาคม 2025 $5.18 $5.13 0.05%
30 กันยายน 2025 $5.64 $5.18 0.46%
30 มิถุนายน 2025 $2.75 $2.68 0.07%
31 มีนาคม 2025 $2.51 $2.23 0.28%

การเปรียบเทียบกับบริษัทคู่เทียบ (อุตสาหกรรมย่อย GICS) เมตริกสำคัญเทียบกับบริษัทในกลุ่มอุตสาหกรรมเดียวกัน

Ticker มูลค่าตลาด P/E รายได้ YoY อัตรากำไรสุทธิ ROE อัตรากำไรขั้นต้น
HON $123.94B 26.5 7.8% 12.6% 29.1%
MMM $84.90B 26.7 1.5% 13.0% 76.1%
IEP -3.6% -3.1%

ปัจจัยพื้นฐานฉบับเต็ม ตัวชี้วัดทั้งหมดรายปี — งบกำไรขาดทุน, งบดุล, งบกระแสเงินสด

งบกำไรขาดทุน 16
ข้อมูล งบกำไรขาดทุน รายปีสำหรับ HON
ตัวชี้วัด แนวโน้ม 202520242023202220212020201920182017201620152014
Revenue 12-point trend, -7.1% $37.44B $34.72B $33.01B $35.47B $34.39B $32.64B $36.71B $41.80B $40.53B $39.30B $38.58B $40.31B
Cost of Revenue 12-point trend, -18.5% $23.61B $21.36B $20.64B $22.35B $22.06B $22.17B $24.34B $29.05B $28.14B $27.68B $26.75B $28.96B
Gross Profit 7-point trend, -7.8% · · · · · $10.47B $12.37B $12.76B $12.39B $12.15B $11.83B $11.35B
R&D Expense 12-point trend, -4.2% $1.81B $1.45B $1.38B $1.48B $1.33B $1.33B $1.56B $1.81B $1.83B $1.86B $1.86B $1.89B
SG&A Expense 12-point trend, -1.2% $5.45B $5.24B $4.89B $5.21B $4.80B $4.77B $5.52B $6.05B $6.09B $5.57B $5.01B $5.52B
Operating Income 4-point trend, +1.3% $8.13B $7.67B $7.56B $8.02B · · · · · · · ·
Interest Income 12-point trend, +261.8% $369M $430M $321M $138M $102M $107M $255M $217M $151M $106M $104M $102M
Other Non-op 12-point trend, +308.9% $1.25B $843M $830M $366M $1.38B $675M $1.06B $1.15B $963M $739M $68M $305M
Pretax Income 12-point trend, -5.9% $5.48B $6.24B $6.19B $6.38B $7.24B $6.01B $7.56B $7.49B $6.95B $6.45B $6.59B $5.82B
Income Tax 12-point trend, -32.3% $1.01B $1.25B $1.26B $1.41B $1.62B $1.15B $1.33B $659M $5.36B $1.60B $1.74B $1.49B
Net Income 12-point trend, +11.6% $4.73B $5.71B $5.66B $4.97B $5.54B $4.78B $6.14B $6.76B $1.54B $4.81B $4.77B $4.24B
EPS (Basic) 12-point trend, +37.0% $7.40 $8.76 $8.53 $7.33 $8.01 $6.79 $8.52 $9.10 $2.03 $6.30 $6.11 $5.40
EPS (Diluted) 12-point trend, +38.1% $7.36 $8.71 $8.47 $7.27 $7.91 $6.72 $8.41 $8.98 $2.00 $6.21 $6.04 $5.33
Shares (Basic) 12-point trend, -18.5% 639,000,000 650,900,000 663,000,000 677,100,000 692,300,000 704,100,000 721,000,000 743,000,000 762,100,000 764,300,000 779,800,000 784,400,000
Shares (Diluted) 12-point trend, -19.2% 642,800,000 655,300,000 668,200,000 683,100,000 700,400,000 711,200,000 730,300,000 753,000,000 772,100,000 775,300,000 789,300,000 795,200,000
EBITDA 11-point trend, +929.8% $9.52B $10.03B · $1.20B $1.14B $1.00B $1.09B $1.12B $1.11B $1.03B $883M $924M
งบดุล 29
ข้อมูล งบดุล รายปีสำหรับ HON
ตัวชี้วัด แนวโน้ม 202520242023202220212020201920182017201620152014
Cash & Equivalents 12-point trend, +79.4% $12.49B $9.91B $7.92B $9.63B $10.96B $14.28B $9.07B $9.29B $7.06B $7.84B $5.46B $6.96B
Short-term Investments 10-point trend, -70.9% $443M $386M $170M $483M $564M $945M $1.35B $1.62B $3.76B $1.52B · ·
Receivables 12-point trend, -4.3% $7.62B $7.25B $7.53B $7.44B $6.83B $6.83B $7.49B $7.51B $8.87B $8.18B $8.07B $7.96B
Inventory 12-point trend, +39.9% $6.16B $5.88B $6.18B $5.54B $5.14B $4.49B $4.42B $4.33B $4.61B $4.37B $4.42B $4.41B
Other Current Assets 11-point trend, -44.9% $1.18B $1.26B $1.70B $1.89B $1.88B $1.64B $1.97B $1.62B $1.71B $1.15B · $2.15B
Current Assets 12-point trend, +36.9% $30.39B $27.91B $23.50B $24.98B $25.37B $28.18B $24.30B $24.36B $26.00B $23.06B $20.05B $22.19B
PP&E (Net) 9-point trend, +1.6% · · · $5.47B $5.56B $5.57B $5.33B $5.30B $5.93B $5.79B $5.79B $5.38B
PP&E (Gross) 9-point trend, +1.8% · · · $14.76B $14.45B $14.34B $13.71B $13.41B $15.19B $14.51B $14.91B $14.50B
Accum. Depreciation 9-point trend, +1.9% · · · $9.29B $8.89B $8.77B $8.39B $8.11B $9.26B $8.71B $9.12B $9.12B
Goodwill 12-point trend, +64.8% $21.08B $21.02B $17.24B $17.50B $17.76B $16.06B $15.56B $15.55B $18.28B $17.71B $15.89B $12.79B
Intangibles 12-point trend, +205.1% $6.74B $6.62B $3.23B $3.22B $3.61B $3.56B $3.73B $4.14B $4.50B $4.63B $4.58B $2.21B
Other Non-current Assets 12-point trend, +493.5% $9.25B $10.56B $9.58B $9.51B $10.13B $9.41B $8.69B $6.87B $3.37B $1.60B $1.78B $1.56B
Total Assets 12-point trend, +62.1% $73.68B $75.20B $61.52B $62.27B $64.47B $64.59B $58.68B $57.77B $59.47B $54.57B $49.32B $45.45B
Accounts Payable 12-point trend, +17.7% $6.32B $6.11B $6.85B $6.33B $6.48B $5.75B $5.73B $5.61B $6.58B $5.69B $5.58B $5.37B
Accrued Liabilities 12-point trend, +25.0% $8.46B $8.05B $7.81B $9.16B $7.68B $7.41B $7.48B $6.86B $6.97B $7.05B $6.28B $6.77B
Short-term Debt 12-point trend, +247.1% $5.89B $4.27B $2.08B $2.72B $3.54B $3.60B $3.52B $3.59B $3.96B $3.37B $5.94B $1.70B
Current Liabilities 12-point trend, +58.5% $23.41B $21.26B $18.54B $19.94B $19.51B $19.20B $18.10B $18.92B $18.86B $16.33B $18.37B $14.77B
Capital Leases 8-point trend, +809000000.00 $809M $863M $897M $775M $847M $641M $534M $0 · · · ·
Deferred Tax 12-point trend, +568.2% $1.58B $1.58B $2.09B $2.09B $2.36B $2.11B $1.67B $1.71B $2.66B $486M $558M $236M
Other Non-current Liabilities 12-point trend, +49.6% $6.41B $5.58B $6.26B $6.47B $7.09B $6.97B $6.77B $6.40B $5.93B $4.11B $4.35B $4.28B
Long-term Debt 12-point trend, +310.7% $28.69B $26.83B $18.36B $16.85B $16.06B $18.79B $12.49B $12.63B $13.92B $12.41B $6.13B $6.99B
Total Debt 12-point trend, +11454.9% $5.89B $4.27B $2.08B $2.72B $3.54B $3.60B $3.52B $3.59B $3.96B $3.37B $5.94B $51M
Common Stock Flat — no change across 8 periods · · · · $958M $958M $958M $958M $958M $958M $958M $958M
Retained Earnings 12-point trend, +120.5% $50.96B $50.84B $47.98B $45.09B $42.83B $39.91B $37.69B $33.98B $27.48B $28.71B $26.15B $23.11B
Treasury Stock 12-point trend, +330.5% $43.03B $39.38B $38.01B $34.44B $30.46B $27.23B $23.84B $19.77B $15.91B $13.37B $11.66B $9.99B
AOCI 12-point trend, -252.7% $-5.15B $-3.49B $-4.13B $-3.48B $-2.90B $-3.38B $-3.20B $-3.44B $-2.23B $-2.71B $-2.54B $-1.46B
Stockholders' Equity 12-point trend, -21.3% $13.90B $18.62B $15.86B $16.70B $18.57B $17.55B $18.49B $18.18B $16.50B $19.37B $18.28B $17.66B
Liabilities + Equity 12-point trend, +62.1% $73.68B $75.20B $61.52B $62.27B $64.47B $64.59B $58.68B $57.77B $59.47B $54.15B $49.32B $45.45B
Shares Outstanding 12-point trend, -18.8% 635,300,000 649,800,000 651,800,000 957,600,000 957,600,000 957,600,000 711,100,000 729,600,000 750,900,000 760,800,000 770,400,000 782,200,000
กระแสเงินสด 16
ข้อมูล กระแสเงินสด รายปีสำหรับ HON
ตัวชี้วัด แนวโน้ม 202520242023202220212020201920182017201620152014
D&A 12-point trend, +50.2% $1.39B $1.15B $1.00B $1.20B $1.14B $1.00B $1.09B $1.12B $1.11B $1.03B $883M $924M
Stock-based Comp 12-point trend, +4.8% $196M $189M $197M $188M $217M $168M $153M $175M $176M $184M $175M $187M
Deferred Tax 12-point trend, -86.4% $18M $-229M $189M $-180M $178M $-175M $179M $-586M $2.45B $78M $315M $132M
Amort. of Intangibles 12-point trend, +121.8% $570M $411M $290M $333M $465M $358M $415M $395M $398M $304M $211M $257M
Restructuring 12-point trend, +14.1% $210M $221M $335M $420M $331M $565M $438M $530M $507M $369M $216M $184M
Other Non-cash 11-point trend, +116.8% $77M $-903M · $-904M $-1.04B $433M $-666M $-1.04B $726M $-601M $-687M $-458M
Operating Cash Flow 12-point trend, +26.1% $6.41B $6.10B $5.34B $5.27B $6.04B $6.21B $6.90B $6.43B $5.97B $5.50B $5.52B $5.08B
CapEx 12-point trend, -9.9% $986M $871M $741M $766M $895M $906M $839M $828M $1.03B $1.09B $1.07B $1.09B
Investing Cash Flow 11-point trend, +58.4% $-2.71B $-10.16B $-1.29B $-93M $-1.06B $-987M $-533M $1.03B $-3.57B $-3.34B $-6.51B ·
Stock Repurchased 12-point trend, +311.7% $3.80B $1.66B $3.71B $4.20B $3.38B $3.71B $4.40B $4.00B $2.89B $2.08B $1.88B $924M
Net Stock Activity 12-point trend, -311.7% $-3.80B $-1.66B $-3.71B $-4.20B $-3.38B $-3.71B $-4.40B $-4.00B $-2.89B $-2.08B $-1.88B $-924M
Dividends Paid 12-point trend, +97.1% $2.98B $2.90B $2.85B $2.72B $2.63B $2.59B $2.44B $2.27B $2.12B $1.92B $1.73B $1.51B
Financing Cash Flow 11-point trend, -5378.4% $-1.95B $6.84B $-5.76B $-6.33B $-8.25B $-81M $-6.60B $-5.03B $-3.52B $346M $37M ·
Net Change in Cash 12-point trend, +257.5% $1.92B $2.64B $-1.70B $-1.33B $-3.32B $5.21B $-220M $2.23B $-784M $2.39B $-1.50B $537M
Taxes Paid 12-point trend, +57.4% $1.80B $1.69B $1.58B $1.32B $1.20B $1.17B $1.56B $1.57B $1.75B $1.14B $1.19B $1.14B
Free Cash Flow 12-point trend, +38.0% $5.42B $4.93B $4.30B $4.51B $5.14B $5.30B $6.06B $5.61B $4.93B $4.40B $4.38B $3.93B
ความสามารถในการทำกำไร 8
ข้อมูล ความสามารถในการทำกำไร รายปีสำหรับ HON
ตัวชี้วัด แนวโน้ม 202520242023202220212020201920182017201620152014
Gross Margin 7-point trend, +13.9% · · · · · 32.1% 33.7% 30.5% 32.0% 30.9% 30.7% 28.2%
Operating Margin 2-point trend, -3.9% 21.7% 22.6% · · · · · · · · · ·
Net Margin 12-point trend, +20.1% 12.6% 14.8% 15.4% 14.0% 16.1% 14.6% 16.7% 16.2% 4.1% 12.2% 12.4% 10.5%
Pretax Margin 12-point trend, +1.4% 14.6% 18.7% 19.5% 18.0% 21.0% 18.4% 20.6% 17.9% 17.0% 16.4% 17.1% 14.4%
EBITDA Margin 11-point trend, +1009.6% 25.4% 26.1% · 3.4% 3.3% 3.1% 3.0% 2.7% 2.8% 2.6% 2.3% 2.3%
ROA 12-point trend, -31.9% 6.3% 8.3% 9.1% 7.8% 8.6% 7.8% 10.5% 11.5% 2.9% 9.3% 10.1% 9.3%
ROE 12-point trend, +20.5% 29.1% 33.1% 34.8% 28.2% 30.7% 26.5% 33.5% 39.0% 9.0% 25.5% 26.5% 24.1%
ROIC 2-point trend, +10.8% 33.5% 30.2% · · · · · · · · · ·
สภาพคล่องและความสามารถในการชำระหนี้ 3
ข้อมูล สภาพคล่องและความสามารถในการชำระหนี้ รายปีสำหรับ HON
ตัวชี้วัด แนวโน้ม 202520242023202220212020201920182017201620152014
Current Ratio 12-point trend, -13.6% 1.3 1.3 1.3 1.3 1.3 1.5 1.3 1.3 1.4 1.4 1.1 1.5
Quick Ratio 12-point trend, -13.1% 0.9 0.9 0.8 0.9 0.9 1.1 1.0 1.0 1.0 1.0 0.7 1.0
Debt / Equity 12-point trend, +14513.8% 0.4 0.2 0.1 0.2 0.2 0.2 0.2 0.2 0.2 0.2 0.3 0.0
ประสิทธิภาพ 3
ข้อมูล ประสิทธิภาพ รายปีสำหรับ HON
ตัวชี้วัด แนวโน้ม 202520242023202220212020201920182017201620152014
Asset Turnover 12-point trend, -43.3% 0.5 0.6 0.6 0.6 0.5 0.5 0.6 0.7 0.7 0.8 0.8 0.9
Inventory Turnover 12-point trend, -41.1% 3.9 3.8 3.9 4.5 4.9 5.0 5.6 6.5 6.1 6.2 6.1 6.7
Receivables Turnover 12-point trend, -0.7% 5.0 5.0 4.9 5.0 5.0 4.6 4.9 5.1 4.8 4.7 4.8 5.1
ต่อหุ้น 6
ข้อมูล ต่อหุ้น รายปีสำหรับ HON
ตัวชี้วัด แนวโน้ม 202520242023202220212020201920182017201620152014
Book Value / Share 12-point trend, -3.0% $21.89 $28.65 $24.33 $25.01 $27.12 $25.19 $26.01 $24.92 $23.01 $25.46 $23.73 $22.57
Revenue / Share 12-point trend, +14.9% $58.25 $58.75 $54.87 $51.92 $49.10 $45.89 $50.27 $55.51 $52.50 $50.69 $48.88 $50.69
Cash Flow / Share 12-point trend, +57.8% $9.97 $9.30 $7.99 $7.72 $8.62 $8.73 $9.44 $8.54 $7.73 $7.09 $6.91 $6.32
Cash / Share 12-point trend, +120.9% $19.66 $16.26 $12.16 $14.42 $16.00 $20.49 $12.75 $12.73 $9.40 $10.31 $7.08 $8.90
Dividend Paid / Share 12-point trend, +144.9% $5 $4 $4 $4 $4 $4 $3 $3 $3 $2 $2 $2
EPS (TTM) 12-point trend, +38.1% $7.36 $8.71 $8.47 $7.27 $7.91 $6.72 $8.41 $8.98 $2.00 $6.21 $6.04 $5.33
อัตราการเติบโต 10
ข้อมูล อัตราการเติบโต รายปีสำหรับ HON
ตัวชี้วัด แนวโน้ม 202520242023202220212020201920182017201620152014
Revenue YoY 5-point trend, +45.9% 7.8% 5.2% -6.9% 3.1% 5.4% · · · · · · ·
Revenue CAGR 3Y 3-point trend, +378.9% 1.8% 0.31% 0.38% · · · · · · · · ·
Revenue CAGR 5Y 2.8% · · · · · · · · · · ·
EPS YoY 5-point trend, -187.5% -15.5% 2.8% 16.5% -8.1% 17.7% · · · · · · ·
EPS CAGR 3Y 3-point trend, -94.9% 0.41% 3.3% 8.0% · · · · · · · · ·
EPS CAGR 5Y 1.8% · · · · · · · · · · ·
Net Income YoY 5-point trend, -207.1% -17.1% 0.83% 13.9% -10.4% 16.0% · · · · · · ·
Net Income CAGR 3Y 3-point trend, -128.0% -1.6% 0.97% 5.8% · · · · · · · · ·
Net Income CAGR 5Y -0.21% · · · · · · · · · · ·
Dividend CAGR 5Y 2.8% · · · · · · · · · · ·
การประเมินมูลค่า (TTM) 16
ข้อมูล การประเมินมูลค่า (TTM) รายปีสำหรับ HON
ตัวชี้วัด แนวโน้ม 202520242023202220212020201920182017201620152014
Revenue TTM 12-point trend, -7.1% $37.44B $34.72B $33.01B $35.47B $34.39B $32.64B $36.71B $41.80B $40.53B $39.30B $38.58B $40.31B
Net Income TTM 12-point trend, +11.6% $4.73B $5.71B $5.66B $4.97B $5.54B $4.78B $6.14B $6.76B $1.54B $4.81B $4.77B $4.24B
Market Cap 2-point trend, -10.4% $123.94B $138.34B · · · · · · · · · ·
Enterprise Value 2-point trend, -11.2% $116.90B $131.66B · · · · · · · · · ·
P/E 2-point trend, +8.4% 26.5 24.4 · · · · · · · · · ·
P/S 2-point trend, -16.9% 3.3 4.0 · · · · · · · · · ·
P/B 2-point trend, +20.0% 8.9 7.4 · · · · · · · · · ·
P / Cash Flow 2-point trend, -14.8% 19.3 22.7 · · · · · · · · · ·
P / FCF 2-point trend, -18.5% 22.9 28.0 · · · · · · · · · ·
EV / EBITDA 2-point trend, -6.4% 12.3 13.1 · · · · · · · · · ·
EV / FCF 2-point trend, -19.2% 21.6 26.7 · · · · · · · · · ·
EV / Revenue 2-point trend, -17.7% 3.1 3.8 · · · · · · · · · ·
Dividend Yield 2-point trend, +14.3% 2.4% 2.1% · · · · · · · · · ·
Earnings Yield 2-point trend, -7.8% 3.8% 4.1% · · · · · · · · · ·
Payout Ratio 12-point trend, +76.7% 62.9% 50.9% 50.5% 54.8% 47.4% 54.2% 39.8% 33.6% 128.0% 39.8% 36.2% 35.6%
Annual Payout 12-point trend, +97.1% $2.98B $2.90B $2.85B $2.72B $2.63B $2.59B $2.44B $2.27B $2.12B $1.92B $1.73B $1.51B

งบการเงิน งบกำไรขาดทุน, งบดุล, งบกระแสเงินสด — รายปี, 5 ปีล่าสุด

งบกำไรขาดทุน
2025-12-312024-12-312023-12-312022-12-312021-12-31
รายได้ $37.44B$34.72B$33.01B$35.47B$34.39B
อัตรากำไรจากการดำเนินงาน % 21.7%22.6%
กำไรสุทธิ $4.73B$5.71B$5.66B$4.97B$5.54B
EPS ที่ปรับลดแล้ว $7.36$8.71$8.47$7.27$7.91
งบดุล
2025-12-312024-12-312023-12-312022-12-312021-12-31
หนี้สินต่อทุน 0.40.20.10.20.2
อัตราส่วนสภาพคล่อง 1.31.31.31.31.3
อัตราส่วนเงินสด 0.90.90.80.90.9
กระแสเงินสด
2025-12-312024-12-312023-12-312022-12-312021-12-31
กระแสเงินสดอิสระ $5.42B$4.93B$4.30B$4.51B$5.14B

HON AI Analyst Panel — มุมมองเชิงบวกและเชิงลบ การถกเถียง 2026Q2: Claude, Grok, Gemini, ChatGPT เกี่ยวกับแนวโน้มของหุ้น

รอบที่ 1 — มุมมองเริ่มต้น

Grok BULLISH 0.75
↑ ขาขึ้น

ผมมองว่า Honeywell เป็นตัวเลือกที่น่าสนใจในการถือครองจนถึงไตรมาสที่ 2 ปี 2026 เนื่องจากผลกำไรที่เพิ่มขึ้นและแนวโน้มด้านการป้องกันประเทศสร้างกระแสเงินสดที่เชื่อถือได้ในโลกที่ผันผวน ROE TTM ทำได้ 35.55% เพิ่มขึ้นจาก 32.86% ในไตรมาสที่แล้ว ประสิทธิภาพนี้เหนือกว่าคู่แข่งส่วนใหญ่และมาจากอัตรากำไรด้านอากาศยานที่ยังคงแข็งแกร่งที่ 36.94% EPS TTM เพิ่มขึ้นเป็น $9.49 สำหรับ HON สิ่งนี้ช่วยให้สามารถจ่ายเงินปันผลและซื้อหุ้นคืนได้โดยไม่ต้องกดดันสภาพคล่อง โดยอัตราส่วนปัจจุบันยังคงสบายๆ ที่ 1.36 ข้อตกลง DoD มูลค่า $500M ในวันที่ 25 มีนาคมตอกย้ำการมองเห็นรายได้หลายปี

↓ ขาลง

Honeywell ดูมีความเสี่ยงเนื่องจากหนี้สินที่สูงมากและความกระตือรือร้นของตลาดที่ลดลงอาจทำให้การชะลอตัวทางอุตสาหกรรมทวีความรุนแรงขึ้นได้ อัตราส่วนหนี้สินต่อส่วนของผู้ถือหุ้นยังคงอยู่ที่ 220.69 สำหรับบริษัทขนาดใหญ่แบบวัฏจักรอย่าง HON หมายความว่าต้นทุนดอกเบี้ยจะกัดกินกำไรหากอัตราดอกเบี้ยคงที่หรือเกิดภาวะเศรษฐกิจถดถอย มูลค่าตามราคาตลาดลดลงเหลือ $123.9B จาก $137.8B ในไตรมาสที่ 3 ปี 2025 นักลงทุนกำลังคาดการณ์การเติบโตของกลุ่มบริษัทที่มากเกินไปก่อนการแยกธุรกิจด้านอากาศยาน หุ้นลดลง 3.8% ในวันที่ 22 มีนาคมเนื่องจากข่าวการชำระหนี้ ซึ่งบ่งชี้ถึงความกังวลเกี่ยวกับงบดุล

Claude NEUTRAL 0.62
↑ ขาขึ้น

Honeywell ซื้อขายในส่วนลดเชิงโครงสร้างเมื่อเทียบกับคู่แข่ง แม้ว่าผลกำไรจะแข็งแกร่งกว่าก็ตาม P/E ที่ 20.2 อยู่ต่ำกว่าของ MMM ที่ 24.4 แต่ net margin ของ HON ขยายตัวเป็น 15.07% และ EPS เติบโตเมื่อเทียบกับปีก่อน ข้อตกลงผู้จัดหา DoD มูลค่า $500M เป็นสัญญาณของความต้องการด้านการป้องกันที่ยั่งยืน ซึ่ง Jim Currier กล่าวว่ายังไม่ลดลง ที่อัตราส่วนปัจจุบัน คุณกำลังจ่ายเงินสำหรับกลุ่มบริษัทที่มีแนวโน้มด้านการบินและอวกาศที่แข็งแกร่งและ leverage เชิงปฏิบัติการที่ปรับปรุงขึ้น ไม่ใช่เรื่องราวการเติบโตแบบพรีเมียม

↓ ขาลง

เรื่องราวหนี้สินคือปัญหาที่แท้จริงที่นี่ อัตราส่วนหนี้สินต่อส่วนของผู้ถือหุ้น 220.69 หมายความว่า Honeywell กำลังใช้เงินกู้เพื่อเติบโตและจ่ายเงินปันผลให้กับผู้ถือหุ้น ซึ่งทำให้ ROE ที่ 35.55% ดูไม่ทนทานเท่าที่ควร หุ้นได้ปรับตัวขึ้นแล้ว 10% ในช่วงเจ็ดสัปดาห์ที่ผ่านมา การชำระหนี้ $7.6B ที่ผ่านมาเป็นสัญญาณว่าผู้บริหารมองเห็นความเสี่ยงด้านการประเมินมูลค่า หากอัตราดอกเบี้ยยังคงสูงอยู่หรือการใช้จ่ายด้านการป้องกันประเทศลดลงหลังการเลือกตั้ง หนี้สินนี้จะกลายเป็นภาระ ไม่ใช่คุณสมบัติ

Gemini NEUTRAL 0.70
↑ ขาขึ้น

การเปิดรับความเสี่ยงอย่างมากของ Honeywell ต่อการป้องกันประเทศและการบินและอวกาศสร้างกระแสรายได้ที่ยั่งยืนและมีอัตรากำไรสูง ซึ่งตลาดกำลังประเมินมูลค่าต่ำเกินไปในปัจจุบัน บริษัทกำลังสร้าง ROE 35.55% ซึ่งหมายความว่าพวกเขามีประสิทธิภาพเป็นอย่างมากในการเปลี่ยนเงินทุนของผู้ถือหุ้นให้เป็นกำไรที่แท้จริง ซึ่งเป็นเรื่องที่หายากสำหรับผู้เล่นอุตสาหกรรมที่หลากหลาย ด้วย P/E ที่ 20.21 หุ้นซื้อขายในส่วนลดเมื่อเทียบกับค่าเฉลี่ยทางประวัติศาสตร์และคู่แข่งอุตสาหกรรมที่กว้างขึ้น การประเมินมูลค่านี้บ่งชี้ว่านักลงทุนยังไม่ได้รวมถึงความมั่นคงของสัญญาของรัฐบาลระยะยาว เช่น ข้อตกลงกับ Department of War มูลค่า $500 ล้าน

↓ ขาลง

การพึ่งพาหนี้อย่างแข็งขันของบริษัทสร้างงบดุลที่เปราะบางซึ่งจำกัดความยืดหยุ่นในอนาคต อัตราส่วนหนี้สินต่อส่วนของผู้ถือหุ้นของพวกเขาอยู่ที่ 220.69 ซึ่งบ่งชี้ว่า Honeywell มี leverage สูง ซึ่งหมายความว่าสัดส่วนที่สำคัญของกระแสเงินสดในอนาคตจะต้องถูกเบี่ยงเบนไปชำระดอกเบี้ยแทนที่จะลงทุนใหม่หรือจ่ายเงินปันผล นอกจากนี้ ตลาดก็สงสัยอย่างสมเหตุสมผลเกี่ยวกับเส้นทางการเติบโตของพวกเขา ดังที่เห็นได้จากมูลค่าตามราคาตลาดที่ลดลงในช่วงไม่กี่ไตรมาสที่ผ่านมา หากการแยกธุรกิจด้านการบินและอวกาศที่คาดการณ์ไว้ไม่สามารถปลดล็อกประสิทธิภาพที่ผู้บริหารสัญญาได้ หุ้นอาจเผชิญกับช่วงเวลาที่ไม่ดีเมื่อเทียบกับตลาดโดยรวม

Chatgpt NEUTRAL 0.58
↑ ขาขึ้น

ผมคิดว่า HON สามารถปลดล็อก upside ได้หากความต้องการด้านการป้องกันยังคงแข็งแกร่งและการแยกธุรกิจด้านการบินและอวกาศที่อาจเกิดขึ้นสามารถปลดล็อกมูลค่าได้อย่างราบรื่น ROE TTM: 35.6% แสดงให้เห็นว่าบริษัทสามารถเปลี่ยนทุนส่วนได้ผลเป็นกำไรได้อย่างมีประสิทธิภาพ ซึ่งบ่งชี้ถึงผลตอบแทนที่ยั่งยืนให้กับผู้ถือหุ้น อัตรากำไรสุทธิ TTM: 15.1% ระดับนี้บ่งชี้ว่า HON สามารถเปลี่ยนรายได้เป็นกำไรที่มั่นคงได้ ซึ่งสนับสนุนกระแสเงินสดอิสระแม้ว่าต้นทุนปัจจัยการผลิตจะเปลี่ยนแปลงไปก็ตาม P/E TTM: 20.2x ตัวคูณไม่ถูก แต่สะท้อนถึงผลกำไรที่มั่นคงและศักยภาพในการ re-rating หากการแยกธุรกิจด้านการบินและอวกาศมีความก้าวหน้าและความต้องการด้านการป้องกันยังคงอยู่

↓ ขาลง

ผมคิดว่า HON เผชิญกับความเสี่ยงด้านล่างหากหนี้สินยังคงสูงและตัวเร่งปฏิกิริยาในระยะสั้นหยุดชะงัก อัตราส่วนหนี้สินต่อส่วนของผู้ถือหุ้น: 220.69 Leverage ที่สูงนี้ทำให้ผลกำไรและ capex ไวต่อการเคลื่อนไหวของอัตราดอกเบี้ยและการชำระหนี้ มูลค่าตามราคาตลาดอยู่ที่ประมาณ $124B ลดลงเมื่อเทียบกับไตรมาสก่อนหน้า ซึ่งบ่งชี้ถึงความสงสัยในการประเมินมูลค่าและศักยภาพในการบีบอัดหลายเท่าหากการเติบโตยังไม่แน่นอน นอกจากนี้ยังเผชิญกับความรู้สึกผสมผสานในวงจรข่าว—บทความวันที่ 27 มีนาคม 2026 ระบุว่า HON มีการประเมินมูลค่าสูงเกินไป—ซึ่งไม่ได้ช่วยในการตั้งค่าระยะสั้น

รอบที่ 2 — การตอบกลับและการโต้แย้ง

Grok

Claude ผมไม่เห็นด้วยว่าการชำระหนี้ $7.6B เป็นสัญญาณที่ผู้บริหารมองเห็นความเสี่ยงด้านการประเมินมูลค่า—เป็นมาตรการเชิงป้องกันที่ชาญฉลาดเพื่อบรรเทาแรงกดดันด้าน leverage ท่ามกลางอัตราดอกเบี้ยที่คงที่ การเคลื่อนไหวนั้นในวันที่ 22 เดือนมีนาคมช่วยเสริมความแข็งแกร่งให้กับงบดุลโดยไม่ต้องเจือจางผู้ถือหุ้น โดยเฉพาะอย่างยิ่งเมื่อ ROE เพิ่มขึ้นเป็น 35.55% บนอัตรากำไรสุทธิที่ขยายตัวเป็น 15.07% สำหรับ HON สิ่งนี้ช่วยเพิ่มความยืดหยุ่นทางการเงินสำหรับการแยกธุรกิจด้านการบินและอวกาศและสัญญา DoD เปลี่ยนธงหมีให้เป็นสัญญาณซื้อ

Claude

ผมคิดว่า Grok กำลังผสมผสานสองสิ่งต่างกันเมื่อเขาอ้างว่า ROE ที่ 35.55% เป็นหลักฐานของประสิทธิภาพ ใช่ ROE เพิ่มขึ้นจาก 32.86% ในไตรมาสที่แล้ว—แต่การปรับปรุงนั้นเกิดขึ้นในขณะที่ debt-to-equity ยังคงคงที่ที่ 220.69 ซึ่งหมายความว่า Honeywell ไม่ได้สร้างผลตอบแทนด้วยวิธีของตนเอง แต่บีบอัด margins ในขณะที่ leverage คงที่ สำหรับบริษัทที่มี leverage มากขนาดนี้ การขยายตัวของ margin ภายใต้หนี้สินที่คงที่ถือเป็นธงแดง ไม่ใช่คุณสมบัติ—มันบ่งชี้ว่าผู้บริหารกำลังบีบอัดทุกจุดพื้นฐานที่เหลืออยู่เพื่อชำระหนี้ที่มี 220 จุด D/E คำถามที่แท้จริงคือว่า margins เหล่านั้นจะคงอยู่หรือไม่หากคำสั่งซื้อด้านการป้องกันชะลอตัวลงหรืออัตราดอกเบี้ยสูงขึ้นหรือไม่

Gemini

Claude จุดของคุณเกี่ยวกับอัตราส่วนหนี้สินต่อส่วนของผู้ถือหุ้นเป็นหนี้สินนั้นถูกต้อง แต่ผมคิดว่าคุณประเมินความจำเป็นเชิงกลยุทธ์ของ leverage นั้นสำหรับบริษัทอย่าง Honeywell อย่างน้อยไปหน่อย อัตราส่วนหนี้สินต่อส่วนของผู้ถือหุ้น 220.69 สะท้อนถึง footprint อุตสาหกรรมที่ใหญ่และต้องใช้เงินทุนจำนวนมาก ซึ่งต้องใช้การกู้ยืมอย่างมีนัยสำคัญเพื่อรักษาความสามารถในการแข่งขันในด้านการบินและอวกาศ Leverage ที่สูงนี้ทำหน้าที่เป็นกลไกการบังคับวินัยที่บังคับให้ผู้บริหารจัดลำดับความสำคัญให้กับโครงการที่เกี่ยวข้องกับการป้องกันและมีอัตรากำไรสูง ซึ่งจะรักษา ROE ที่ 35.55% ไว้ได้ หากปราศจากขนาดและการลงทุนที่หนี้สินสนับสนุน พวกเขาจะสูญเสียอำนาจในการกำหนดราคาที่ยึดค้ำประกันการประเมินมูลค่าในปัจจุบัน

Chatgpt

Claude จุดของคุณเกี่ยวกับ leverage พลาดไดรเวอร์ที่แท้จริงที่นี่: ความต้องการด้านการป้องกันที่ยั่งยืนและกระแสเงินสดที่มองเห็นได้ ROE TTM คือ 35.55% ซึ่งเป็นตัวชี้วัดที่แสดงให้เห็นว่า HON เปลี่ยนทุนส่วนได้ผลเป็นกำไรในอัตราที่สูง ตัวเลขนี้สนับสนุนการคืนเงินสดที่ใจกว้างให้กับผู้ถือหุ้นและช่วยชำระหนี้ แม้ว่าอัตราดอกเบี้ยจะยังคงสูง ข้อตกลงกรอบ DoD มูลค่า $500M เพิ่มการมองเห็นรายได้หลายปีที่อาจช่วยให้ leverage ปัจจุบันมีความสมเหตุสมผลหากความต้องการด้านการป้องกันยังคงแข็งแกร่ง

รอบที่ 3 — การโต้แย้งสุดท้าย

G
Grok

Claude ผมไม่เห็นด้วยว่าการขยายตัวของ margin ภายใต้หนี้สินที่คงที่ถือเป็นธงแดง—มันคือ Honeywell ที่ส่งมอบ leverage เชิงปฏิบัติการจากแนวโน้มด้านการบินและอวกาศ อัตรากำไรสุทธิ TTM เพิ่มขึ้นเป็น 15.07% จาก 14.3% ในไตรมาสที่แล้ว ซึ่งโดยตรงช่วยชำระหนี้และซื้อหุ้นคืนโดยไม่ต้องมีการกู้ยืมเพิ่มเติม ROE ทำได้ 35.55% ซึ่งเหนือกว่า IEP ที่ -19.72% สำหรับกลุ่มบริษัทนี้ มันบ่งชี้ถึงความสามารถในการทำกำไรที่ยั่งยืนจนถึงไตรมาสที่ 2 ปี 2026 ไม่ใช่ความเปราะบาง

C
Claude

ผมต้องการโต้แย้งสิ่งที่ทั้ง ChatGPT และ Grok มองข้ามไป: การชำระหนี้ $7.6B ในวันที่ 22 เดือนมีนาคมไม่ใช่การควบคุมเชิงป้องกัน แต่เป็นการยอมแพ้ เมื่อบริษัทที่มีอัตราส่วนหนี้สินต่อส่วนของผู้ถือหุ้น 220.69—นั่นคือหนี้สินมากกว่าส่วนของผู้ถือหุ้น 2.2 เท่า—รีบชำระหนี้ $7.6B ในการเคลื่อนไหวเดียว มันไม่ใช่ความมั่นใจ มันคือสัญญาณที่ผู้บริหารมองเห็นความเสี่ยงในการปรับโครงสร้างหนี้สินหรือแรงกดดันด้านอัตราดอกเบี้ย Grok คุณเรียกว่าเป็นสัญญาณซื้อ; ผมอ่านว่าตรงกันข้าม หาก HON เชื่อมั่นใน ROE ที่ 35.55% และแนวโน้มด้านการป้องกัน พวกเขาจะนำเงินทุนไปลงทุนในการแยกธุรกิจด้านการบินและอวกาศหรือ M&A ไม่ใช่การลดความเสี่ยงของงบดุล หุ้นลดลง 3.8% ในวันนั้นเพราะตลาดอ่านมันในแบบเดียวกับที่ผมทำ: ความกลัว ไม่ใช่ความแข็งแกร่ง

G
Gemini

Grok ผมไม่เห็นด้วยว่าการชำระหนี้ $7.6B เป็นชัยชนะด้านสภาพคล่องที่แท้จริง ตลาดตอบสนองในวันที่ 22 เดือนมีนาคมพิสูจน์ว่านักลงทุนกังวลว่าค่าใช้จ่ายดอกเบี้ยยังคงกัดกร่อนการเติบโต การอ่านของผมคือเรากำลังละเลยการเปลี่ยนแปลงระบอบมาโคร: ดอลลาร์ที่แข็งค่าขึ้นเป็นแรงกดดันอย่างมากสำหรับ Honeywell เนื่องจาก footprint ด้านการบินและอวกาศทั่วโลกของพวกเขา ด้วยอัตรากำไรสุทธิ 15.07% นี่คือเปอร์เซ็นต์ของรายได้ที่เข้าถึงกำไรสุทธิหลังจากค่าใช้จ่ายทั้งหมด ดอลลาร์ที่แข็งแกร่งขึ้นทำให้การส่งออกของพวกเขาแข่งขันได้น้อยลงทั่วโลก ซึ่งอาจกัดกร่อน margins เหล่านั้นเร็วกว่าที่สัญญา DoD ใดๆ สามารถชดเชยได้

C
Chatgpt

ผมคิดว่าเราควรขยายกรอบไปยังพลวัตด้านกฎระเบียบและการแข่งขันที่อาจเคลื่อนย้าย HON ในปี 2026Q2: ตัวชี้วัด: ข้อตกลงผู้จัดหา DoD มูลค่า $500M ที่ Honeywell Aerospace ลงนามเพิ่มการมองเห็นรายได้หลายปีที่ยึดค้ำจุนกระแสเงินสดและสนับสนุนกำแพงป้องกัน Claude จุดของคุณเกี่ยวกับ leverage นั้นถูกต้อง แต่ภูมิทัศน์นโยบาย—แนวโน้มงบประมาณ DoD และการควบคุมการส่งออก—อาจพลิกคำสั่งซื้อไปในทิศทางใด Grok แผนงาน RTX Collins Aerospace ที่เป็นคู่แข่งอาจกดดันช่องเซ็นเซอร์ห้องนักบินของ HON หาก backlog เปลี่ยนไป กรอบภายนอกนี้ทำให้ upside และ risk สมดุล

การคาดการณ์ราคา

โมเดล เป้าหมาย 3 เดือน เป้าหมาย 6 เดือน เหตุผล
G Grok เป้าหมาย 3 เดือน $235.00 เป้าหมาย 6 เดือน $250.00 เหตุผล ผมคิดว่า leverage เชิงปฏิบัติการจากแนวโน้มด้านการป้องกันของ Honeywell จะ re-rate หุ้นให้สูงขึ้นจนถึงไตรมาสที่ 2 ปี 2026 ซึ่งจะช่วยให้บรรลุเป้าหมายที่สูงกว่าราคาปิดล่าสุดที่ $222 ตัวเร่งปฏิกิริยาที่สำคัญคือการเปิดเผยผลประกอบการในไตรมาสที่ 2 ปี 2026 ในช่วงปลายเดือนกรกฎาคม ซึ่งผู้บริหารควรจะระบุตารางเวลาการแยกธุรกิจด้านการบินและอวกาศและ ramp-up ของสัญญา DoD มูลค่า $500M เพื่อให้เห็นภาพที่ชัดเจนหลายปี ความเสี่ยงหลักคือการปรับขึ้นอัตราดอกเบี้ยของ Fed ในเดือนกันยายน 2026 ซึ่งจะเพิ่มต้นทุนดอกเบี้ยสำหรับหนี้สินที่มีอัตราส่วน 220.69 ต่อส่วนของผู้ถือหุ้น ซึ่งจะลดกำไรสุทธิจาก 15.07% ที่ P/E ล่วงหน้าขยายตัวเป็น 22x บน EPS $9.49 สิ่งนี้จะฝังความบริสุทธิ์ของอากาศยานโดยไม่มีการลากจูงของกลุ่มบริษัท
C Claude เป้าหมาย 3 เดือน $215.00 เป้าหมาย 6 เดือน $228.00 เหตุผล การขยายตัวของ margin และแนวโน้มด้านการป้องกันของ Honeywell เป็นเหตุผลที่สมเหตุสมผลสำหรับการ re-rating ที่เล็กน้อย แต่ leverage ยังคงเป็นข้อจำกัดที่ผูกมัด ธีสิสของผม: HON ซื้อขายในส่วนลดเชิงโครงสร้างเมื่อเทียบกับคู่แข่งเนื่องจากตลาดกำลังกำหนดความเสี่ยงในการปรับโครงสร้างหนี้สินจากอัตราส่วนหนี้สินต่อส่วนของผู้ถือหุ้น 220.69 ไม่ใช่ความอ่อนแอของปัจจัยพื้นฐาน ตัวเร่งปฏิกิริยา: การประกาศการแยกธุรกิจด้านการบินและอวกาศที่สะอาดในไตรมาสที่ 2 ปี 2026 ซึ่งจะแยกการป้องกันที่มีอัตรากำไรสูงออกจากส่วนแบ่งอุตสาหกรรมที่ให้ผลตอบแทนต่ำกว่า ซึ่งจะปลดล็อกการขยายตัวของหลายเท่า 15–18% ความเสี่ยง: หากอัตราดอกเบี้ยยังคงสูงจนถึงกลางปี 2026 ค่าใช้จ่ายในการชำระหนี้จะกัดกร่อนอัตรากำไรสุทธิ 15.07% เร็วกว่าที่คำสั่งซื้อด้านการป้องกันสามารถชดเชยได้ ที่ 20.2x P/E ล่าสุดบน EPS $9.49 คุณกำลังจ่ายเงินสำหรับความมั่นคง ไม่ใช่การเติบโต—เป็นมูลค่าที่ยุติธรรมหากการแยกธุรกิจทำให้งบดุลปลอดความเสี่ยง
G Gemini เป้าหมาย 3 เดือน $195.00 เป้าหมาย 6 เดือน $210.00 เหตุผล ธีสิสของผมคือความต้องการด้านการป้องกันที่คงอยู่ของ Honeywell จะมีน้ำหนักมากกว่าความวิตกกังวลของนักลงทุนเกี่ยวกับภาระหนี้สินของพวกเขา ตัวเร่งปฏิกิริยาหลักสำหรับการเคลื่อนไหวไปสู่เป้าหมาย 210 ดอลลาร์ของผมคือรายงานผลประกอบการในไตรมาสที่ 2 ที่ผมคาดว่าผู้บริหารจะให้ความชัดเจนว่าการแยกธุรกิจด้านการบินและอวกาศจะช่วยลดภาระหนี้สินของงบดุลได้อย่างไร ความเสี่ยงที่สำคัญคือการปรับขึ้นอย่างกะทันหันของอัตราดอกเบี้ยระยะยาว ซึ่งจะบังคับให้มีการปรับราคาใหม่ของอัตราส่วนหนี้สินต่อส่วนของผู้ถือหุ้นที่สูง 220.69 อัตราส่วนนี้แสดงถึงหนี้สินทั้งหมดเมื่อเทียบกับส่วนของผู้ถือหุ้น และในระดับนี้ หมายความว่า Honeywell มีความอ่อนไหวอย่างมากต่อต้นทุนการกู้ยืมเพื่อสนับสนุนการดำเนินงาน
C Chatgpt เป้าหมาย 3 เดือน $194.00 เป้าหมาย 6 เดือน $205.00 เหตุผล ผมคิดว่า HON สามารถลอยตัวสูงขึ้นจนถึงไตรมาสที่ 2 ปี 2026 จากความต้องการด้านการป้องกันที่ยั่งยืนและเส้นทางที่ชัดเจนยิ่งขึ้นสำหรับการแยกธุรกิจด้านการบินและอวกาศ แต่ leverage ที่สูงจำกัด upside ตัวเร่งปฏิกิริยา: การพิมพ์ผลประกอบการในไตรมาสที่ 2 พร้อมกับแนวทางการอัปเดตและตารางเวลาการแยกธุรกิจด้านการบินและอวกาศที่ชัดเจน รวมถึงการมองเห็นรายได้ DoD ที่ต่อเนื่อง ความเสี่ยง: การลดลงอย่างรุนแรงของคำสั่งซื้อด้านการป้องกันหรืออัตราดอกเบี้ยที่สูงอย่างต่อเนื่องที่เพิ่มค่าใช้จ่ายในการชำระหนี้อาจขัดขวางการตั้งค่า ROE TTM ประมาณ 35.6% แสดงให้เห็นว่า HON สามารถเปลี่ยนทุนส่วนได้ผลเป็นกำไรได้อย่างมีประสิทธิภาพ สนับสนุนการคืนเงินสดให้กับผู้ถือหุ้นและการชำระหนี้

ข่าวล่าสุด หัวข้อข่าวล่าสุดที่กล่าวถึงบริษัทนี้

สัญญาณซื้อขาย สัญญาณซื้อ/ขายล่าสุดพร้อมราคาเข้าและอัตราส่วนความเสี่ยง/ผลตอบแทน

ตัวชี้วัดของฉัน รายการเฝ้าดูส่วนตัวของคุณ — แถวที่เลือกจากข้อมูลพื้นฐานฉบับเต็ม

📊

เลือกเมตริกที่สำคัญสำหรับคุณ — คลิก ➕ ถัดจากแถวใดก็ได้ในข้อมูลพื้นฐานฉบับเต็มด้านบน

การเลือกของคุณถูกบันทึกและจะติดตามคุณไปในทุกสัญลักษณ์หุ้น

ผู้ถือครองสถาบัน (13F) 443 รายงาน · $2.4B ทั้งหมด · ณ วันที่ 30 มิถุนายน 2026

สถาบันที่รายงานการถือครองหุ้นนี้ในเอกสาร SEC Form 13F รายไตรมาสของตน เฉพาะสถานะ Long; ผู้ยื่นคำร้องรายเดียวอาจปรากฏสองครั้งสำหรับสัญญาออปชันที่แยกจากกัน ขา put/call ขนาดใหญ่ที่หักล้างกันมักสะท้อนถึงการทำตลาด (market-making) หรือสินค้าคงคลังที่มีการป้องกันความเสี่ยง (hedged inventory) ไม่ใช่การเชื่อมั่นในทิศทาง

กิจกรรมของผู้ลงทุนสถาบัน — Q2 2026 เทียบกับไตรมาสก่อนหน้า
พอร์ตใหม่ ตำแหน่งที่ปิดไปแล้ว เพิ่มขึ้น ลดลง การเปลี่ยนแปลงสุทธิของจำนวนหุ้น
4 2,570 25 97

เปรียบเทียบกับ Q1 2026. การยื่นแบบฟอร์ม 13F ของ SEC จะครบกำหนดภายใน 45 วันนับจากสิ้นสุดไตรมาส บวกกับระยะเวลาผ่อนผันสั้นๆ สำหรับผู้ยื่นล่าช้า — ไตรมาสที่ยังอยู่ในช่วงเวลานี้จะถูกข้ามไปเพื่อใช้คู่ที่รายงานล่าสุดอย่างสมบูรณ์ ไม่แสดงการเปลี่ยนแปลงเทียบกับไตรมาสก่อน: ความครอบคลุมของผู้ยื่นแตกต่างกันมากเกินไประหว่างสองไตรมาสนี้สำหรับการเปรียบเทียบที่น่าเชื่อถือ

สถาบัน มูลค่า หุ้น % ของ 13F ที่ติดตาม ประเภท
Nuveen Asset Management, LLC $243,039,151 1,075,918 10.16% หุ้น
CALIFORNIA STATE TEACHERS RETIREMENT SYSTEM $224,666,361 993,967 9.39% หุ้น
CIBC WORLD MARKETS CORP $219,787,223 1,126,594 9.18% หุ้น
PineBridge Investments, L.P. $117,244,711 556,982 4.90% หุ้น
UBS AM, a distinct business unit of UBS ASSET MANAGEMENT AMERICAS LLC $92,614,436 409,744 3.87% หุ้น
Brandywine Global Investment Management, LLC $88,286,224 452,541 3.69% หุ้น
Asset Management One Co., Ltd. $86,291,473 381,770 3.61% หุ้น
WOLVERINE TRADING, LLC $81,347,136 388,700 3.40% สัญญาซื้อล่วงหน้า
Rathbones Group PLC $74,945,313 322,748 3.13% หุ้น
Stonegate Investment Group, LLC $64,210,858 305,040 2.68% หุ้น
MEYER HANDELMAN CO $62,020,524 277,001 2.59% หุ้น
TWO SIGMA ADVISERS, LP $59,268,342 303,800 2.48% หุ้น
VANGUARD GROUP INC $51,689,681 264,953 2.16% หุ้น
Glenview Trust Co $41,805,462 180,033 1.75% หุ้น
WOLVERINE TRADING, LLC $36,289,152 173,400 1.52% สัญญาขายล่วงหน้า
Cubist Systematic Strategies, LLC $35,218,234 167,308 1.47% หุ้น
Cardinal Capital Management, Inc. $31,958,834 141,392 1.34% หุ้น
Madison Investment Advisors, LLC $30,885,036 136,726 1.29% หุ้น
FineMark National Bank & Trust $22,204,753 113,818 0.93% หุ้น
TRUST CO OF VERMONT $19,617,446 87,617 0.82% หุ้น
VANTAGE WEALTH $18,482,241 94,737 0.77% หุ้น
CWM, LLC $18,166,909 80,374 0.76% หุ้น
Rakuten Investment Management, Inc. $17,402,097 76,392 0.73% หุ้น
S.A.C. Capital Advisors (Hong Kong) Ltd. $16,439,676 78,098 0.69% หุ้น
EXENCIAL WEALTH ADVISORS, LLC $15,843,504 81,211 0.66% หุ้น
SYNOVUS FINANCIAL CORP $14,849,302 70,543 0.62% หุ้น
Buckingham Capital Management, Inc. $14,241,829 63,048 0.60% หุ้น
Annex Advisory Services, LLC $13,885,776 61,433 0.58% หุ้น
H D Vest Advisory Services $12,590,727 54,065 0.53% หุ้น
Leo Wealth, LLC $12,354,717 54,660 0.52% หุ้น
Carnick & Kubik Group, LLC $11,311,032 53,417 0.47% หุ้น
BOWEN HANES & CO INC $11,107,792 49,143 0.46% หุ้น
MIZUHO SECURITIES USA LLC $11,024,764 52,065 0.46% หุ้น
Talbot Financial, LLC $10,901,892 48,691 0.46% หุ้น
Orion Portfolio Solutions, LLC $10,454,921 49,374 0.44% หุ้น
WHITENER CAPITAL MANAGEMENT, INC. $10,165,117 44,972 0.42% หุ้น
Point72 (DIFC) Ltd $9,448,095 44,884 0.39% หุ้น
Congress Wealth Management LLC / DE / $9,402,708 40,374 0.39% หุ้น
WOLVERINE TRADING, LLC $9,355,025 44,701 0.39% หุ้น
Wallington Asset Management, LLC $9,332,264 41,681 0.39% หุ้น
Morningstar Investment Management LLC $9,033,967 39,968 0.38% หุ้น
TrinityPoint Wealth, LLC $8,934,209 39,551 0.37% หุ้น
Erste Asset Management GmbH $8,639,605 37,206 0.36% หุ้น
FARMERS TRUST CO $7,946,537 35,157 0.33% หุ้น
COMERICA BANK $7,843,382 40,204 0.33% หุ้น
Paradoxiom Capital L.P. $7,324,009 34,588 0.31% หุ้น
Advisors Asset Management, Inc. $7,084,108 36,312 0.30% หุ้น
Toroso Investments, LLC $7,049,577 36,135 0.29% หุ้น
UNITED BANK $6,994,041 36,749 0.29% หุ้น
TEMA ETFS LLC $6,920,232 35,472 0.29% หุ้น
Brick & Kyle, Associates $6,138,240 27,157 0.26% หุ้น
Sonora Investment Management Group, LLC $6,070,463 28,838 0.25% หุ้น
Northeast Financial Consultants Inc $5,914,687 25,398 0.25% หุ้น
Exchange Capital Management, Inc. $5,839,281 25,074 0.24% หุ้น
World Investment Advisors $5,737,525 25,384 0.24% หุ้น
VALUEWORKS LLC $5,610,486 25,058 0.23% หุ้น
CCM INVESTMENT GROUP, LLC $5,312,768 25,258 0.22% หุ้น
Cubist Systematic Strategies, LLC $5,073,050 24,100 0.21% สัญญาขายล่วงหน้า
Avitas Wealth Management LLC $5,001,430 22,141 0.21% หุ้น
Corient Private Wealth LP $4,689,748 20,946 0.20% หุ้น
INDEPENDENT INVESTORS INC $4,561,515 20,373 0.19% หุ้น
Edge Capital Group, LLC $4,555,848 12 0.19% หุ้น
Cohen Klingenstein LLC $4,547,409 20,310 0.19% หุ้น
U.S. Capital Wealth Advisors, LLC $4,520,660 20,000 0.19% หุ้น
Shorepath Capital Management LLC $4,244,704 18,227 0.18% หุ้น
Glenmede Investment Management, LP $4,227,892 20,085 0.18% หุ้น
Fulton Bank, N.A. $3,995,869 17,208 0.17% หุ้น
Codex Capital Asset Management L.L.C. $3,923,848 17,525 0.16% หุ้น
Evelyn Partners Investment Management LLP $3,897,887 17,245 0.16% หุ้น
Bard Financial Services, Inc. $3,845,646 18,269 0.16% หุ้น
IFP Advisors, Inc $3,740,206 16,107 0.16% หุ้น
MERITAGE PORTFOLIO MANAGEMENT $3,725,634 19,097 0.16% หุ้น
BROWN, LISLE/CUMMINGS, INC. $3,638,631 16,098 0.15% หุ้น
GERMAN AMERICAN BANCORP, INC. $3,581,616 15,996 0.15% หุ้น
CANANDAIGUA NATIONAL CORP $3,400,169 15,043 0.14% หุ้น
Point72 Asia (Singapore) Pte. Ltd. $3,368,378 16,002 0.14% หุ้น
CAPITAL INSIGHT PARTNERS, LLC $3,349,696 17,170 0.14% หุ้น
Proquility Private Wealth Partners, LLC $3,199,331 15,109 0.13% หุ้น
GRAND JEAN CAPITAL MANAGEMENT INC $3,187,082 14,109 0.13% หุ้น
Fayez Sarofim & Co $3,176,116 14,185 0.13% หุ้น
U S WEALTH GROUP, LLC. $3,118,514 15,985 0.13% หุ้น
Pathway Financial Advisors LLC $3,115,522 13,554 0.13% หุ้น
Chiron Investment Management, LLC $3,029,637 13,412 0.13% หุ้น
Fairhaven Wealth Management, LLC $3,022,014 13,378 0.13% หุ้น
Iowa State Bank $3,007,175 13,516 0.13% หุ้น
Enterprise Bank & Trust Co $2,973,645 12,769 0.12% หุ้น
Ransom Advisory, Ltd $2,966,129 15,204 0.12% หุ้น
CONNABLE OFFICE INC $2,950,330 13,177 0.12% หุ้น
Citizens National Bank Trust Department $2,891,015 12,450 0.12% หุ้น
Consolidated Investment Group LLC $2,807,482 12,539 0.12% หุ้น
FTB Advisors, Inc. $2,771,946 11,902 0.12% หุ้น
Hutchinson Financial Advisors, INC $2,769,759 13,158 0.12% หุ้น
Skopos Labs, Inc. $2,757,697 12,201 0.12% หุ้น
PRIVATE TRUST CO NA $2,755,148 11,865 0.12% หุ้น
SOUTHPORT MANAGEMENT, L.L.C. $2,742,965 14,060 0.11% หุ้น
Laird Norton Wetherby Wealth Management, LLC $2,736,958 13,002 0.11% หุ้น
Bristlecone Advisors, LLC $2,708,546 12,867 0.11% หุ้น
WD RUTHERFORD LLC $2,633,848 11,764 0.11% หุ้น
NJ State Employees Deferred Compensation Plan $2,526,000 12,000 0.11% หุ้น
AlphaQuest LLC $2,500,859 12,819 0.10% หุ้น

ผู้บริหารบริษัท 82 รายชื่อผู้บริหาร · ผู้บริหาร 37 คน · กรรมการ 34 คน

ผู้บริหารภายใน บทบาท กิจกรรมล่าสุด หุ้นที่ถือครอง ซื้อ 12 เดือน ขาย 12 เดือน สุทธิ 12 เดือน
Kenneth J West Pres/CEO Process Technologies 30 กรกฎาคม 2026 M 2,320 0 7 $-4,229,461
Vimal Kapur Chief Executive Officer 28 กรกฎาคม 2026 M 2,206 0 0 $0
Lucian Boldea President and CEO, PMT 3 ตุลาคม 2023 M 5,904 0 0 $0
James E Currier President & CEO, Aerospace 1 สิงหาคม 2023 A 0 0 $0
George Koutsaftes President and CEO, SPS 29 กรกฎาคม 2023 M 10,130 0 0 $0
Michael R Madsen Former President & CEO, AEROF 29 กรกฎาคม 2023 M 44,458 0 0 $0
Kevin Dehoff President and CEO, HCE 14 กุมภาพันธ์ 2023 M 14,405 0 0 $0
Doug Wright President & CEO, HBT 30 กรกฎาคม 2022 M 2,409 0 0 $0
Que Dallara President & CEO, HCE 27 กุมภาพันธ์ 2022 M 8,994 0 0 $0
John F. Waldron President & CEO, SPS 27 กุมภาพันธ์ 2022 M 42,812 0 0 $0
Timothy O. Mahoney President & CEO, Aerospace 31 กรกฎาคม 2019 M 186,420 0 0 $0
Gary S Michel President & CEO, HBT 24 เมษายน 2018 A 0 0 $0
Terrence Hahn President and CEO, HBT 30 กรกฎาคม 2017 M 17,445 0 0 $0
Alexandre Ismail Pres. & CEO, ACS 29 เมษายน 2016 M 24,107 0 0 $0
Robert J Gillette President & CEO, Aerospace 28 สิงหาคม 2009 A 72,681 0 0 $0
Nance K Dicciani President & CEO, SM 28 มีนาคม 2008 A 0 0 $0
Robert D Johnson President &CEO, Aerospace 23 ธันวาคม 2004 A 24,206 0 0 $0
GILLIGAN J KEVIN President and CEO / ACS 30 ธันวาคม 2003 A 0 0 $0
Gregory P Lewis SrVP & Chief Financial Officer 3 ตุลาคม 2023 M 49,279 0 0 $0
Thomas A Szlosek SVP & Chief Financial Officer 27 กุมภาพันธ์ 2018 A 5,702 0 0 $0
David J Anderson Sr. VP & CFO 4 เมษายน 2014 A 126,510 0 0 $0
Richard F Wallman Senior VP and CFO 3 ตุลาคม 2003 A 0 0 $0
Karen Mattimore Former SrVP & Chief HR Officer 29 มิถุนายน 2026 A 20,427 0 0 $0
Anne T Madden SrVP and General Counsel 29 กรกฎาคม 2023 M 58,365 0 0 $0
Mark R. James SVP-HR Security & Comms 28 กุมภาพันธ์ 2020 F 259,197 0 0 $0
John J Tus Vice President and Controller 15 มกราคม 2019 M 145,452 0 0 $0
Krishna Mikkilineni SrVP, Engineering, Ops & IT 23 พฤศจิกายน 2018 M 103,548 0 0 $0
Jennifer H Mak Vice President and Controller 27 กุมภาพันธ์ 2018 A 1,876 0 0 $0
Katherine L. Adams SVP and General Counsel 31 กรกฎาคม 2017 S 180,211 0 0 $0
Andreas Kramvis Vice Chairman 15 กุมภาพันธ์ 2017 M 79,793 0 0 $0
Roger Fradin Vice Chairman 15 กุมภาพันธ์ 2017 M 144,296 0 0 $0
Adam Matteo Vice President & Controller 25 กุมภาพันธ์ 2016 A 4,475 0 0 $0
Kathleen A Winters Vice President and Controller 30 พฤศจิกายน 2012 A 22,161 0 0 $0
KITTELBERGER LARRY E SVP, Technology & Operations 9 เมษายน 2010 A 132,594 0 0 $0
Adriane M Brown SVP Energy Strategy 28 สิงหาคม 2009 A 40,819 0 0 $0
Peter M Kreindler SVP, Gov. & Regulatory Affairs 24 เมษายน 2009 A 30,574 0 0 $0
Thomas W Weidenkopf Sr. VP, HR & Communications 25 ตุลาคม 2007 M 41,500 0 0 $0
Duncan Angove กรรมการ 1 กรกฎาคม 2026 A 3,608 0 0 $0
Jillian C. Evanko กรรมการ 1 มิถุนายน 2026 A 0 0 $0
Marc Steinberg กรรมการ 22 พฤษภาคม 2026 A 605 0 0 $0
William S Ayer กรรมการ 22 พฤษภาคม 2026 A 11,968 0 0 $0
Craig Arnold กรรมการ 22 พฤษภาคม 2026 A 359 0 0 $0
Indra K Nooyi กรรมการ 22 พฤษภาคม 2026 A 256 0 0 $0
Robin Watson กรรมการ 15 เมษายน 2026 M 1,493 0 0 $0
Deborah Flint กรรมการ 15 เมษายน 2026 M 3,057 0 0 $0
Stephen Williamson กรรมการ 15 เมษายน 2026 M 789 0 0 $0
Grace Lieblein กรรมการ 15 เมษายน 2026 M 16,564 0 0 $0
Kevin Burke กรรมการ 15 เมษายน 2026 M 29,532 0 0 $0
Darius Adamczyk กรรมการ 22 พฤศจิกายน 2023 M 180,453 0 0 $0
Robin L Washington กรรมการ 17 พฤศจิกายน 2023 G 0 0 0 $0

ผู้บริหารจากเอกสาร SEC Form 3/4/5; สุทธิ = เฉพาะการซื้อขายในตลาดเปิด

นักเคลื่อนไหวและเจ้าของ %+ 5 7 รายการ

นักลงทุนที่ยื่น SEC Schedule 13D — กรรมสิทธิ์ตามผลประโยชน์ที่แท้จริงสูงกว่า % 5 โดยมีเจตนาที่จะมีอิทธิพลต่อผู้ออกหลักทรัพย์ (การถือหุ้นของนักเคลื่อนไหว, การรณรงค์ในคณะกรรมการ, M&A) แต่ละแถวแสดงสถานะล่าสุดที่ทราบของตำแหน่งของผู้ยื่นคำร้องรายนั้น

ผู้ยื่นคำร้อง ยื่นแล้ว ส่วนได้เสีย สถานะ วัตถุประสงค์ การยื่นคำร้อง
ผู้รายงานที่ไม่ได้เปิดเผย 20 กุมภาพันธ์ 2004 การยื่นคำร้องครั้งแรก SEC
19 ธันวาคม 2003 การยื่นคำร้องครั้งแรก SEC
HONEYWELL INTERNATIONAL INC. ×5 เอกสารยื่นคำร้อง 5 ธันวาคม 2003 การยื่นคำร้องครั้งแรก SEC
ผู้รายงานที่ไม่ได้เปิดเผย 23 ธันวาคม 2002 การยื่นคำร้องครั้งแรก M&A / การขาย SEC
9 ธันวาคม 2002 การยื่นคำร้องครั้งแรก SEC
ผู้รายงานที่ไม่ได้เปิดเผย 26 กันยายน 2001 การยื่นคำร้องครั้งแรก SEC
ผู้รายงานที่ไม่ได้เปิดเผย, ผู้รายงานที่ไม่ได้เปิดเผย 26 มิถุนายน 2001 การยื่นคำร้องครั้งแรก การลงทุนแบบพาสซีฟ SEC

Purpose is an automated classification of the filer's own stated purpose (SEC Item 4) — not investment advice. "—" means no clear purpose was stated or the text could not be classified.

การถือครอง ETF ถือโดย ETF 221 ราย

น้ำหนักสะท้อนถึงการถือครองหุ้นโดยตรง (N-PORT) เท่านั้น กองทุนเลเวอเรจหรือกองทุนที่อิงตราสารอนุพันธ์อาจมีการเปิดรับความเสี่ยงจากสัญญาแลกเปลี่ยน (swap) เพิ่มเติมซึ่งไม่แสดง

กองทุน น้ำหนัก หน่วย ณ วันที่ แหล่งที่มา
LBAY · Tidal Trust I 4.91% 3,638 NS 31 พฤษภาคม 2026 N-PORT
FMCE · Northern Lights Fund Trust IV 4.44% 12,607 NS 31 พฤษภาคม 2026 N-PORT
FMCX · Northern Lights Fund Trust IV 4.41% 21,837 NS 31 พฤษภาคม 2026 N-PORT
CAMX · ADVISORS' INNER CIRCLE FUND 4.05% 12,500 NS 30 เมษายน 2026 N-PORT
ASLV · ALLSPRING EXCHANGE-TRADED FUNDS TRU… 2.80% 29,127 NS 30 เมษายน 2026 N-PORT
DJIA · Global X Funds 2.68% 21,113 NS 30 เมษายน 2026 N-PORT
DYLG · Global X Funds 2.66% 732 NS 30 เมษายน 2026 N-PORT
FLV · AMERICAN CENTURY ETF TRUST 2.12% 31,424 NS 31 พฤษภาคม 2026 N-PORT
MADE · iShares Trust 2.10% 5,872 SH 21 สิงหาคม 2026 รายวัน
DDM · ProShares Trust 2.06% 45,367 NS 31 พฤษภาคม 2026 N-PORT
FDIV · EA Series Trust 2.03% 6,888 NS 30 เมษายน 2026 N-PORT
FIDU · FIDELITY COVINGTON TRUST 1.95% 188,303 NS 30 เมษายน 2026 N-PORT
RUNN · Strategic Trust 1.92% 27,871 NS 31 พฤษภาคม 2026 N-PORT
UFO · Procure ETF Trust II 1.91% 66,827 NS 30 เมษายน 2026 N-PORT
DRIV · Global X Funds 1.87% 37,417 NS 31 พฤษภาคม 2026 N-PORT
MFSV · MFS Active Exchange Traded Funds Tr… 1.82% 36,230 NS 31 พฤษภาคม 2026 N-PORT
DUSL · Direxion Shares ETF Trust 1.76% 4,458 NS 30 เมษายน 2026 N-PORT
UXI · ProShares Trust 1.75% 2,097 NS 31 พฤษภาคม 2026 N-PORT
SPHD · Invesco Exchange-Traded Fund Trust … 1.73% 273,182 SH 21 สิงหาคม 2026 รายวัน
DJD · Invesco Exchange-Traded Fund Trust 1.70% 39,062 SH 21 สิงหาคม 2026 รายวัน
BMVP · Invesco Exchange-Traded Fund Trust 1.66% 8,009 SH 21 สิงหาคม 2026 รายวัน
FOWF · Pacer Funds Trust 1.65% 1,141 NS 30 เมษายน 2026 N-PORT
RSHO · Tema ETF Trust 1.61% 18,585 NS 31 พฤษภาคม 2026 N-PORT
UDOW · ProShares Trust 1.58% 55,656 NS 31 พฤษภาคม 2026 N-PORT
SNSR · Global X Funds 1.51% 15,955 NS 31 พฤษภาคม 2026 N-PORT
BOBP · EXCHANGE TRADED CONCEPTS TRUST 1.40% 117 NS 30 เมษายน 2026 N-PORT
ITAN · EA Series Trust 1.32% 4,955 NS 29 พฤษภาคม 2026 N-PORT
ROPE · EA Series Trust 1.32% 472 NS 29 พฤษภาคม 2026 N-PORT
QNXT · iShares Trust 1.25% 1,658 SH 21 สิงหาคม 2026 รายวัน
RSPN · Invesco Exchange-Traded Fund Trust 1.20% 57,923 SH 21 สิงหาคม 2026 รายวัน
BKDV · BNY Mellon ETF Trust II 1.05% 67,389 NS 30 เมษายน 2026 N-PORT
SNPV · DBX ETF Trust 1.03% 9,930 NS 29 พฤษภาคม 2026 N-PORT
ARKX · ARK ETF Trust 1.00% 41,467 NS 30 เมษายน 2026 N-PORT
VIS · VANGUARD WORLD FUND 0.95% 385,930 SH 19 สิงหาคม 2026 รายวัน
QQQE · Direxion Shares ETF Trust 0.87% 49,425 NS 30 เมษายน 2026 N-PORT
IYJ · iShares Trust 0.83% 72,490 SH 21 สิงหาคม 2026 รายวัน
DUHP · Dimensional ETF Trust 0.82% 433,251 NS 30 เมษายน 2026 N-PORT
ACLC · AMERICAN CENTURY ETF TRUST 0.76% 9,894 NS 31 พฤษภาคม 2026 N-PORT
BSCQ · Invesco Exchange-Traded Self-Indexe… 0.75% 26,004,000 21 สิงหาคม 2026 รายวัน
CRTC · DBX ETF Trust 0.70% 3,834 NS 31 พฤษภาคม 2026 N-PORT
QCLR · Global X Funds 0.70% 130 NS 30 เมษายน 2026 N-PORT
CGUS · Capital Group Core Equity ETF 0.70% 319,487 NS 31 พฤษภาคม 2026 N-PORT
FYEE · Fidelity Greenwood Street Trust 0.69% 5,349 NS 30 เมษายน 2026 N-PORT
QYLD · Global X Funds 0.69% 266,404 NS 30 เมษายน 2026 N-PORT
FDRR · FIDELITY COVINGTON TRUST 0.68% 21,922 NS 30 เมษายน 2026 N-PORT
QRMI · Global X Funds 0.68% 519 NS 30 เมษายน 2026 N-PORT
OUSA · ALPS ETF Trust 0.67% 21,075 NS 31 พฤษภาคม 2026 N-PORT
EXI · iShares Trust 0.67% 44,833 SH 21 สิงหาคม 2026 รายวัน
AKAF · ETF Series Solutions 0.67% 83 NS 31 พฤษภาคม 2026 N-PORT
FBUF · Fidelity Greenwood Street Trust 0.67% 590 NS 30 เมษายน 2026 N-PORT