
EDN Empresa Distribuidora Y Comercializadora Norte S.A. (Edenor) American Depositary Shares
NYSE · Utilities · SEC EDGAR'da Görüntüle ↗ kapat Eki 2, 2026 10-K/10-Q Nis 15, 2026EDN Hisse Senedi Özeti Fiyat, piyasa değeri, P/E, EPS, ROE, borç/öz sermaye, 52 haftalık aralık
EDN Hisse Senedi Fiyat Grafiği Teknik göstergeler ile günlük OHLCV — kaydır, yakınlaştır ve görünümünüzü özelleştirin
Çubuk çözünürlüğü seçilen döneme uyum sağlar — bir çubuk için açılış/yüksek/düşük/kapanış değerlerini görmek için grafiğin üzerine gelin.
Empresa Distribuidora Y Comercializadora Norte S.A. (Edenor) American Depositary Shares Hakkında Wikipedia'dan şirket genel bakışı
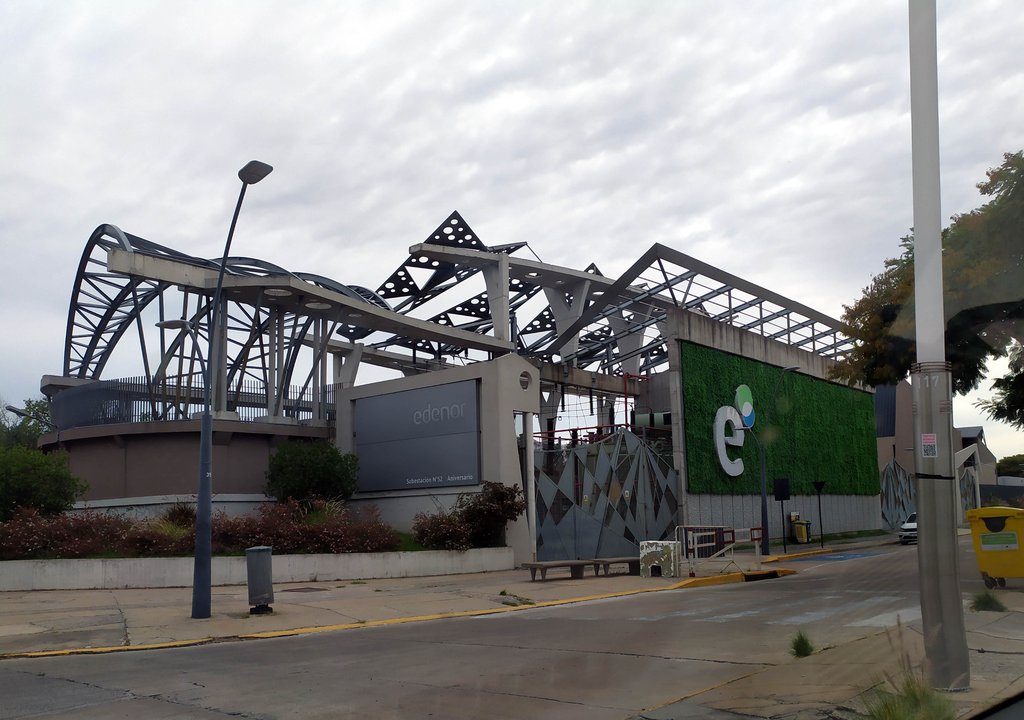
Edenor is a public Argentine electricity distribution company founded in 1992 and headquartered in Buenos Aires. The company has an exclusive concession to distribute electricity in the northwestern section of Greater Buenos Aires, and in the north of Buenos Aires proper, selling electric power to residential, commercial, industrial, and government customers.
Edenor's 34,500 kilometers of network and 2.5 million customers represent 18.5% of the Argentine market in its industry.
History
Edenor was established on July 21, 1992, as part of the broader privatization of Servicios Eléctricos del Gran Buenos Aires S.A. (SEGBA), a state-owned entity responsible for electricity distribution in Buenos Aires. SEGBA was split into three distribution companies—Edenor, Edesur, and Edelap—as well as several generation companies. This restructuring was intended to promote competition and efficiency in the sector.
EDF International S.A., was among the international investors that acquired a controlling interest in Edenor through an Argentine holding company named EASA. The concession agreement granted to Edenor was set for 95 years, lasting until 2087. By September 1992, EASA had secured a majority shareholding in the company.
In the early 1990s, Edenor faced significant challenges, particularly with electricity theft, which was rampant in certain areas, especially in shantytowns. The company attempted to mitigate these losses by installing automatic circuit breakers to regulate power usage. However, community and political activists put up opposition, resulting in compromises that allowed people to continue using electricity while trying to limit usage of high-energy appliances.
The 2000s were a period of significant change for Edenor. During this decade, ownership of the company changed hands several times. In 2002, EDF sold a majority stake to the Dolphin Group, which later became part of the Grupo Emes. This group eventually integrated Edenor into Pampa Energía S.A., a major player in Argentina's energy sector.
In the 2010s, Edenor responded to regulation changes and tried to modernize its operations. The Argentine government implemented a Comprehensive Tariff Review in 2017, adjusting electricity rates to reflect operational costs more accurately. This process included public hearings and aimed to address the financial instability of the sector, which had been affected by currency devaluation and inflation.
Edenor also embraced digital transformation during this period, launching the Edenor Digital platform in 2017. This platform, accessible via a website and mobile application, enabled customers to manage their accounts, view and pay bills, and monitor electricity consumption online. The company's modernization efforts also extended to sustainability, as Edenor adopted the United Nations Sustainable Development Goals in 2017 and began piloting renewable energy initiatives.
Financial activity
For the period ending September 30, 2024, Edenor reported a profit of ARS 235,069 million attributable to its shareholders. The company’s total equity was recorded at ARS 1,119,525 million.
In October 2024, Edenor completed a private exchange offer for its 9.75% Senior Notes due 2025. As part of the transaction, the company issued new 9.75% Senior Notes maturing in 2030, with approximately 85.12% of the existing notes tendered and accepted in the exchange. Additionally, Edenor issued an extra US$135 million in new notes.
In November 2024, Fitch Ratings upgraded Edenor’s Foreign and Local Currency Issuer Default Ratings from CCC to CCC+. The company’s bonds were also raised to a B− rating, accompanied by an improved Recovery Rating of RR3.
Edenor shareholder José Luis Manzano, along with partners Daniel Vila and Mauricio Filiberti, agreed in 2026 to buy YPF's roughly 70% stake in Metrogas and MetroEnergía for US $780 million, following a competitive sale process run by Citigroup on YPF's behalf. The deal gave Manzano control of Argentina's largest gas distributor, adding to a 9.23% stake he already held through Integra Gas Distribution, and extended his energy holdings beyond his position in Edenor. The sale was part of YPF's broader strategy under CEO Horacio Marín to divest non-core assets and concentrate investment in Vaca Muerto oil and gas development.
Renewable energy
In March 2018, Edenor became the first company in Argentina to purchase a fully electric vehicle, adding the Renault Kangoo ZE to its fleet in Buenos Aires.
That same year, the company started testing small-scale power generation systems with energy consumption between 10 and 50 kW in Buenos Aires City and Greater Buenos Aires.
Edenor also installed solar panels at their building on Avenida Andrés Rolón in San Isidro, which allowed them to generate and feed electricity back into the grid.
== References ==
Kaynak: Wikipedia (İngilizce), CC BY-SA 4.0 · Wikipedia'da Görüntüle ↗
10 Yıllık Performans Gelir, net kar, marjlar ve EPS trendleri
Değerleme P/E, P/S, P/B, EV/EBITDA oranları — hisse senedi pahalı mı ucuz mu?
| Metrik | 5 Yıllık trend | EDN | 5Y ort. | Akran Ortalaması | Sonuç |
|---|---|---|---|---|---|
| P/E | 0.15Y ort. ≈0.0 | ≈0.0 | · | · |
Akran ortalaması, metrik başına standartlaştırılmış bir temelde hesaplanır ve bu hisse senedi için gösterilen TTM/MRQ temelini her zaman eşleşmeyebilir.
Kârlılık Brüt, faaliyet ve net kâr marjları; ROE, ROA, ROIC
| Metrik | 5 Yıllık trend | EDN | 5Y ort. | Akran Ortalaması | Sonuç |
|---|---|---|---|---|---|
| Gross Margin (Brüt Kar Marjı) | 22.8%5Y ort. ≈12.5% | ≈12.5% | · | · | |
| Operating Margin (Faaliyet Kâr Marjı) | 4.8%5Y ort. ≈-5.9% | ≈-5.9% | · | · | |
| EBITDA Margin (FAVÖK Marjı) | 11.6%5Y ort. ≈2.7% | ≈2.7% | · | · | |
| Pretax Margin (Vergi Öncesi Kar Marjı) | 9.7%5Y ort. ≈7.8% | ≈7.8% | · | · | |
| Net Profit Margin (Net Kâr Marjı) | 8.0%5Y ort. ≈0.17% | ≈0.17% | · | · | |
| ROA | 4.4%5Y ort. ≈0.19% | ≈0.19% | · | · | |
| ROE | 11.4%5Y ort. ≈4.9% | ≈4.9% | · | · | |
| ROIC | 5.3%5Y ort. ≈-37.0% | ≈-37.0% | · | · |
Finansal Sağlık Borç, likidite, solventlik — bilanço gücü
| Metrik | 5 Yıllık trend | EDN | 5Y ort. | Akran Ortalaması | Sonuç |
|---|---|---|---|---|---|
| Current Ratio (Cari Oran) | 1.15Y ort. ≈0.7 | ≈0.7 | · | · | |
| Quick Ratio (Cari Oran) | 0.45Y ort. ≈0.3 | ≈0.3 | · | · | |
| Interest Coverage (Faiz Karşılama Oranı) | 0.55Y ort. ≈0.0 | ≈0.0 | · | · |
Büyüme Gelir, EPS ve net gelir büyümesi: YOY, 3 Yıllık CAGR, 5 Yıllık CAGR
Bu oran grubunu hesaplamak için henüz yeterli temel veriye sahip değil.
Sermaye Verimliliği Aktif devir hızı, stok devir hızı, alacak devir hızı
| Metrik | 5 Yıllık trend | EDN | 5Y ort. | Akran Ortalaması | Sonuç |
|---|---|---|---|---|---|
| Asset Turnover (Aktif Devir Hızı) | 0.55Y ort. ≈0.5 | ≈0.5 | · | · | |
| Receivables Turnover (Alacak Devir Hızı) | 6.05Y ort. ≈6.4 | ≈6.4 | · | · | |
| Revenue / Employee (Çalışan Başına Gelir) | ≈$653.6M | · | · | · |
değer · ≈ 5Y ort. · sektör ortalaması · ortalamaya göre değerlendirme
Kazanç Geçmişi EPS gerçekleşen vs tahmin, sürpriz %, kazanma oranı, bir sonraki kazanç tarihi
| Dönem | Rapor | EPS Gerçek | EPS Tahmin | Sürpriz |
|---|---|---|---|---|
| 31 Aralık 2024 | $42.35 | $-4.24 | 1098.3% | |
| 30 Eylül 2024 | $130.79 | $-0.40 | 32473.8% | |
| 30 Haziran 2024 | $54.02 | $-2.34 | 2405.4% | |
| 31 Mart 2024 | $58.13 | $-2.51 | 2411.4% | |
| 31 Aralık 2023 | $-5.20 | $-3.85 | -35.1% | |
| 31 Mart 2023 | $-272.87 | — | — |
Tüm Temeller Tüm metrikler yıla göre — gelir tablosu, bilanço, nakit akışı
Gelir Tablosu
| Metrik | Eğilim | 2025 | 2024 | 2023 | 2022 | 2021 | 2020 | 2019 | 2018 | 2017 | 2016 |
|---|---|---|---|---|---|---|---|---|---|---|---|
| Revenue | $2.99T | $2.69T | $2.01T | $1.40T | $688.50B | $268.39B | $184.74B | $117.12B | $60.90B | $25.83B | |
| Gross Profit | $680.58B | $519.09B | $79.42B | $50.82B | $88.49B | $39.74B | $34.41B | $27.56B | $14.66B | $573M | |
| Operating Income | $143.14B | $55.35B | $-343.14B | $-211.91B | $-26.67B | $-58.53B | $9.76B | $9.48B | $3.65B | $-2.79B | |
| Interest Expense | $313.71B | $447.81B | $915.07B | $595.22B | $163.54B | $27.26B | $-13.89B | $10.42B | $3.95B | $2.59B | |
| Interest Income | $1.80B | $1.61B | $1.05B | $442M | $395M | $162M | $118M | $176M | $698M | $385M | |
| Pretax Income | $291.33B | $254.26B | $521.88B | $-17.88B | $-34.63B | $-62.49B | $46.85B | $12.93B | $8.60B | $388M | |
| Income Tax | $52.10B | $-103.72B | $270.11B | $26.14B | $94.84B | $-10.47B | $21.92B | $3.93B | $784M | $147M | |
| Net Income | $240.38B | $360.97B | $249.07B | $-46.90B | $-128.69B | $-51.79B | $24.91B | $8.99B | $7.84B | $250M | |
| EPS (Basic) | $273.41 | $409.12 | $287.73 | $-50.30 | $-147.97 | $-59.45 | $18.88 | $10.11 | · | · | |
| EPS (Diluted) | $273.41 | $409.12 | $287.73 | $-50.30 | $-147.97 | · | · | · | · | · | |
| Shares (Diluted) | 875,000,000 | 875,000,000 | 875,000,000 | 875,000,000 | 875,000,000 | 875 | 875,000,000 | 890 | 898,280,000 | 897,043,000 | |
| EBITDA | $346.41B | $196.63B | $-37.03B | $-13.06B | $4.70B | $-13.41B | $3.60B | $3.94B | $2.49B | · |
Bilanço
| Metrik | Eğilim | 2025 | 2024 | 2023 | 2022 | 2021 | 2020 | 2019 | 2018 | 2017 | 2016 |
|---|---|---|---|---|---|---|---|---|---|---|---|
| Cash & Equivalents | $136.91B | $26.55B | $4.00B | $2.70B | $2.96B | $2.47B | $218M | $42M | $-375M | $259M | |
| Receivables | $496.26B | $506.77B | $145.02B | $189.82B | $34.21B | $21.35B | $16.96B | $11.67B | $8.39B | $3.90B | |
| Inventory | $233.31B | $197.02B | $86.70B | $43.66B | $6.70B | $2.82B | $2.62B | $1.94B | $650M | $288M | |
| Current Assets | $1.56T | $1.27T | $505.68B | $565.97B | $81.82B | $35.17B | $24.33B | $21.08B | $13.75B | $6.62B | |
| PP&E (Net) | $4.13T | $3.95T | $3.65T | $2.69T | $1.19T | $367.14B | $208.06B | $130.77B | $119.44B | $50.89B | |
| Total Assets | $5.76T | $5.24T | $3.29T | $3.26T | $463.27B | $224.51B | $162.63B | $118.39B | $70.88B | $18.93B | |
| Accounts Payable | $527.05B | $998.15B | $524.70B | $1.22T | $148.39B | $33.02B | $17.29B | $22.46B | $13.58B | $6.82B | |
| Current Liabilities | $1.46T | $1.43T | $774.64B | $1.35T | $189.96B | $63.62B | $33.46B | $32.26B | $18.52B | $9.56B | |
| Total Liabilities | $3.54T | $3.25T | $2.05T | $2.21T | $319.72B | $129.61B | $82.11B | $70.77B | $43.09B | $18.57B | |
| Retained Earnings | $239.24B | $334.25B | $-18.04B | $-209.43B | $-41.58B | $-26.70B | $16.52B | $20.32B | $8.98B | $-1.19B | |
| Stockholders' Equity | $2.22T | $1.98T | $1.62T | $1.37T | $1.09T | $575.68B | $236.66B | $97.81B | $58.18B | $34.88B |
Nakit Akışı
| Metrik | Eğilim | 2025 | 2024 | 2023 | 2022 | 2021 | 2020 | 2019 | 2018 | 2017 | 2016 |
|---|---|---|---|---|---|---|---|---|---|---|---|
| D&A | $203.27B | $203.32B | $237.06B | $123.38B | $55.21B | $19.11B | $9.50B | $5.36B | · | · | |
| Other Non-cash | $-251.62B | $-183.04B | $-58.71B | $35.13B | $33.46B | $28.45B | · | · | · | · | |
| Operating Cash Flow | $192.04B | $323.50B | $204.74B | $240.24B | $129.50B | $50.94B | $20.87B | $20.14B | $11.17B | $4.97B | |
| CapEx | $368.47B | $473.53B | $343.13B | $215.14B | $89.33B | $28.94B | $19.25B | $17.31B | $12.14B | $4.23B | |
| Investing Cash Flow | $-461.55B | $-746.20B | $-226.48B | $-253.35B | $-154.96B | $-36.60B | $-4.53B | $-17.43B | $-13.08B | $-4.07B | |
| Financing Cash Flow | $435.08B | $348.84B | $21.02B | $-32.29B | $-8.72B | $-18.08B | $-10.42B | $-4.39B | $1.33B | $-947M | |
| Free Cash Flow | $-176.43B | $-114.05B | $-48.31B | $3.70B | $6.62B | $7.49B | $788M | $1.35B | $-349M | · | |
| Levered FCF | $-434.04B | $-593.34B | $-133.12B | $-578.39B | $107.44B | $-232M | $-2.81B | $-2.11B | $587M | · |
Kârlılık
| Metrik | Eğilim | 2025 | 2024 | 2023 | 2022 | 2021 | 2020 | 2019 | 2018 | 2017 | 2016 |
|---|---|---|---|---|---|---|---|---|---|---|---|
| Gross Margin | 22.8% | 19.3% | 4.0% | 3.7% | 12.8% | 14.8% | 18.6% | 23.5% | 27.5% | · | |
| Operating Margin | 4.8% | 2.1% | -17.1% | -15.2% | -3.9% | -21.8% | 4.0% | 7.0% | 10.2% | · | |
| Net Margin | 8.0% | 13.4% | 6.8% | -8.7% | -18.7% | -19.3% | 13.5% | 7.7% | 2.8% | · | |
| Pretax Margin | 9.7% | 9.5% | 26.0% | -1.3% | -5.0% | -23.3% | 25.4% | 11.0% | 4.6% | · | |
| EBITDA Margin | 11.6% | 9.6% | -5.3% | -6.3% | 4.1% | -14.7% | 4.0% | 7.0% | 10.2% | · | |
| ROA | 4.4% | 7.5% | 2.0% | -3.8% | -9.2% | -11.3% | 10.2% | 5.8% | 3.1% | · | |
| ROE | 11.4% | 17.5% | 5.2% | -2.9% | -6.5% | -11.8% | 15.4% | 9.6% | 3.9% | · | |
| ROIC | 5.3% | 3.9% | -7.2% | -164.9% | -22.3% | -26.4% | 3.2% | 8.9% | 142.8% | · |
Likidite ve Solventlik
| Metrik | Eğilim | 2025 | 2024 | 2023 | 2022 | 2021 | 2020 | 2019 | 2018 | 2017 | 2016 |
|---|---|---|---|---|---|---|---|---|---|---|---|
| Current Ratio | 1.1 | 0.9 | 0.7 | 0.4 | 0.4 | 0.6 | 0.7 | 0.7 | 0.7 | · | |
| Quick Ratio | 0.4 | 0.4 | 0.2 | 0.1 | 0.2 | 0.4 | 0.5 | 0.4 | 0.5 | · | |
| Interest Coverage | 0.5 | 0.1 | -0.4 | -0.4 | 0.2 | -2.1 | 0.5 | 0.8 | -1.6 | · |
Verimlilik
| Metrik | Eğilim | 2025 | 2024 | 2023 | 2022 | 2021 | 2020 | 2019 | 2018 | 2017 | 2016 |
|---|---|---|---|---|---|---|---|---|---|---|---|
| Asset Turnover | 0.5 | 0.6 | 0.3 | 0.4 | 0.5 | 0.6 | 0.8 | 0.8 | 1.1 | · | |
| Receivables Turnover | 6.0 | 8.1 | 5.5 | 6.6 | 5.8 | 5.9 | 7.5 | 7.0 | 5.1 | · |
Hisse Başına
| Metrik | Eğilim | 2025 | 2024 | 2023 | 2022 | 2021 | 2020 | 2019 | 2018 | 2017 | 2016 |
|---|---|---|---|---|---|---|---|---|---|---|---|
| Revenue / Share | $3418.16 | $2335.00 | $801.25 | $235240000.00 | $129.71 | $104361142.86 | $102.59 | $62.83 | · | · | |
| Cash Flow / Share | $219.47 | $281.05 | $81.68 | $40486857.14 | $24.40 | $19812571.43 | $11.59 | $10.80 | · | · | |
| EPS (TTM) | $273.41 | $409.12 | $287.73 | $-50.30 | $-147.97 | · | · | · | · | · |
Değerleme (TTM)
| Metrik | Eğilim | 2025 | 2024 | 2023 | 2022 | 2021 | 2020 | 2019 | 2018 | 2017 | 2016 |
|---|---|---|---|---|---|---|---|---|---|---|---|
| Revenue TTM | $2.99T | $2.69T | $2.01T | $1.40T | $688.50B | $268.39B | $184.74B | $117.12B | $60.90B | · | |
| Net Income TTM | $240.38B | $360.97B | $249.07B | $-46.90B | $-128.69B | $-51.79B | $24.91B | $8.99B | $7.84B | · | |
| P/E | 0.1 | 0.1 | 0.1 | -0.2 | -0.0 | · | · | · | · | · | |
| Earnings Yield | 912.6% | 953.4% | 1485.4% | -629.5% | -2791.9% | · | · | · | · | · |
Değerleme (TTM)
| Metrik | Eğilim | Q4 2017 | Q4 2016 | Q4 2015 | Q4 2014 | Q4 2013 | Q4 2012 | Q4 2011 | Q4 2010 | Q4 2009 | Q4 2008 | Q4 2007 |
|---|---|---|---|---|---|---|---|---|---|---|---|---|
| Revenue TTM | $60.90B | $25.83B | $3.80B | · | · | · | · | · | · | · | · | |
| Net Income TTM | $7.84B | $250M | $1.14B | · | · | · | · | · | · | · | · |
En son dönem solda · null değerler · olarak gösterilir
Finansal Tablolar Gelir tablosu, bilanço, nakit akışı — yıllık, son 5 yıl
| Metrik | 2025-12-31 | 2024-12-31 | 2023-12-31 | 2022-12-31 | 2021-12-31 |
|---|---|---|---|---|---|
| Gelir | $2.99T | $2.69T | $2.01T | $1.40T | $688.50B |
| Brüt Kâr Marjı % | 22.8% | 19.3% | 4.0% | 3.7% | 12.8% |
| Faaliyet Kâr Marjı % | 4.8% | 2.1% | -17.1% | -15.2% | -3.9% |
| Net Gelir | $240.38B | $360.97B | $249.07B | $-46.90B | $-128.69B |
| Seyreltilmiş Hisse Başı Kâr | $273.41 | $409.12 | $287.73 | $-50.30 | $-147.97 |
| Metrik | 2025-12-31 | 2024-12-31 | 2023-12-31 | 2022-12-31 | 2021-12-31 |
|---|---|---|---|---|---|
| Cari Oran | 1.1 | 0.9 | 0.7 | 0.4 | 0.4 |
| Cari Oran | 0.4 | 0.4 | 0.2 | 0.1 | 0.2 |
| Metrik | 2025-12-31 | 2024-12-31 | 2023-12-31 | 2022-12-31 | 2021-12-31 |
|---|---|---|---|---|---|
| Serbest Nakit Akışı | $-176.43B | $-114.05B | $-48.31B | $3.70B | $6.62B |
Kurumsal Sahipler (13F) 28 dosya · $48.4M toplam · Tarih itibarıyla 30 Haziran 2026
Çeyreklik SEC Form 13F'lerinde bu hisse senedini tuttuklarını bildiren kurumlar. Yalnızca uzun pozisyonlar; tek bir başvuru sahibi, ayrı opsiyon bacakları için iki kez görünebilir. Büyük dengeleyici alım/satım bacakları genellikle piyasa yapımını veya korunmuş envanteri yansıtır, yönlü bir inancı değil.
| Yeni pozisyonlar | Çıkan pozisyonlar | Artırıldı | Azaldı | Net hisse senedi değişimi |
|---|---|---|---|---|
| 8 (+2 önceki Ç'ye göre) | 8 (+4 önceki Ç'ye göre) | 6 (-4 önceki Ç'ye göre) | 8 (+2 önceki Ç'ye göre) | -408K |
Q1 2026 ile karşılaştırıldı. SEC Form 13F başvuruları, çeyrek sonundan itibaren 45 gün içinde ve geç başvuranlar için kısa bir ek süre içinde tamamlanmalıdır — bu pencere içindeki çeyrekler, en son tam olarak raporlanan çifte tercih edilerek atlanır.
| Kurum | Değer | Hisse senetleri | % izlenen 13F'nin | Tür |
|---|---|---|---|---|
| Helikon Investments Ltd | $15.163.899 | 607.528 | 31,36% | Hisse senetleri |
| MIRAE ASSET GLOBAL ETFS HOLDINGS Ltd. | $14.287.379 | 572.411 | 29,55% | Hisse senetleri |
| PING CAPITAL MANAGEMENT, INC. | $5.952.960 | 238.500 | 12,31% | Hisse senetleri |
| MORGAN STANLEY | $3.087.426 | 123.695 | 6,39% | Hisse senetleri |
| MARSHALL WACE, LLP | $2.271.161 | 90.992 | 4,70% | Hisse senetleri |
| WEXFORD CAPITAL LP | $2.068.860 | 82.887 | 4,28% | Hisse senetleri |
| GOLDMAN SACHS GROUP INC | $1.759.905 | 70.509 | 3,64% | Hisse senetleri |
| Point72 Asset Management, L.P. | $969.996 | 38.862 | 2,01% | Hisse senetleri |
| Brevan Howard Capital Management LP | $427.713 | 16.869 | 0,88% | Hisse senetleri |
| CITADEL ADVISORS LLC | $401.706 | 16.094 | 0,83% | Hisse senetleri |
| UBS Group AG | $326.701 | 13.089 | 0,68% | Hisse senetleri |
| Engineers Gate Manager LP | $265.075 | 10.620 | 0,55% | Hisse senetleri |
| JANE STREET GROUP, LLC | $259.484 | 10.396 | 0,54% | Hisse senetleri |
| Militia Capital Partners, LP | $223.232 | 7.451 | 0,46% | Hisse senetleri |
| Jump Financial, LLC | $219.648 | 8.800 | 0,45% | Hisse senetleri |
| JPMORGAN CHASE & CO | $200.254 | 7.795 | 0,41% | Hisse senetleri |
| Aquatic Capital Management LLC | $192.966 | 7.731 | 0,40% | Hisse senetleri |
| Cubist Systematic Strategies, LLC | $128.370 | 8.250 | 0,27% | Hisse senetleri |
| BNP PARIBAS FINANCIAL MARKETS | $45.427 | 1.820 | 0,09% | Hisse senetleri |
| THURSTON, SPRINGER, MILLER, HERD & TITAK, INC. | $43.962 | 1.761 | 0,09% | Hisse senetleri |
| WELLS FARGO & COMPANY/MN | $24.960 | 1.000 | 0,05% | Hisse senetleri |
| CWM, LLC | $15.520 | 517 | 0,03% | Hisse senetleri |
| GAMMA Investing LLC | $11.906 | 477 | 0,02% | Hisse senetleri |
| SBI Securities Co., Ltd. | $3.045 | 122 | 0,01% | Hisse senetleri |
| Stone House Investment Management, LLC | $824 | 33 | 0,00% | Hisse senetleri |
| BARCLAYS PLC | $574 | 23 | 0,00% | Hisse senetleri |
| Smartleaf Asset Management LLC | $206 | 8 | 0,00% | Hisse senetleri |
| OSAIC HOLDINGS, INC. | $150 | 6 | 0,00% | Hisse senetleri |
Aktivistler ve %5+ sahipler 1 pozisyon
SEC Çizelge 13D dosyalayan yatırımcılar — ihraççı üzerinde nüfuz etme niyetiyle %5'in üzerinde faydalı sahiplik (aktivist hisseler, yönetim kurulu kampanyaları, M&A). Her satır, o başvuru sahibinin pozisyonunun bilinen en son durumunu gösterir.
| Başvuru sahibi | Dosyalandı | Hisse | Durum | Amaç | Başvuru |
|---|---|---|---|---|---|
| Pampa Inversiones S.A., Pampa Energía S.A. (Pampa Energy Inc.) ×6 başvurular | 11 Aralık 2013 | · | İlk başvuru | · | SEC |
Purpose is an automated classification of the filer's own stated purpose (SEC Item 4) — not investment advice. "—" means no clear purpose was stated or the text could not be classified.
ETF sahipliği 1 ETF tarafından tutuluyor
Ağırlık yalnızca doğrudan öz sermaye varlıklarını (N-PORT) yansıtır; kaldıraçlı veya türev tabanlı fonlar gösterilmeyen ek swap pozisyonlarına sahip olabilir.
| Fon | Ağırlık | Birimler | Tarih itibarıyla | Kaynak |
|---|---|---|---|---|
| ARGT · Global X Funds | 1,75% | 552.507 NS | 31 Temmuz 2026 | N-PORT |
EDN Analist Uzlaşması Boğa ve ayı analist görüşleri, 12 aylık fiyat hedefi, yukarı yönlü potansiyel
12 Aylık Fiyat Hedefi
2 analist · 2026-10-03Ortalama hedef $38.50 +93,1%
Metriklerim Kişisel izleme listeniz — Tam Temeller'den seçilen satırlar
Sizin için önemli olan metrikleri seçin — Yukarıdaki Tam Temeller bölümündeki herhangi bir satırın yanındaki + işaretine tıklayın.
Seçiminiz kaydedildi ve tüm hisse senetlerinde sizinle birlikte gelir.