
CMSD CMS Energy Corporation 5.875% Junior Subordinated Notes due 2079
NYSE · Utilities · Переглянути на SEC EDGAR ↗ закриття Жов 2, 2026 10-K/10-Q Лип 28, 2026CMSD Знімок акцій Ціна, ринкова капіталізація, P/E, EPS, ROE, борг/власний капітал, діапазон 52 тижнів
CMSD Графік ціни акцій Денні OHLCV з технічними індикаторами — панування, масштабування та налаштування вашого представлення
Гранулярність стовпчиків адаптується до вибраного періоду — наведіть курсор на графік, щоб побачити відкриття/максимум/мінімум/закриття для стовпчика.
Про CMS Energy Corporation 5.875% Junior Subordinated Notes due 2079 Огляд компанії з Wikipedia
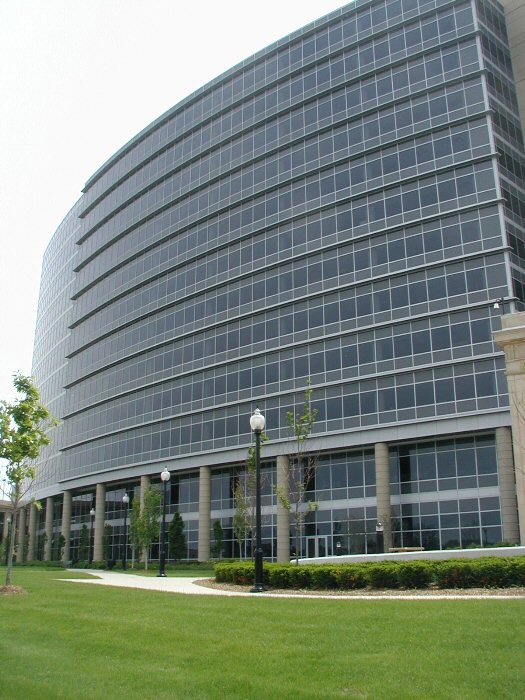
CMS Energy Corporation is an American energy company based in Jackson, Michigan, that is focused principally on utility operations in Michigan. Its principal business is Consumers Energy, a public utility that provides electricity and natural gas to more than 6 million of Michigan's 10 million residents. Its non-utility businesses are focused primarily on domestic independent power production. Consumers Energy has operated since 1886.
NorthStar Clean Energy's primary businesses are independent power production and natural gas transmission.
History
CMS Energy was formed in 1987 as a holding company with its principal subsidiaries as Consumers Energy and NorthStar Clean Energy. On October 23, 1987, CMS Energy became a publicly owned company and was listed at the New York Stock Exchange. The company's history dates back to 1886, when William Augustine Foote and Samuel Jarvis initially approached Jackson, Michigan officials and asked them to support efforts to illuminate Jackson's downtown with electric arc lights. They formed a company, Jackson Electric Light Works in 1888. In 1889, they built a hydro plant project at the Trowbridge Dam on the Kalamazoo River in Allegan. Foote, after seeing some early success, began consolidating his small power companies and formed Commonwealth Power Company.
In 1907, Foote and Jarvis built Croton Hydro project on the Muskegon River, the first project in the world that could transmit 110,000 volts of electricity. In 1920, Foote and Jarvis offered preferred shares of their company to the public to secure sufficient financing to enter other energy and power generation sectors. Over the next decades the company built several coal-fired, natural gas, nuclear and electric facilities. In 1946, the company formed a strategic partnership with Panhandle Company to convert former natural gas fields to underground natural gas storage areas. CMS Energy's primary subsidiary, Consumers Energy, announced Michigan's first nuclear power plant in 1961, Big Rock Point in Charlevoix, Michigan.
The company announced another nuclear plant, Palisades Nuclear Generating Station on Lake Michigan, which first produced electricity in December, 1971 to serve 400,000 people a day. CMS Energy owned the plant until 2006, when it was sold to Entergy. It then announced a gas reforming plant to furnish heat for Michigan homes in 1971. This plant was the first of its kind in North America to produce synthetic gas, converting impure liquid petroleum into pipeline-quality natural gas.
In 1987, CMS Energy, a holding company with its principal subsidiaries as Consumers Power and CMS Enterprises was formed. Consumers Power was rebranded Consumers Energy in 1997. The firm was one of the first companies to introduce an online billing system in the late 1990s.
In 2001, the firm entered into an exploration agreement with Eritrea for oil exploration in the Dismin Block of the Red Sea.
In 2002, CMS Energy founded EnerBank USA.
In 2003, the firm moved its headquarters to One Energy Plaza in Jackson, Michigan. In 2007, the company announced plans to invest $6 billion in Michigan's energy future to support new power plant technology and identify new energy sources. In 2014, Consumers Energy opened Cross Winds Energy Park in Michigan's Tuscola County and signed a contract with General Electric to supply 621.79-kilowatt wind turbine engines for the project which has a total generating capacity of 105 megawatts.
Oct 1, 2021, CMS Energy Completes Sale of EnerBank USA to Regions Bank.
On Nov 1st 2022, CMS Enterprises changes name to NorthStar Clean Energy as it begins to serve more corporate clients.
Sustainability and Environment
In 2015, 9 percent of CMS Energy's power comes from renewable energy sources. Primary CMS Energy subsidiary Consumers Energy joined the Wildlife Habitat Council as an active member. By 2007, all power facilities received the Clean Corporate Citizen award from the Michigan Department of Environmental Quality.
Awards
Consumers Energy, CMS Energy's primary subsidiary, was named Energy Star Partner of the Year in 2014 and 2015 for excellence in sustainable energy efficiency programs. In 2014, Consumers Energy was ranked among the top 15 most sustainable energy providers. Later that year, CMS Energy received Edison Electric Institute's Index Award for top cumulative shareholder return in the small cap category. The firm received the 2015 Emergency Recovery Award for its electricity restoration efforts during the December 2013 North American storm complex.
Criticism
In December 2011, the non-partisan organization Public Campaign criticized CMS Energy for spending $3.48 million on lobbying and not paying any taxes during 2008-2010, instead getting $29 million in tax rebates, despite making a profit of $415 million, and increasing executive pay by 79% to $900.4 million in 2010 for its top 5 executives.
Philanthropy
CMS Energy has helped establish and finance numerous research, educational and cultural institutes in the United States. Consumers Energy was given the William Booth Award in 2013 by The Salvation Army in recognition of its long history of philanthropic activities and leadership for the PeopleCare assistance program.
CMS Energy participates in internship and cooperative education programs to build career opportunities in Michigan. Consumers Energy has also worked on early childhood development and education in Michigan and has also received Wildlife Habitat Council (WHC) compliant certificates for its efforts to promote environmental education.
Джерело: Wikipedia (Англійська), CC BY-SA 4.0 · Переглянути на Wikipedia ↗
10-річна ефективність Тренди виручки, чистого прибутку, маржі та EPS
Оцінка Співвідношення P/E, P/S, P/B, EV/EBITDA — акція дорога чи дешева?
| Метрика | 5-річний тренд | CMSD | середнє за 5 років | Медіана аналогів | Висновок |
|---|---|---|---|---|---|
| P/B (MRQ) | 0.7 | · | · | · |
Медіана аналогічних компаній розраховується на стандартизованій основі для кожного показника і може не завжди відповідати базі TTM/MRQ, показаній для цієї акції.
Прибутковість Валова, операційна та чиста маржа; ROE, ROA, ROIC
Ще недостатньо фундаментальних даних для обчислення цієї групи коефіцієнтів.
Фінансове здоровʼя Борг, ліквідність, платоспроможність — міцність балансу
| Метрика | 5-річний тренд | CMSD | середнє за 5 років | Медіана аналогів | Висновок |
|---|---|---|---|---|---|
| Борг / Власний капітал (MRQ) | 1.9 | · | · | · | |
| Поточний коефіцієнт (MRQ) | 0.9 | · | · | · | |
| Довгостроковий борг / Власний капітал (MRQ) | 1.9 | · | · | · |
Зростання Зростання виручки, EPS та чистого прибутку: рік до року, 3-річний CAGR, 5-річний CAGR
Ще недостатньо фундаментальних даних для обчислення цієї групи коефіцієнтів.
Ефективність капіталу Оборотність активів, оборотність запасів, оборотність дебіторської заборгованості
Ще недостатньо фундаментальних даних для обчислення цієї групи коефіцієнтів.
значення · ≈ середнє за 5 років · медіана галузі · вердикт відносно медіани
Дивіденди Дивідендна дохідність, коефіцієнт виплат, історія дивідендів, 5-річний CAGR
| Дата екс-дивіденду | Сума | Валюта | Дохідність |
|---|---|---|---|
| Сер 17, 2026 | $0,37 | USD | ≈6.9% |
| Тра 15, 2026 | $0,37 | USD | ≈6.4% |
| Лют 13, 2026 | $0,37 | USD | ≈6.2% |
| Лис 14, 2025 | $0,37 | USD | ≈6.1% |
| Сер 15, 2025 | $0,37 | USD | ≈6.3% |
| Тра 16, 2025 | $0,37 | USD | ≈6.7% |
| Лют 14, 2025 | $0,37 | USD | ≈6.2% |
| Лис 15, 2024 | $0,37 | USD | ≈6.0% |
| Сер 16, 2024 | $0,37 | USD | ≈6.0% |
| Тра 16, 2024 | $0,37 | USD | ≈6.0% |
| Лют 14, 2024 | $0,37 | USD | ≈6.0% |
| Лис 15, 2023 | $0,37 | USD | ≈6.2% |
| Сер 16, 2023 | $0,37 | USD | ≈6.2% |
| Тра 16, 2023 | $0,37 | USD | ≈6.1% |
| Лют 13, 2023 | $0,37 | USD | ≈6.0% |
| Лис 15, 2022 | $0,37 | USD | ≈6.2% |
| Сер 16, 2022 | $0,37 | USD | ≈5.8% |
| Тра 16, 2022 | $0,37 | USD | ≈6.0% |
| Лют 11, 2022 | $0,36 | USD | ≈5.6% |
| Лис 15, 2021 | $0,37 | USD | ≈5.5% |
Історія прибутків EPS фактичний проти прогнозу, сюрприз %, коефіцієнт перевищення, дата наступного звіту про прибутки
| Період | Звіт | EPS (факт) | EPS прогноз | Сюрприз |
|---|---|---|---|---|
| 30 червня 2026 р. | $0.37 | $0.36 | 1.6% | |
| 31 березня 2026 р. | $1.13 | $1.11 | 1.9% | |
| 31 грудня 2025 р. | $0.94 | $0.95 | -1.2% | |
| 30 вересня 2025 р. | $0.93 | $0.85 | 8.9% | |
| 30 червня 2025 р. | $0.71 | $0.70 | 2.1% | |
| 31 березня 2025 р. | $1.02 | $1.02 | -0.41% |
Повні фундаментальні показники Усі показники за роками — звіт про прибутки та збитки, баланс, рух грошових коштів
Баланс
| Метрика | Тенденція | 2025 |
|---|---|---|
| Cash & Equivalents | $509M | |
| Other Current Assets | $160M | |
| Current Assets | $3.47B | |
| PP&E (Net) | $30.68B | |
| Accum. Depreciation | $10.13B | |
| Other Non-current Assets | $398M | |
| Total Assets | $39.94B | |
| Current Liabilities | $3.55B | |
| Deferred Tax | $3.25B | |
| Other Non-current Liabilities | $392M | |
| Long-term Debt | $18.76B | |
| Common Stock | $3M | |
| Retained Earnings | $2.44B | |
| AOCI | $-36M | |
| Stockholders' Equity | $9.14B | |
| Liabilities + Equity | $39.94B | |
| Shares Outstanding | 306,400,000 |
Звіт про прибутки та збитки
| Метрика | Тенденція | Q2 2026 | Q1 2026 | Q2 2025 | Q1 2025 |
|---|---|---|---|---|---|
| Revenue | $1.83B | $2.73B | $1.84B | $2.45B | |
| Operating Expenses | $1.56B | $2.24B | $1.52B | $1.95B | |
| Operating Income | $264M | $490M | $317M | $494M | |
| Other Non-op | $75M | $75M | $137M | $50M | |
| Pretax Income | $129M | $362M | $255M | $358M | |
| Income Tax | $33M | $85M | $62M | $63M | |
| Net Income | $120M | $340M | $201M | $304M | |
| EPS (Basic) | $0.38 | $1.10 | $0.67 | $1.01 | |
| EPS (Diluted) | $0.37 | $1.10 | $0.66 | $1.01 | |
| Shares (Basic) | 310,200,000 | 306,400,000 | 298,500,000 | 298,200,000 | |
| Shares (Diluted) | 310,800,000 | 307,100,000 | 299,100,000 | 299,100,000 | |
| EBITDA | $572M | $902M | · | · |
Баланс
| Метрика | Тенденція | Q2 2026 | Q1 2026 | Q2 2025 | Q1 2025 |
|---|---|---|---|---|---|
| Cash & Equivalents | $241M | $175M | · | · | |
| Other Current Assets | $243M | $225M | · | · | |
| Current Assets | $2.87B | $3.02B | · | · | |
| PP&E (Net) | $32.33B | $31.53B | · | · | |
| Accum. Depreciation | $10.50B | $10.38B | · | · | |
| Other Non-current Assets | $302M | $341M | · | · | |
| Total Assets | $40.91B | $40.28B | · | · | |
| Current Liabilities | $3.06B | $3.59B | · | · | |
| Deferred Tax | $3.40B | $3.35B | · | · | |
| Other Non-current Liabilities | $444M | $417M | · | · | |
| Long-term Debt | $19.04B | $18.86B | · | · | |
| Total Debt | $19.04B | $18.86B | · | · | |
| Common Stock | $3M | $3M | · | · | |
| Retained Earnings | $2.55B | $2.60B | · | · | |
| AOCI | $-35M | $-35M | · | · | |
| Stockholders' Equity | $9.77B | $9.47B | · | · | |
| Liabilities + Equity | $40.91B | $40.28B | · | · | |
| Shares Outstanding | 313,600,000 | 308,900,000 | · | · |
Грошовий потік
| Метрика | Тенденція | Q2 2026 | Q1 2026 | Q2 2025 | Q1 2025 |
|---|---|---|---|---|---|
| D&A | $308M | $412M | $288M | $388M | |
| Other Non-cash | · | $-47M | · | · | |
| Operating Cash Flow | $622M | $705M | · | $1.00B | |
| CapEx | $967M | $1.04B | · | $888M | |
| Investing Cash Flow | $-1.02B | $-1.07B | · | $-918M | |
| Debt Issued | $909M | $258M | · | $1.20B | |
| Net Debt Issued | · | $54M | · | · | |
| Stock Issued | $362M | $166M | · | $3M | |
| Net Stock Activity | · | $166M | · | · | |
| Financing Cash Flow | $480M | $16M | · | $266M | |
| Net Change in Cash | $82M | $-352M | · | $348M | |
| Free Cash Flow | · | $-334M | · | · |
Прибутковість
| Метрика | Тенденція | Q2 2026 | Q1 2026 | Q2 2025 | Q1 2025 |
|---|---|---|---|---|---|
| Operating Margin | 14.4% | 17.9% | · | · | |
| Net Margin | 6.6% | 12.4% | · | · | |
| Pretax Margin | 7.0% | 13.3% | · | · | |
| EBITDA Margin | 31.3% | 33.0% | · | · | |
| ROA | 0.31% | 0.89% | · | · | |
| ROE | 1.3% | 3.8% | · | · | |
| ROIC | 0.68% | 1.3% | · | · |
Ліквідність та платоспроможність
| Метрика | Тенденція | Q2 2026 | Q1 2026 | Q2 2025 | Q1 2025 |
|---|---|---|---|---|---|
| Current Ratio | 0.9 | 0.8 | · | · | |
| Quick Ratio | 0.1 | 0.0 | · | · | |
| Debt / Equity | 1.9 | 2.0 | · | · | |
| LT Debt / Equity | 1.9 | 1.8 | · | · |
Ефективність
| Метрика | Тенденція | Q2 2026 | Q1 2026 | Q2 2025 | Q1 2025 |
|---|---|---|---|---|---|
| Asset Turnover | 0.0 | 0.1 | · | · |
На акцію
| Метрика | Тенденція | Q2 2026 | Q1 2026 | Q2 2025 | Q1 2025 |
|---|---|---|---|---|---|
| Book Value / Share | $31.17 | $30.64 | · | · | |
| Revenue / Share | $5.88 | $8.89 | · | · | |
| Cash Flow / Share | · | $2.30 | · | · | |
| Cash / Share | $0.77 | $0.57 | · | · | |
| Dividend / Share | $0.57 | $0.57 | $0.54 | $0.54 | |
| EPS (TTM) | $3.33 | $3.62 | $3.39 | $3.38 |
Оцінка (TTM)
| Метрика | Тенденція | Q2 2026 | Q1 2026 | Q2 2025 | Q1 2025 |
|---|---|---|---|---|---|
| Revenue TTM | $8.81B | $8.82B | $8.02B | $7.79B | |
| Net Income TTM | $1.03B | $1.11B | $1.02B | $1.02B | |
| Market Cap | $6.87B | $6.83B | · | · | |
| Enterprise Value | $25.66B | $25.51B | · | · | |
| P/E | 6.6 | 6.1 | 6.5 | 6.7 | |
| P/S | 0.8 | 0.8 | 0.8 | 0.9 | |
| P/B | 0.7 | 0.7 | · | · | |
| P / Tangible Book | 0.7 | 0.7 | · | · | |
| P / Cash Flow | · | 9.7 | · | · | |
| EV / Revenue | 2.9 | 2.9 | 3.0 | 3.0 | |
| Earnings Yield | 15.2% | 16.4% | 15.3% | 14.8% |
Найновіший період ліворуч · нульові значення показані як ·
Фінансова звітність Звіт про прибутки та збитки, баланс, рух грошових коштів — річні, за останні 5 років
Ще недостатньо фундаментальних даних для побудови цього звіту.
Ще недостатньо фундаментальних даних для побудови цього звіту.
Ще недостатньо фундаментальних даних для побудови цього звіту.
Інституційні власники (13F) 2 подавачі звітності · $20K всього · Станом на 30 червня 2026 р.
Інституційні інвестори, які звітують про володіння цими акціями у своїй квартальній формі SEC 13F. Тільки довгі позиції; один подавець звітності може з'явитися двічі для окремих опціонних контрактів. Великі протилежні опціонні позиції (пут/кол) зазвичай відображають маркет-мейкінг або хеджування запасів, а не спрямованість переконань.
| Нові позиції | Закриті позиції | Збільшено | Зменшено | Зміна чистих акцій |
|---|---|---|---|---|
| 0 (-1 проти попереднього кв.) | 0 (-1 проти попереднього кв.) | 1 (+1 проти попереднього кв.) | 1 (+1 проти попереднього кв.) | +478 |
Порівняно з Q1 2026. Звіти SEC Form 13F подаються протягом 45 днів після закінчення кварталу плюс невеликий буфер для тих, хто подає із запізненням — квартали, що ще знаходяться в цьому вікні, пропускаються на користь останньої повністю звітної пари.
| Інституційний інвестор | Вартість | Акції | % від відстежуваного 13F | Тип |
|---|---|---|---|---|
| First Command Advisory Services, Inc. | $16 075 | 734 | 81,20% | Акції |
| PNC Financial Services Group, Inc. | $3 723 | 170 | 18,80% | Акції |
Інсайдери компанії 1 інсайдер · 1 керівники · 0 директори
| Інсайдер | Роль | Остання активність | Кількість акцій у власності | Купівлі за 12 міс. | Продажі за 12 міс. | Нетто 12 міс |
|---|---|---|---|---|---|---|
| Srikanth Maddipati | EVP/CFO | 31 липня 2026 р. P | 34 895 | 1 | 0 | $14 492 |
Інсайдери згідно з формами SEC 3/4/5; чистий результат = лише відкритий ринок купівлі/продажу
Присутність в ETF Належить 1 ETF
Вага відображає лише прямі акціонерні володіння (N-PORT); фонди з кредитним плечем або похідними інструментами можуть мати додаткову експозицію за свопами, яка не відображається.
| Фонд | Вага | Одиниці | Станом на | Джерело |
|---|---|---|---|---|
| FPE · First Trust Exchange-Traded Fund III | 0,25% | 705 428 NS | 31 липня 2026 р. | N-PORT |
CMSD Консенсус аналітиків Бичачі та ведмежі думки аналітиків, 12-місячна цільова ціна, потенціал зростання
Порівняння з аналогами (підгалузь GICS) Ключові показники порівняно з аналогами в секторі
База за фінансовий рік, ціни на момент закриття останнього фінансового року кожної компанії.
| Тікер | Капіталізація | P/E | Виручка рік до року | Чиста маржа | ROE | Валова маржа |
|---|---|---|---|---|---|---|
| CMSD | · | · | · | · | · | · |
| WEC | $34.32B | 21.9 | 14.0% | 15.9% | 11.2% | · |
| PEG | $39.99B | 19.0 | 18.2% | 17.3% | 12.6% | · |
| AEE | $27.60B | 18.7 | 15.4% | 16.6% | 11.5% | · |
| DTE | · | · | · | · | · | · |
| CNP | $25.03B | 24.0 | 8.3% | 11.2% | 9.5% | · |
| CMS | $21.43B | 19.8 | 13.6% | 12.5% | 12.3% | · |
| NI | $19.98B | 21.4 | 23.5% | 14.2% | 10.2% | · |
| BKH | $5.24B | 17.4 | 8.6% | 12.6% | 8.0% | · |
| NWE | $3.96B | 22.0 | 6.4% | 11.2% | 6.3% | · |
| NWE | $3.96B | 22.0 | 6.4% | 11.2% | 6.3% | · |
Мої показники Ваш персональний список спостереження — вибрані рядки з Повних фундаментальних даних
Виберіть показники, які для вас важливі — натисніть + поруч із будь-яким рядком у розділі Повна фундаментальна інформація вище.
Ваш вибір збережено і він буде застосовуватися до всіх тікерів.