
ONBPO Old National Bancorp - Depositary Shares, Each Representing a 1/40th Interest in a Share of Series C Preferred Stock
Про Old National Bancorp - Depositary Shares, Each Representing a 1/40th Interest in a Share of Series C Preferred Stock Огляд компанії з Wikipedia
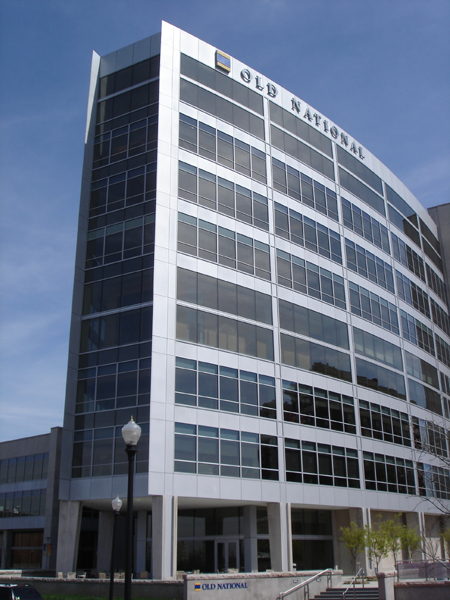
Old National Bank is an American regional bank with nearly 200 retail branches operated by Old National Bancorp and based in Chicago and Evansville, Indiana. With assets at $48.5 billion and 250 banking centers, Old National Bancorp is the largest financial services bank holding company headquartered in Indiana and one of the top 30 banking companies in the U.S. Old National Bank has locations in Illinois, Indiana, Iowa, Kentucky, Michigan, Minnesota, North Dakota, Tennessee, and Wisconsin.
Детальніше
Old National Bank is an American regional bank with nearly 200 retail branches operated by Old National Bancorp and based in Chicago and Evansville, Indiana. With assets at $48.5 billion and 250 banking centers, Old National Bancorp is the largest financial services bank holding company headquartered in Indiana and one of the top 30 banking companies in the U.S. Old National Bank has locations in Illinois, Indiana, Iowa, Kentucky, Michigan, Minnesota, North Dakota, Tennessee, and Wisconsin.
History
The bank was founded in 1834.
In November 1995, Old National acquired the Greencastle-based First United Savings Bank for $18 million in stock. In the following year, Old National acquired the Bloomington-based Workingmens Capital Holdings with its Workingmens Federal Savings Bank subsidiary for an undisclosed amount in stock.
In 2009, Charter One's Indiana bank branches became Old National Bank after Old National Bank bought Charter One's Indiana operations. In January 2011, Old National acquired Bloomington-based Monroe Bancorp with its Monroe Bank subsidiary for $90 million in stock. Later that year, Integra Bank was closed by the Federal Deposit Insurance Corporation and all deposit accounts, excluding certain brokered deposits, were transferred to Old National. In 2012, Old National acquired 24 retail bank branches of Bank of America in Indiana and Michigan. In 2014, Old National acquired four banks: Tower Bank in Fort Wayne, Indiana, United Bank in Ann Arbor, Michigan, Lafayette Savings Bank in Lafayette, Indiana, and Founders Bank & Trust in Grand Rapids, Michigan.
In May 2016, AnchorBank, the third-largest bank based in Wisconsin, was bought by Old National for approximately $461 million.
In August 2017, Old National agreed to buy Anchor Bank of Minnesota for $303 million. The acquisition will add 17 locations in the Twin Cities and 1 in Mankato plus $1.7 billion in deposits and $2.1 billion in assets. In June 2018, KleinBank, based in Chaska, Minnesota, announced its 21 locations were being acquired by Old National, increasing Old National's presence in the western suburbs of Minneapolis.
In 2021, Old National merged with First Midwest Bancorp, combining the companies' assets, retaining the Old National name, and maintaining headquarters in Chicago and Evansville.
On April 10, 2023, a mass shooting at the Louisville, Kentucky branch resulted in five fatalities (all employees) and eight other injured people, including a rookie police officer. The injured officer's partner subsequently killed the perpetrator, who was a current bank employee.
In 2024, it was announced that CapStar Financial Holdings Inc. merged its operations with those of the bank. As a result, CapStar Bank became a division of Old National Bank.
On November 25, 2024, Old National announced its purchase of Minnesota-based Bremer Bank in a $1.4 billion sale which was finalized in October, 2025. The merger created a combined bank worth $70 billion.
Services
The company offers retail banking (checking accounts, savings accounts and certificates of deposit, consumer loans including home mortgages, and small business banking & lending), business or commercial banking (checking accounts, savings accounts & CDs, commercial loans and lines of credit, credit cards, capital markets, treasury management, and merchant services), and wealth management, investment, trust and retirement products and services.
Джерело: Wikipedia (Англійська), CC BY-SA 4.0 · Переглянути на Wikipedia ↗
ONBPO Знімок акцій Ціна, ринкова капіталізація, P/E, EPS, ROE, борг/власний капітал, діапазон 52 тижнів
ONBPO Графік ціни акцій Денні OHLCV з технічними індикаторами — панування, масштабування та налаштування вашого представлення
10-річна ефективність Тренди виручки, чистого прибутку, маржі та EPS
Оцінка Співвідношення P/E, P/S, P/B, EV/EBITDA — акція дорога чи дешева?
Прибутковість Валова, операційна та чиста маржа; ROE, ROA, ROIC
Фінансове здоровʼя Борг, ліквідність, платоспроможність — міцність балансу
Зростання Зростання виручки, EPS та чистого прибутку: рік до року, 3-річний CAGR, 5-річний CAGR
Ефективність капіталу Оборотність активів, оборотність запасів, оборотність дебіторської заборгованості
Дивіденди Дивідендна дохідність, коефіцієнт виплат, історія дивідендів, 5-річний CAGR
| Дата екс-дивіденду | Сума |
|---|---|
| 05 серпня 2026 р. | $0,4380 |
| 05 травня 2026 р. | $0,4380 |
| 05 лютого 2026 р. | $0,4380 |
| 05 листопада 2025 р. | $0,4380 |
| 05 серпня 2025 р. | $0,4380 |
| 05 травня 2025 р. | $0,4380 |
| 05 лютого 2025 р. | $0,4380 |
| 05 листопада 2024 р. | $0,4380 |
| 05 серпня 2024 р. | $0,4380 |
| 02 травня 2024 р. | $0,4380 |
| 02 лютого 2024 р. | $0,4380 |
| 02 листопада 2023 р. | $0,4380 |
| 03 серпня 2023 р. | $0,4380 |
| 04 травня 2023 р. | $0,4380 |
| 02 лютого 2023 р. | $0,4380 |
| 03 листопада 2022 р. | $0,4380 |
| 04 серпня 2022 р. | $0,4380 |
| 04 травня 2022 р. | $0,4380 |
| 03 лютого 2022 р. | $0,4380 |
| 04 листопада 2021 р. | $0,4380 |
ONBPO Консенсус аналітиків Бичачі та ведмежі думки аналітиків, 12-місячна цільова ціна, потенціал зростання
- Активна купівля 2 13,3%
- Купівля 8 53,3%
- Утримувати 5 33,3%
- Продаж 0 0,0%
- Активний продаж 0 0,0%
Історія прибутків EPS фактичний проти прогнозу, сюрприз %, коефіцієнт перевищення, дата наступного звіту про прибутки
| Період | EPS Actual | EPS прогноз | Сюрприз |
|---|---|---|---|
| 30 червня 2026 р. | $0.65 | $0.64 | 0.01% |
| 31 березня 2026 р. | $0.61 | $0.61 | -0.00% |
| 31 грудня 2025 р. | $0.62 | $0.60 | 0.02% |
| 30 вересня 2025 р. | $0.59 | $0.57 | 0.02% |
| 30 червня 2025 р. | $0.53 | $0.52 | 0.01% |
| 31 березня 2025 р. | $0.45 | $0.43 | 0.02% |
Порівняння з аналогами (підгалузь GICS) Ключові показники порівняно з аналогами в секторі
| Тікер | Капіталізація | P/E | Виручка рік до року | Чиста маржа | ROE | Валова маржа |
|---|---|---|---|---|---|---|
| ONBPO | — | — | — | — | — | — |
| FHN | $11.59B | 12.8 | 7.2% | 28.7% | 11.1% | — |
| UMBF | $8.74B | 12.4 | 62.8% | 26.5% | 9.4% | — |
| SSB | $9.33B | 12.0 | 56.1% | 29.8% | 8.9% | — |
| WTFC | $9.36B | 12.3 | 5.9% | 310.1% | 11.4% | — |
| CFR | — | 12.8 | 8.3% | 29.0% | 14.8% | — |
| ONB | $8.69B | 12.5 | — | 26.5% | 8.1% | — |
| ZION | $8.64B | 9.7 | 3.6% | 135.8% | 13.1% | — |
| COLB | $8.26B | 12.2 | 18.8% | 310.7% | 8.5% | — |
| PB | $6.43B | 12.1 | 4.8% | 43.4% | 7.1% | — |
| BOKF | $7.18B | 12.9 | 6.1% | 26.6% | 10.1% | — |
Повні фундаментальні показники Усі показники за роками — звіт про прибутки та збитки, баланс, рух грошових коштів
Звіт про прибутки та збитки 8
| Метрика | Тенденція | Q2 2026 |
|---|---|---|
| Interest Income | $894M | |
| Pretax Income | $324M | |
| Income Tax | $71M | |
| Net Income | $253M | |
| EPS (Basic) | $0.65 | |
| EPS (Diluted) | $0.65 | |
| Shares (Basic) | 381,864,000 | |
| Shares (Diluted) | 383,273,000 |
Баланс 11
| Метрика | Тенденція | Q2 2026 |
|---|---|---|
| Cash & Equivalents | $1.77B | |
| Goodwill | $2.43B | |
| Intangibles | $433M | |
| Total Assets | $74.19B | |
| Total Liabilities | $65.61B | |
| Common Stock | $383M | |
| Retained Earnings | $2.78B | |
| AOCI | $-558M | |
| Stockholders' Equity | $8.58B | |
| Liabilities + Equity | $74.19B | |
| Shares Outstanding | 382,537,000 |
Грошовий потік 10
| Метрика | Тенденція | Q2 2026 |
|---|---|---|
| Stock-based Comp | $9M | |
| Amort. of Intangibles | $24M | |
| Operating Cash Flow | $280M | |
| CapEx | $4M | |
| Investing Cash Flow | $-1.17B | |
| Stock Repurchased | $115M | |
| Dividends Paid | $60M | |
| Financing Cash Flow | $908M | |
| Net Change in Cash | $14M | |
| Taxes Paid | $42M |
Прибутковість 4
| Метрика | Тенденція | Q2 2026 |
|---|---|---|
| Net Margin | 34.6% | |
| Pretax Margin | 44.2% | |
| ROA | 0.35% | |
| ROE | 3.0% |
Ефективність 1
| Метрика | Тенденція | Q2 2026 |
|---|---|---|
| Asset Turnover | 0.0 |
Оцінка (TTM) 8
| Метрика | Тенденція | Q2 2026 |
|---|---|---|
| Revenue TTM | $124M | |
| Net Income TTM | $795M | |
| Market Cap | $9.46B | |
| P/E | 12.1 | |
| P/S | 76.2 | |
| P/B | 1.1 | |
| P / Tangible Book | 1.7 | |
| Earnings Yield | 8.2% |
Фінансова звітність Звіт про прибутки та збитки, баланс, рух грошових коштів — річні, за останні 5 років
Мої показники Ваш персональний список спостереження — вибрані рядки з Повних фундаментальних даних
Виберіть показники, які для вас важливі — натисніть ➕ поруч із будь-яким рядком у Повних фундаментальних даних вище.
Ваш вибір збережено і він буде застосовуватися до всіх тікерів.
Інституційні власники (13F) 1 подавач звітності · $10K всього · Станом на 30 червня 2026 р.
Інституційні інвестори, які звітують про володіння цими акціями у своїй квартальній формі SEC 13F. Тільки довгі позиції; один подавець звітності може з'явитися двічі для окремих опціонних контрактів. Великі протилежні опціонні позиції (пут/кол) зазвичай відображають маркет-мейкінг або хеджування запасів, а не спрямованість переконань.
| Нові позиції | Закриті позиції | Збільшено | Зменшено | Зміна чистих акцій |
|---|---|---|---|---|
| 0 (0 проти попереднього кв.) | 0 (0 проти попереднього кв.) | 0 (0 проти попереднього кв.) | 0 (0 проти попереднього кв.) | 0 |
Порівняно з Q1 2026. Звіти SEC Form 13F подаються протягом 45 днів після закінчення кварталу плюс невеликий буфер для тих, хто подає із запізненням — квартали, що ще знаходяться в цьому вікні, пропускаються на користь останньої повністю звітної пари.
| Інституційний інвестор | Вартість | Акції | % від відстежуваного 13F | Тип |
|---|---|---|---|---|
| Archer Investment Corp | $9 888 | 400 | 100,00% | Акції |
Інсайдери компанії 1 інсайдер · 1 керівники · 0 директори
| Інсайдер | Роль | Остання активність | Кількість акцій у власності | Купівлі за 12 міс. | Продажі за 12 міс. | Нетто 12 міс |
|---|---|---|---|---|---|---|
| Nicholas J Chulos | Chief Legal Officer & Corp Sec | 28 липня 2026 р. S | 53 544 | 0 | 1 | $-533 200 |
Інсайдери згідно з формами SEC 3/4/5; чистий результат = лише відкритий ринок купівлі/продажу
Активісти та власники %+ 5 1 холдинг
Інвестори, які подали Розклад SEC 13D — бенефіціарна власність понад 5% з наміром вплинути на емітента (активістські частки, кампанії в раді директорів, M&A). Кожен рядок показує останній відомий стан позиції цього подавця.
| Подавець | Подано | Частка | Статус | Мета | Подача |
|---|---|---|---|---|---|
| Old National Bancorp | 31 жовтня 2006 р. | — | Первинна подача | M&A / продаж | SEC |
Purpose is an automated classification of the filer's own stated purpose (SEC Item 4) — not investment advice. "—" means no clear purpose was stated or the text could not be classified.
Присутність в ETF Належить 1 ETF
Вага відображає лише прямі акціонерні володіння (N-PORT); фонди з кредитним плечем або похідними інструментами можуть мати додаткову експозицію за свопами, яка не відображається.
| Фонд | Вага | Одиниці | Станом на | Джерело |
|---|---|---|---|---|
| PFLD · ETF Series Solutions | 0,07% | 11 101 NS | 30 квітня 2026 р. | N-PORT |