
CMSA CMS Energy Corporation 5.625% Junior Subordinated Notes due 2078
NYSE · Utilities cerrar Oct 5, 2026CMSA Instantánea de la Acción Precio, capitalización bursátil, P/E, BPA, ROE, deuda/capital, rango de 52 semanas
CMSA Gráfico del Precio de la Acción OHLCV diario con indicadores técnicos — desplace, amplíe y personalice su vista
La granularidad de las barras se adapta al período seleccionado; pase el ratón sobre el gráfico para ver la apertura/máximo/mínimo/cierre de una barra.
Acerca de CMS Energy Corporation 5.625% Junior Subordinated Notes due 2078 Descripción general de la empresa de Wikipedia
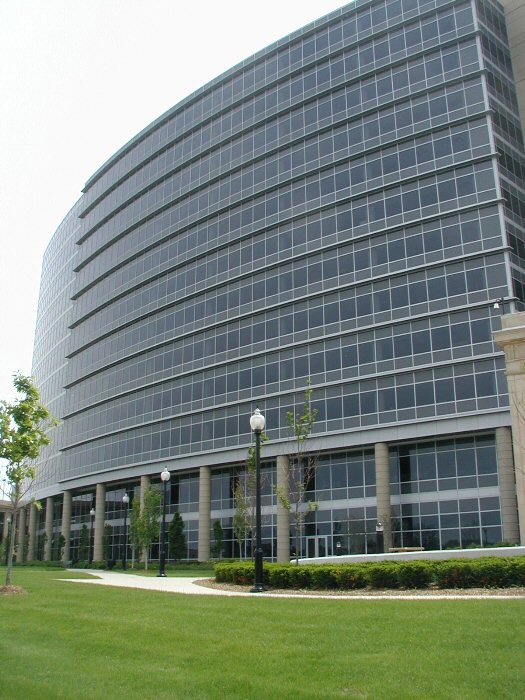
CMS Energy Corporation is an American energy company based in Jackson, Michigan, that is focused principally on utility operations in Michigan. Its principal business is Consumers Energy, a public utility that provides electricity and natural gas to more than 6 million of Michigan's 10 million residents. Its non-utility businesses are focused primarily on domestic independent power production. Consumers Energy has operated since 1886.
NorthStar Clean Energy's primary businesses are independent power production and natural gas transmission.
History
CMS Energy was formed in 1987 as a holding company with its principal subsidiaries as Consumers Energy and NorthStar Clean Energy. On October 23, 1987, CMS Energy became a publicly owned company and was listed at the New York Stock Exchange. The company's history dates back to 1886, when William Augustine Foote and Samuel Jarvis initially approached Jackson, Michigan officials and asked them to support efforts to illuminate Jackson's downtown with electric arc lights. They formed a company, Jackson Electric Light Works in 1888. In 1889, they built a hydro plant project at the Trowbridge Dam on the Kalamazoo River in Allegan. Foote, after seeing some early success, began consolidating his small power companies and formed Commonwealth Power Company.
In 1907, Foote and Jarvis built Croton Hydro project on the Muskegon River, the first project in the world that could transmit 110,000 volts of electricity. In 1920, Foote and Jarvis offered preferred shares of their company to the public to secure sufficient financing to enter other energy and power generation sectors. Over the next decades the company built several coal-fired, natural gas, nuclear and electric facilities. In 1946, the company formed a strategic partnership with Panhandle Company to convert former natural gas fields to underground natural gas storage areas. CMS Energy's primary subsidiary, Consumers Energy, announced Michigan's first nuclear power plant in 1961, Big Rock Point in Charlevoix, Michigan.
The company announced another nuclear plant, Palisades Nuclear Generating Station on Lake Michigan, which first produced electricity in December, 1971 to serve 400,000 people a day. CMS Energy owned the plant until 2006, when it was sold to Entergy. It then announced a gas reforming plant to furnish heat for Michigan homes in 1971. This plant was the first of its kind in North America to produce synthetic gas, converting impure liquid petroleum into pipeline-quality natural gas.
In 1987, CMS Energy, a holding company with its principal subsidiaries as Consumers Power and CMS Enterprises was formed. Consumers Power was rebranded Consumers Energy in 1997. The firm was one of the first companies to introduce an online billing system in the late 1990s.
In 2001, the firm entered into an exploration agreement with Eritrea for oil exploration in the Dismin Block of the Red Sea.
In 2002, CMS Energy founded EnerBank USA.
In 2003, the firm moved its headquarters to One Energy Plaza in Jackson, Michigan. In 2007, the company announced plans to invest $6 billion in Michigan's energy future to support new power plant technology and identify new energy sources. In 2014, Consumers Energy opened Cross Winds Energy Park in Michigan's Tuscola County and signed a contract with General Electric to supply 621.79-kilowatt wind turbine engines for the project which has a total generating capacity of 105 megawatts.
Oct 1, 2021, CMS Energy Completes Sale of EnerBank USA to Regions Bank.
On Nov 1st 2022, CMS Enterprises changes name to NorthStar Clean Energy as it begins to serve more corporate clients.
Sustainability and Environment
In 2015, 9 percent of CMS Energy's power comes from renewable energy sources. Primary CMS Energy subsidiary Consumers Energy joined the Wildlife Habitat Council as an active member. By 2007, all power facilities received the Clean Corporate Citizen award from the Michigan Department of Environmental Quality.
Awards
Consumers Energy, CMS Energy's primary subsidiary, was named Energy Star Partner of the Year in 2014 and 2015 for excellence in sustainable energy efficiency programs. In 2014, Consumers Energy was ranked among the top 15 most sustainable energy providers. Later that year, CMS Energy received Edison Electric Institute's Index Award for top cumulative shareholder return in the small cap category. The firm received the 2015 Emergency Recovery Award for its electricity restoration efforts during the December 2013 North American storm complex.
Criticism
In December 2011, the non-partisan organization Public Campaign criticized CMS Energy for spending $3.48 million on lobbying and not paying any taxes during 2008-2010, instead getting $29 million in tax rebates, despite making a profit of $415 million, and increasing executive pay by 79% to $900.4 million in 2010 for its top 5 executives.
Philanthropy
CMS Energy has helped establish and finance numerous research, educational and cultural institutes in the United States. Consumers Energy was given the William Booth Award in 2013 by The Salvation Army in recognition of its long history of philanthropic activities and leadership for the PeopleCare assistance program.
CMS Energy participates in internship and cooperative education programs to build career opportunities in Michigan. Consumers Energy has also worked on early childhood development and education in Michigan and has also received Wildlife Habitat Council (WHC) compliant certificates for its efforts to promote environmental education.
Fuente: Wikipedia (Inglés), CC BY-SA 4.0 · Ver en Wikipedia ↗
Rendimiento a 10 años Tendencias de ingresos, beneficio neto, márgenes y BPA
Valoración Ratios P/E, P/S, P/B, EV/EBITDA: ¿está la acción cara o barata?
Aún no hay datos fundamentales para este ticker.
Rentabilidad Márgenes brutos, operativos y netos; ROE, ROA, ROIC
Aún no hay datos fundamentales para este ticker.
Salud financiera Deuda, liquidez, solvencia — solidez del balance general
Aún no hay datos fundamentales para este ticker.
Crecimiento Crecimiento de ingresos, BPA y beneficio neto: interanual, CAGR a 3 años, CAGR a 5 años
Aún no hay datos fundamentales para este ticker.
Eficiencia de capital Rotación de activos, rotación de inventario, rotación de cuentas por cobrar
Aún no hay datos fundamentales para este ticker.
valor · ≈ promedio 5A · mediana sectorial · veredicto relativo a la mediana
Dividendos Rendimiento, ratio de pago, historial de dividendos, CAGR a 5 años
| Fecha ex-dividendo | Monto | Moneda | Rendimiento |
|---|---|---|---|
| Ago 31, 2026 | $0,35 | USD | ≈7.0% |
| May 29, 2026 | $0,35 | USD | ≈6.5% |
| Feb 27, 2026 | $0,35 | USD | ≈6.3% |
| Nov 28, 2025 | $0,35 | USD | ≈6.3% |
| Ago 29, 2025 | $0,35 | USD | ≈6.3% |
| May 30, 2025 | $0,35 | USD | ≈6.8% |
| Feb 28, 2025 | $0,35 | USD | ≈6.2% |
| Nov 29, 2024 | $0,35 | USD | ≈5.7% |
| Ago 30, 2024 | $0,35 | USD | ≈5.6% |
| May 31, 2024 | $0,35 | USD | ≈5.9% |
| Feb 28, 2024 | $0,35 | USD | ≈5.7% |
| Nov 29, 2023 | $0,35 | USD | ≈5.9% |
| Ago 30, 2023 | $0,35 | USD | ≈6.1% |
| May 30, 2023 | $0,35 | USD | ≈5.9% |
| Feb 27, 2023 | $0,35 | USD | ≈6.0% |
| Nov 29, 2022 | $0,35 | USD | ≈6.2% |
| Ago 30, 2022 | $0,35 | USD | ≈5.9% |
| May 27, 2022 | $0,35 | USD | ≈5.6% |
| Feb 25, 2022 | $0,35 | USD | ≈5.6% |
| Nov 29, 2021 | $0,35 | USD | ≈5.4% |
Historial de Ganancias EPS real vs estimado, sorpresa %, tasa de aciertos, próxima fecha de resultados
| Período | Informe | EPS Actual | EPS est. | Sorpresa |
|---|---|---|---|---|
| 30 de junio de 2026 | $0.37 | $0.36 | 1.6% | |
| 31 de marzo de 2026 | $1.13 | $1.11 | 1.9% | |
| 31 de diciembre de 2025 | $0.94 | $0.95 | -1.2% | |
| 30 de septiembre de 2025 | $0.93 | $0.85 | 8.9% | |
| 30 de junio de 2025 | $0.71 | $0.70 | 2.1% | |
| 31 de marzo de 2025 | $1.02 | $1.02 | -0.41% |
Propietarios institucionales (13F) 1 declarante · $8K total · A fecha de 30 de junio de 2026
Instituciones que informan tener esta acción en su Formulario 13F trimestral de la SEC. Solo posiciones largas; un solo presentador puede aparecer dos veces para tramos de opciones separados. Las patas de put/call de compensación grandes suelen reflejar la creación de mercado o el inventario cubierto, no la convicción direccional.
| Nuevas posiciones | Posiciones cerradas | Aumentado | Disminuido | Cambio neto de acciones |
|---|---|---|---|---|
| 0 | 0 | 1 | 0 | · |
Comparado con Q1 2026. Las presentaciones del Formulario 13F de la SEC vencen dentro de los 45 días posteriores al final del trimestre, más un pequeño margen para los presentadores tardíos; los trimestres que aún se encuentran dentro de esa ventana se omiten en favor del par más reciente completamente reportado. Cambio vs trimestre anterior no mostrado: la cobertura de los presentadores difiere demasiado entre estos dos trimestres para una comparación fiable.
| Institución | Valor | Acciones | % de 13F rastreadas | Tipo |
|---|---|---|---|---|
| First Command Advisory Services, Inc. | $8 022 | 384 | 100,00% | Acciones |
Informantes de la empresa 12 insiders · 10 directivos · 3 consejeros
| Insider | Rol | Última actividad | Acciones en propiedad | Compras 12m | Ventas 12m | Neto 12m |
|---|---|---|---|---|---|---|
| Garrick J Rochow | President and CEO | 26 de marzo de 2026 F | 637 918 | 0 | 0 | $0 |
| Tonya L Berry | Executive Vice President & COO | 26 de marzo de 2026 F | 70 105 | 0 | 0 | $0 |
| Lauren Y Snyder | Senior Vice President | 26 de marzo de 2026 F | 16 596 | 0 | 0 | $0 |
| Scott B Mcintosh | VP, Controller, CAO | 26 de marzo de 2026 F | 24 054 | 0 | 1 | $-136 850 |
| Shaun M Johnson | Executive Vice President & CLO | 26 de marzo de 2026 F | 109 325 | 0 | 0 | $0 |
| Shannon Thomas | Senior Vice President | 29 de enero de 2026 A | 7 757 | 0 | 0 | $0 |
| Leeroy Wells Jr | Senior Vice President | 21 de marzo de 2025 F | 84 348 | 0 | 0 | $0 |
| Brian F Rich | Senior Vice President | 1 de agosto de 2024 S | 94 490 | 0 | 0 | $0 |
| Dhenuvakonda Rao Venkat | Senior Vice President | 26 de enero de 2023 A | 38 826 | 0 | 0 | $0 |
| Jean-Francois Brossoit | Senior Vice President | 10 de marzo de 2021 S | 55 660 | 0 | 0 | $0 |
| Richard Patrick Keyes | Consejero | 8 de mayo de 2026 A | 3 180 | 0 | 0 | $0 |
| Myrna Soto | Consejero | 8 de mayo de 2026 A | 41 023 | 0 | 0 | $0 |
Informantes de las presentaciones SEC Form 3/4/5; neto = solo P/S de mercado abierto
CMSA Consenso de analistas Opiniones de analistas alcistas y bajistas, precio objetivo a 12 meses, potencial alcista
Comparación de pares (subindustria GICS) Métricas clave frente a competidores del sector
Base del ejercicio fiscal, precios al cierre del último ejercicio fiscal de cada empresa.
| Ticker | Capitalización Bursátil | P/E | Ingresos interanuales | Margen Neto | ROE | Margen Bruto |
|---|---|---|---|---|---|---|
| CMSA | · | · | · | · | · | · |
| WEC | $34.32B | 21.9 | 14.0% | 15.9% | 11.2% | · |
| PEG | $39.99B | 19.0 | 18.2% | 17.3% | 12.6% | · |
| AEE | $27.60B | 18.7 | 15.4% | 16.6% | 11.5% | · |
| DTE | · | · | · | · | · | · |
| CNP | $25.03B | 24.0 | 8.3% | 11.2% | 9.5% | · |
| CMS | $21.43B | 19.8 | 13.6% | 12.5% | 12.3% | · |
| NI | $19.98B | 21.4 | 23.5% | 14.2% | 10.2% | · |
| BKH | $5.24B | 17.4 | 8.6% | 12.6% | 8.0% | · |
| NWE | $3.96B | 22.0 | 6.4% | 11.2% | 6.3% | · |
| NWE | $3.96B | 22.0 | 6.4% | 11.2% | 6.3% | · |
Últimas noticias Noticias recientes que mencionan a esta empresa
Mis Métricas Tu lista de seguimiento personal — filas seleccionadas de Fundamentales Completos
Seleccione las métricas que le importan: haga clic en el + junto a cualquier fila en Fundamentales completos arriba.
Tu selección se guarda y te sigue en todos los tickers.