
CRBD Corebridge Financial Inc. 6.375% Junior Subordinated Notes due 2064
NYSE · Financial Services · Ver en SEC EDGAR ↗ cerrar Oct 2, 2026 10-K/10-Q Ago 5, 2026CRBD Instantánea de la Acción Precio, capitalización bursátil, P/E, BPA, ROE, deuda/capital, rango de 52 semanas
CRBD Gráfico del Precio de la Acción OHLCV diario con indicadores técnicos — desplace, amplíe y personalice su vista
La granularidad de las barras se adapta al período seleccionado; pase el ratón sobre el gráfico para ver la apertura/máximo/mínimo/cierre de una barra.
Acerca de Corebridge Financial Inc. 6.375% Junior Subordinated Notes due 2064 Descripción general de la empresa de Wikipedia
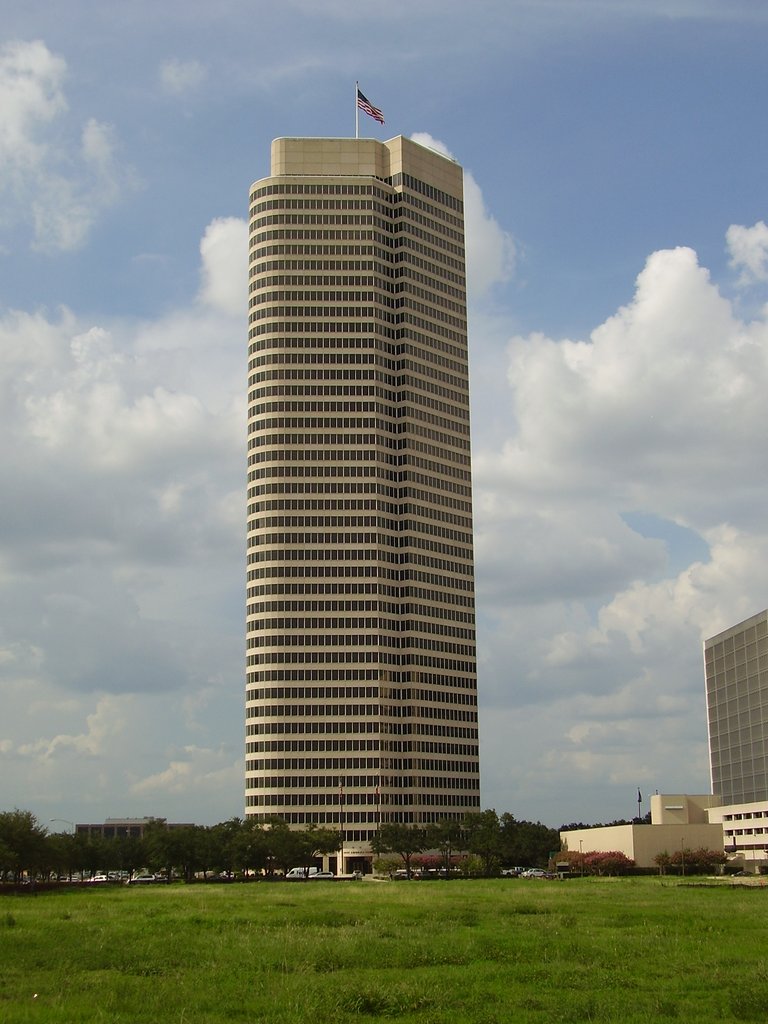
Corebridge Financial, Inc. is an American financial services company. It provides annuities, life insurance, retirement plans, wealth management, and other financial services through its four core businesses—individual retirement, life insurance, retirement services, and institutional markets.
Corebridge was formed by an AIG spin-off of the company via IPO in 2022. In 2024, Nippon Life Insurance Company acquired an equity interest in Corebridge Financial from AIG. In 2025, the company joined the Fortune 500.
History
Corebridge Financial was formed when AIG spun off the company in September 2022. In September 2024, the Corebridge brand name replaced AIG on the America Tower of the American General Center, its headquarters. In May 2026, AIG agreed to sell its remaining shares in Corebridge Financial, the culmination of a five-year separation process.
Early history
The American General Insurance Company was formed on May 8, 1926 by Gus Sessions Wortham in Houston, Texas. Wortham worked for the Texas Fire Rating Board in Austin, Texas before moving to Houston in 1912. Before starting American General, he worked at his father's insurance company, John L. Wortham & Son Agency, until his death in 1924. Following his father's death, Wortham began the company in response to a Texas Commissions of Appeal ruling allowing that insurance companies may merge several lines of business.
In 1953, American General hired life insurance veteran Benjamin N. Woodson as president. Woodson previously served at Mutual Trust Life Insurance Company, the National Association of Life Underwriters, and various other roles. Woodson would eventually succeed Wortham as CEO of the company in 1972 where he remained until retiring in 1978.
In 1995, the company was the subject of Unitrin, Inc. v. American General Corp. American General tendered an offer for a controlling block of shares of Unitrin. The Board of Directors of Unitrin, who held 23% of the shares, did not think the price offered was adequate and so initiated a poison pill and offered a buyback to increase their holdings to 28% of the total shares. It became the leading case on a board of directors' ability to use defensive measures, such as poison pills or buybacks, to prevent a hostile takeover.
NLT Corporation
The NLT Corporation was formed in 1900 as the National Sick and Accident Association. The Nashville, Tennessee firm became one of the country's largest life insurance companies. American General (AGC) announced a hostile takeover bid for NLT, which made a counter-offer to buy out AGC. In 1982, AGC, which had owned Nashville rival L&C since the 1960s, prevailed. Having acquired NLT, AGC merged the former rivals over the next decade and spun off the non-core assets of NLT, particularly its entertainment properties. The Grand Ole Opry, Opryland theme park, WSM, and then fledgling cable television network The Nashville Network (TNN) were sold to what became Gaylord Entertainment Company.
Acquisitions
In 1977, American General acquired The Variable Annuity Life Insurance Company (VALIC), a provider of tax-deferred retirement plans for employees in education, healthcare, government, and non-profit organizations. VALIC companies include VALIC Financial Advisors, Inc. and VALIC Retirement Services Company, which operate as Corebridge Financial subsidiaries within Corebridge Retirement Services.
In 1983, American General acquired Gulf United's insurance operations.
AIG agreed to acquire annuity provider SunAmerica Inc. in 1998, with the $18 billion stock transaction then reported as the second-largest in the history of the insurance industry.
In 2001, it was announced that American General would be acquired by Prudential plc in a deal worth $26.6 billion. The deal was later called off after negative Prudential shareholder reaction. After the deal failed to go through, AIG announced plans to acquire American General for $23 billion in stock. American General would continue to operate under AIG as their life insurance and retirement services subsidiary. In 2003, Old Line Life Insurance merged with American General.
IPO and spin-off from AIG
Corebridge was formed as a result of a spin-off of AIG's retirement, life insurance, and wealth management segments. In 2020, AIG announced plans to perform the spin-off with a 2022 IPO. In July 2021, the company announced that Blackstone Group would acquire 9.9% of the new unit for $2.2 billion cash. Blackstone and AIG also entered a long-term asset management agreement for about one quarter of AIG's life and retirement portfolio, set to increase in subsequent years. The new company was launched on September 15, 2022, in the largest IPO of 2022 to date, which raised a total of $1.68 billion.
In September 2023, it was announced Corebridge would sell its subsidiary, the London-headquartered life insurance company AIG Life Limited (AIG Life UK) to the British multinational insurance company, Aviva for £460 million. Corebridge sold subsidiary Irish health insurer Laya Healthcare to AXA, for €650 million, on October 31, 2023.
In 2024, Nippon Life Insurance Company acquired an equity interest in Corebridge Financial from AIG. On December 31, 2025, Nippon became the company's largest shareholder, with a 24.6% stake.
In June 2025, Corebridge entered into an agreement with Venerable Holdings subsidiary Corporate Solutions Life Reinsurance Company to reinsure all variable annuities of its individual retirement business, valued at $51 billion as of March 31, 2025. The transaction was valued at $2.8 billion and closed in stages, in August 2025, and in January 2026.
In March 2026, Corebridge Financial announced a merger with Equitable Holdings through an all-stock merger worth $22 billion, which would create a combined company with $1.5 trillion in assets under management and over 12 million clients.
Corebridge was included among the Fortune 500 and the S&P 400 in 2025.
The company was ranked first among annuity providers in the JD Power 2026 Life & Annuity Distribution Partner Experience Study.
PGA of America
The company is the official life insurance and retirement partner of the PGA of America, as originally formed in 2019 under AIG. The Corebridge Financial team is a group of PGA of America golf professionals that qualify to play in the PGA Championship by placing in the Top 20 of the PGA Professional Championship. Michael Block has been a consistent member of this team, including when he famously hit a hole-in-one at the 2023 PGA Championship at Oak Hill.
Fuente: Wikipedia (Inglés), CC BY-SA 4.0 · Ver en Wikipedia ↗
Rendimiento a 10 años Tendencias de ingresos, beneficio neto, márgenes y BPA
Valoración Ratios P/E, P/S, P/B, EV/EBITDA: ¿está la acción cara o barata?
| Métrica | Tendencia a 5 años | CRBD | promedio 5A | Mediana de Pares | Veredicto |
|---|---|---|---|---|---|
| P/C (MRQ) | 0.9 | · | · | · |
La mediana de empresas comparables se calcula sobre una base estandarizada por métrica y puede no coincidir siempre con la base TTM/MRQ que se muestra para esta acción.
Rentabilidad Márgenes brutos, operativos y netos; ROE, ROA, ROIC
Aún no hay datos fundamentales para este ticker.
Salud financiera Deuda, liquidez, solvencia — solidez del balance general
| Métrica | Tendencia a 5 años | CRBD | promedio 5A | Mediana de Pares | Veredicto |
|---|---|---|---|---|---|
| Deuda / Patrimonio (MRQ) | 0.1 | · | · | · |
Crecimiento Crecimiento de ingresos, BPA y beneficio neto: interanual, CAGR a 3 años, CAGR a 5 años
Aún no hay datos fundamentales para este ticker.
Eficiencia de capital Rotación de activos, rotación de inventario, rotación de cuentas por cobrar
Aún no hay datos fundamentales para este ticker.
valor · ≈ promedio 5A · mediana sectorial · veredicto relativo a la mediana
Dividendos Rendimiento, ratio de pago, historial de dividendos, CAGR a 5 años
| Fecha ex-dividendo | Monto | Moneda | Rendimiento |
|---|---|---|---|
| Sep 1, 2026 | $0,40 | USD | ≈7.6% |
| Jun 1, 2026 | $0,40 | USD | ≈7.0% |
| Feb 27, 2026 | $0,40 | USD | ≈6.8% |
| Dic 1, 2025 | $0,40 | USD | ≈7.3% |
| Ago 29, 2025 | $0,40 | USD | ≈5.4% |
| May 30, 2025 | $0,40 | USD | ≈3.9% |
| Feb 28, 2025 | $0,50 | USD | ≈2.0% |
Historial de Ganancias EPS real vs estimado, sorpresa %, tasa de aciertos, próxima fecha de resultados
| Período | Informe | EPS Actual | EPS est. | Sorpresa |
|---|---|---|---|---|
| 30 de junio de 2026 | $1.12 | $1.11 | 0.58% | |
| 31 de marzo de 2026 | $1.05 | $1.06 | -0.73% | |
| 31 de diciembre de 2025 | $1.22 | $1.13 | 7.8% | |
| 30 de septiembre de 2025 | $0.96 | $1.11 | -13.8% | |
| 30 de junio de 2025 | $1.36 | $1.18 | 15.5% | |
| 31 de marzo de 2025 | $1.16 | $1.17 | -0.45% |
Fundamentales Completos Todas las métricas por año — estado de resultados, balance general, flujo de caja
Aún no tenemos presentaciones de la SEC para este ticker.
Estado de resultados
| Métrica | Tendencia | Q2 2026 | Q1 2026 | Q1 2025 |
|---|---|---|---|---|
| Revenue | $3.91B | $3.96B | $3.57B | |
| SG&A Expense | $466M | $468M | $526M | |
| Interest Expense | $131M | $131M | $148M | |
| Pretax Income | $52M | $97M | $-862M | |
| Income Tax | $50M | $158M | $-205M | |
| Net Income | $2M | $-53M | $-664M | |
| EPS (Basic) | $-0.04 | $-0.11 | $-1.19 | |
| EPS (Diluted) | $-0.04 | $-0.11 | $-1.19 | |
| Shares (Basic) | 454,200,000 | 473,500,000 | 558,000,000 | |
| Shares (Diluted) | 454,200,000 | 473,500,000 | 558,000,000 | |
| EBITDA | · | $165M | · |
Balance general
| Métrica | Tendencia | Q2 2026 | Q1 2026 | Q1 2025 |
|---|---|---|---|---|
| Cash & Equivalents | $353M | $373M | · | |
| Total Assets | $415.79B | $407.06B | · | |
| Short-term Debt | $1.25B | · | · | |
| Total Liabilities | $404.42B | $395.52B | · | |
| Total Debt | $1.25B | · | · | |
| Retained Earnings | $18.07B | $18.20B | · | |
| Treasury Stock | $5.91B | $5.61B | · | |
| AOCI | $-10.17B | $-10.43B | · | |
| Stockholders' Equity | $10.65B | $10.80B | · | |
| Liabilities + Equity | $415.79B | $407.06B | · | |
| Shares Outstanding | 445,768,608 | 456,727,266 | · |
Flujo de Efectivo
| Métrica | Tendencia | Q2 2026 | Q1 2026 | Q1 2025 |
|---|---|---|---|---|
| D&A | $173M | $165M | $89M | |
| Other Non-cash | · | $-121M | · | |
| Operating Cash Flow | $-44M | $-9M | $375M | |
| Investing Cash Flow | $1.56B | $-2.53B | $-3.87B | |
| Stock Repurchased | $300M | $1.25B | $321M | |
| Net Stock Activity | · | $-1.25B | · | |
| Dividends Paid | $112M | $114M | $133M | |
| Financing Cash Flow | $-1.54B | $2.47B | $3.07B | |
| Net Change in Cash | $-20M | $-75M | $-425M | |
| Taxes Paid | $17M | $-5M | $11M |
Rentabilidad
| Métrica | Tendencia | Q2 2026 | Q1 2026 | Q1 2025 |
|---|---|---|---|---|
| Net Margin | 0.05% | -1.3% | · | |
| Pretax Margin | 1.3% | 2.5% | · | |
| EBITDA Margin | · | 4.2% | · | |
| ROA | 0.00% | -0.01% | · | |
| ROE | 0.02% | -0.47% | · |
Liquidez y Solvencia
| Métrica | Tendencia | Q2 2026 | Q1 2026 | Q1 2025 |
|---|---|---|---|---|
| Debt / Equity | 0.1 | · | · |
Eficiencia
| Métrica | Tendencia | Q2 2026 | Q1 2026 | Q1 2025 |
|---|---|---|---|---|
| Asset Turnover | 0.0 | 0.0 | · |
Por Acción
| Métrica | Tendencia | Q2 2026 | Q1 2026 | Q1 2025 |
|---|---|---|---|---|
| Book Value / Share | $23.89 | $23.66 | · | |
| Revenue / Share | $8.62 | $8.37 | · | |
| Cash Flow / Share | · | $-0.02 | · | |
| Cash / Share | $0.79 | $0.82 | · | |
| Dividend / Share | $0.25 | $0.25 | · | |
| EPS (TTM) | $1.56 | $0.40 | · |
Valoración (TTM)
| Métrica | Tendencia | Q2 2026 | Q1 2026 | Q1 2025 |
|---|---|---|---|---|
| Revenue TTM | $20.02B | $18.84B | · | |
| Net Income TTM | $907M | $245M | · | |
| Market Cap | $10.23B | $10.40B | · | |
| Enterprise Value | $11.12B | · | · | |
| P/E | 14.7 | 56.9 | · | |
| P/S | 0.5 | 0.6 | · | |
| P/B | 1.0 | 1.0 | · | |
| P / Tangible Book | 1.0 | 1.0 | · | |
| P / Cash Flow | · | -1155.5 | · | |
| EV / Revenue | 0.6 | · | · | |
| Dividend Yield | 4.6% | 4.7% | · | |
| Earnings Yield | 6.8% | 1.8% | · | |
| Payout Ratio | · | -215.1% | · | |
| Annual Payout | $473M | $492M | · |
Período más reciente a la izquierda · valores nulos mostrados como ·
Estados Financieros Estado de resultados, balance general, flujo de caja — anual, últimos 5 años
Aún no hay suficientes datos fundamentales para generar este estado.
Aún no hay suficientes datos fundamentales para generar este estado.
Aún no hay suficientes datos fundamentales para generar este estado.
Propietarios institucionales (13F) 3 declarantes · $938K total · A fecha de 30 de junio de 2026
Instituciones que informan tener esta acción en su Formulario 13F trimestral de la SEC. Solo posiciones largas; un solo presentador puede aparecer dos veces para tramos de opciones separados. Las patas de put/call de compensación grandes suelen reflejar la creación de mercado o el inventario cubierto, no la convicción direccional.
| Nuevas posiciones | Posiciones cerradas | Aumentado | Disminuido | Cambio neto de acciones |
|---|---|---|---|---|
| 0 (-1 vs trimestre anterior) | 0 (-1 vs trimestre anterior) | 1 (+1 vs trimestre anterior) | 1 (+1 vs trimestre anterior) | +506 |
Comparado con Q1 2026. Las presentaciones del Formulario 13F de la SEC vencen dentro de los 45 días posteriores al final del trimestre, más un pequeño margen para los presentadores tardíos; los trimestres que aún se encuentran dentro de esa ventana se omiten en favor del par más reciente completamente reportado.
| Institución | Valor | Acciones | % de 13F rastreadas | Tipo |
|---|---|---|---|---|
| IAT REINSURANCE CO LTD. | $914 000 | 80 000 | 97,46% | Acciones |
| First Command Advisory Services, Inc. | $16 918 | 733 | 1,80% | Acciones |
| PNC Financial Services Group, Inc. | $6 928 | 302 | 0,74% | Acciones |
Activistas y propietarios del %+ 5 1 tenencia
Inversores que presentaron el Anexo 13D de la SEC — propiedad beneficiosa superior al % 5 con la intención de influir en el emisor (participaciones activistas, campañas de la junta directiva, M&A). Cada fila muestra el estado conocido más reciente de la posición de ese declarante.
| Declarante | Presentado | Participación | Estado | Propósito | Presentación |
|---|---|---|---|---|---|
| Nippon Life Insurance Company ×3 presentaciones | 7 de agosto de 2026 | 27,40% | Enmienda | · | SEC |
Purpose is an automated classification of the filer's own stated purpose (SEC Item 4) — not investment advice. "—" means no clear purpose was stated or the text could not be classified.
Informantes de la empresa 11 insiders · 2 directivos · 7 consejeros
| Insider | Rol | Última actividad | Acciones en propiedad | Compras 12m | Ventas 12m | Neto 12m |
|---|---|---|---|---|---|---|
| David Ditillo | Chief Information Officer | 11 de septiembre de 2026 S | 102 417 | 0 | 3 | $-830 508 |
| Elizabeth B Cropper | EVP & Chief Human Res. Officer | 19 de agosto de 2026 S | 46 473 | 0 | 1 | $-256 050 |
| Keith Gubbay | Consejero | 18 de junio de 2026 A | 13 894 | 0 | 0 | $0 |
| Deborah R Leone | Consejero | 18 de junio de 2026 A | 19 136 | 0 | 0 | $0 |
| Amy L. Schioldager | Consejero | 18 de junio de 2026 A | 34 962 | 0 | 0 | $0 |
| Colin J. Parris | Consejero | 18 de junio de 2026 A | 13 894 | 0 | 0 | $0 |
| Alan B. Colberg | Consejero | 18 de junio de 2026 A | 64 962 | 0 | 0 | $0 |
| Christopher S. Lynch | Consejero | 18 de junio de 2026 A | 34 962 | 0 | 0 | $0 |
| Edward Peter Bousa | Consejero | 18 de junio de 2026 A | 16 852 | 0 | 0 | $0 |
| Nippon Life Insurance Company | Propietario del 10% | 30 de septiembre de 2026 P | 126 144 687 | 17 | 0 | $135 510 802 |
| Corebridge Financial, Inc. | · | 9 de septiembre de 2026 J | 0 | 0 | 0 | $0 |
Informantes de las presentaciones SEC Form 3/4/5; neto = solo P/S de mercado abierto
Propiedad de ETFs Mantenido por 3 ETFs
El peso refleja solo las tenencias directas de acciones (N-PORT); los fondos apalancados o basados en derivados pueden tener exposición adicional a swaps no mostrada.
CRBD Consenso de analistas Opiniones de analistas alcistas y bajistas, precio objetivo a 12 meses, potencial alcista
Comparación de pares (subindustria GICS) Métricas clave frente a competidores del sector
Base del ejercicio fiscal, precios al cierre del último ejercicio fiscal de cada empresa.
| Ticker | Capitalización Bursátil | P/E | Ingresos interanuales | Margen Neto | ROE | Margen Bruto |
|---|---|---|---|---|---|---|
| CRBD | · | · | · | · | · | · |
| APO | $83.81B | 26.1 | 22.7% | 10.9% | 17.2% | · |
| CRBG | · | -44.4 | -1.2% | · | · | · |
| EQH | · | -9.9 | -6.1% | · | · | · |
| JXN | $7.13B | -444.4 | 104.3% | 0.40% | 0.27% | · |
| VOYA | $6.99B | 11.8 | 1.7% | 8.0% | 14.6% | · |
| ALRS | $572M | 33.1 | 1.1% | 7.8% | 3.3% | · |
| SOR | · | · | · | · | · | · |
| NEWT | · | · | · | · | · | · |
Mis Métricas Tu lista de seguimiento personal — filas seleccionadas de Fundamentales Completos
Seleccione las métricas que le importan: haga clic en el + junto a cualquier fila en Fundamentales completos arriba.
Tu selección se guarda y te sigue en todos los tickers.