
ONBPO Old National Bancorp - Depositary Shares, Each Representing a 1/40th Interest in a Share of Series C Preferred Stock
Acerca de Old National Bancorp - Depositary Shares, Each Representing a 1/40th Interest in a Share of Series C Preferred Stock Descripción general de la empresa de Wikipedia
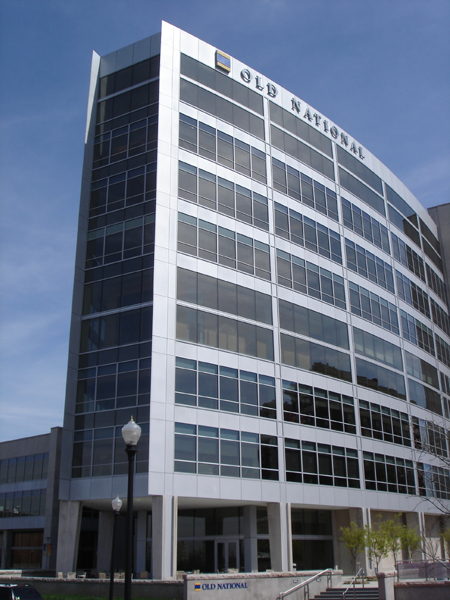
Old National Bank is an American regional bank with nearly 200 retail branches operated by Old National Bancorp and based in Chicago and Evansville, Indiana. With assets at $48.5 billion and 250 banking centers, Old National Bancorp is the largest financial services bank holding company headquartered in Indiana and one of the top 30 banking companies in the U.S. Old National Bank has locations in Illinois, Indiana, Iowa, Kentucky, Michigan, Minnesota, North Dakota, Tennessee, and Wisconsin.
Leer más
Old National Bank is an American regional bank with nearly 200 retail branches operated by Old National Bancorp and based in Chicago and Evansville, Indiana. With assets at $48.5 billion and 250 banking centers, Old National Bancorp is the largest financial services bank holding company headquartered in Indiana and one of the top 30 banking companies in the U.S. Old National Bank has locations in Illinois, Indiana, Iowa, Kentucky, Michigan, Minnesota, North Dakota, Tennessee, and Wisconsin.
History
The bank was founded in 1834.
In November 1995, Old National acquired the Greencastle-based First United Savings Bank for $18 million in stock. In the following year, Old National acquired the Bloomington-based Workingmens Capital Holdings with its Workingmens Federal Savings Bank subsidiary for an undisclosed amount in stock.
In 2009, Charter One's Indiana bank branches became Old National Bank after Old National Bank bought Charter One's Indiana operations. In January 2011, Old National acquired Bloomington-based Monroe Bancorp with its Monroe Bank subsidiary for $90 million in stock. Later that year, Integra Bank was closed by the Federal Deposit Insurance Corporation and all deposit accounts, excluding certain brokered deposits, were transferred to Old National. In 2012, Old National acquired 24 retail bank branches of Bank of America in Indiana and Michigan. In 2014, Old National acquired four banks: Tower Bank in Fort Wayne, Indiana, United Bank in Ann Arbor, Michigan, Lafayette Savings Bank in Lafayette, Indiana, and Founders Bank & Trust in Grand Rapids, Michigan.
In May 2016, AnchorBank, the third-largest bank based in Wisconsin, was bought by Old National for approximately $461 million.
In August 2017, Old National agreed to buy Anchor Bank of Minnesota for $303 million. The acquisition will add 17 locations in the Twin Cities and 1 in Mankato plus $1.7 billion in deposits and $2.1 billion in assets. In June 2018, KleinBank, based in Chaska, Minnesota, announced its 21 locations were being acquired by Old National, increasing Old National's presence in the western suburbs of Minneapolis.
In 2021, Old National merged with First Midwest Bancorp, combining the companies' assets, retaining the Old National name, and maintaining headquarters in Chicago and Evansville.
On April 10, 2023, a mass shooting at the Louisville, Kentucky branch resulted in five fatalities (all employees) and eight other injured people, including a rookie police officer. The injured officer's partner subsequently killed the perpetrator, who was a current bank employee.
In 2024, it was announced that CapStar Financial Holdings Inc. merged its operations with those of the bank. As a result, CapStar Bank became a division of Old National Bank.
On November 25, 2024, Old National announced its purchase of Minnesota-based Bremer Bank in a $1.4 billion sale which was finalized in October, 2025. The merger created a combined bank worth $70 billion.
Services
The company offers retail banking (checking accounts, savings accounts and certificates of deposit, consumer loans including home mortgages, and small business banking & lending), business or commercial banking (checking accounts, savings accounts & CDs, commercial loans and lines of credit, credit cards, capital markets, treasury management, and merchant services), and wealth management, investment, trust and retirement products and services.
Fuente: Wikipedia (Inglés), CC BY-SA 4.0 · Ver en Wikipedia ↗
ONBPO Instantánea de la Acción Precio, capitalización bursátil, P/E, BPA, ROE, deuda/capital, rango de 52 semanas
ONBPO Gráfico del Precio de la Acción OHLCV diario con indicadores técnicos — desplace, amplíe y personalice su vista
Rendimiento a 10 años Tendencias de ingresos, beneficio neto, márgenes y BPA
Valoración Ratios P/E, P/S, P/B, EV/EBITDA: ¿está la acción cara o barata?
Rentabilidad Márgenes brutos, operativos y netos; ROE, ROA, ROIC
Salud financiera Deuda, liquidez, solvencia — solidez del balance general
Crecimiento Crecimiento de ingresos, BPA y beneficio neto: interanual, CAGR a 3 años, CAGR a 5 años
Eficiencia de capital Rotación de activos, rotación de inventario, rotación de cuentas por cobrar
Dividendos Rendimiento, ratio de pago, historial de dividendos, CAGR a 5 años
| Fecha ex-dividendo | Monto |
|---|---|
| 5 de agosto de 2026 | $0,4380 |
| 5 de mayo de 2026 | $0,4380 |
| 5 de febrero de 2026 | $0,4380 |
| 5 de noviembre de 2025 | $0,4380 |
| 5 de agosto de 2025 | $0,4380 |
| 5 de mayo de 2025 | $0,4380 |
| 5 de febrero de 2025 | $0,4380 |
| 5 de noviembre de 2024 | $0,4380 |
| 5 de agosto de 2024 | $0,4380 |
| 2 de mayo de 2024 | $0,4380 |
| 2 de febrero de 2024 | $0,4380 |
| 2 de noviembre de 2023 | $0,4380 |
| 3 de agosto de 2023 | $0,4380 |
| 4 de mayo de 2023 | $0,4380 |
| 2 de febrero de 2023 | $0,4380 |
| 3 de noviembre de 2022 | $0,4380 |
| 4 de agosto de 2022 | $0,4380 |
| 4 de mayo de 2022 | $0,4380 |
| 3 de febrero de 2022 | $0,4380 |
| 4 de noviembre de 2021 | $0,4380 |
ONBPO Consenso de analistas Opiniones de analistas alcistas y bajistas, precio objetivo a 12 meses, potencial alcista
- Compra fuerte 2 13,3%
- Compra 8 53,3%
- Mantener 5 33,3%
- Venta 0 0,0%
- Venta fuerte 0 0,0%
Historial de Ganancias EPS real vs estimado, sorpresa %, tasa de aciertos, próxima fecha de resultados
| Período | EPS Actual | EPS est. | Sorpresa |
|---|---|---|---|
| 30 de junio de 2026 | $0.65 | $0.64 | 0.01% |
| 31 de marzo de 2026 | $0.61 | $0.61 | -0.00% |
| 31 de diciembre de 2025 | $0.62 | $0.60 | 0.02% |
| 30 de septiembre de 2025 | $0.59 | $0.57 | 0.02% |
| 30 de junio de 2025 | $0.53 | $0.52 | 0.01% |
| 31 de marzo de 2025 | $0.45 | $0.43 | 0.02% |
Comparación de pares (subindustria GICS) Métricas clave frente a competidores del sector
| Ticker | Capitalización Bursátil | P/E | Ingresos interanuales | Margen Neto | ROE | Margen Bruto |
|---|---|---|---|---|---|---|
| ONBPO | — | — | — | — | — | — |
| FHN | $11.59B | 12.8 | 7.2% | 28.7% | 11.1% | — |
| UMBF | $8.74B | 12.4 | 62.8% | 26.5% | 9.4% | — |
| SSB | $9.33B | 12.0 | 56.1% | 29.8% | 8.9% | — |
| WTFC | $9.36B | 12.3 | 5.9% | 310.1% | 11.4% | — |
| CFR | — | 12.8 | 8.3% | 29.0% | 14.8% | — |
| ONB | $8.69B | 12.5 | — | 26.5% | 8.1% | — |
| ZION | $8.64B | 9.7 | 3.6% | 135.8% | 13.1% | — |
| COLB | $8.26B | 12.2 | 18.8% | 310.7% | 8.5% | — |
| PB | $6.43B | 12.1 | 4.8% | 43.4% | 7.1% | — |
| BOKF | $7.18B | 12.9 | 6.1% | 26.6% | 10.1% | — |
Fundamentales Completos Todas las métricas por año — estado de resultados, balance general, flujo de caja
Estado de resultados 8
| Métrica | Tendencia | Q2 2026 |
|---|---|---|
| Interest Income | $894M | |
| Pretax Income | $324M | |
| Income Tax | $71M | |
| Net Income | $253M | |
| EPS (Basic) | $0.65 | |
| EPS (Diluted) | $0.65 | |
| Shares (Basic) | 381,864,000 | |
| Shares (Diluted) | 383,273,000 |
Balance general 11
| Métrica | Tendencia | Q2 2026 |
|---|---|---|
| Cash & Equivalents | $1.77B | |
| Goodwill | $2.43B | |
| Intangibles | $433M | |
| Total Assets | $74.19B | |
| Total Liabilities | $65.61B | |
| Common Stock | $383M | |
| Retained Earnings | $2.78B | |
| AOCI | $-558M | |
| Stockholders' Equity | $8.58B | |
| Liabilities + Equity | $74.19B | |
| Shares Outstanding | 382,537,000 |
Flujo de Efectivo 10
| Métrica | Tendencia | Q2 2026 |
|---|---|---|
| Stock-based Comp | $9M | |
| Amort. of Intangibles | $24M | |
| Operating Cash Flow | $280M | |
| CapEx | $4M | |
| Investing Cash Flow | $-1.17B | |
| Stock Repurchased | $115M | |
| Dividends Paid | $60M | |
| Financing Cash Flow | $908M | |
| Net Change in Cash | $14M | |
| Taxes Paid | $42M |
Rentabilidad 4
| Métrica | Tendencia | Q2 2026 |
|---|---|---|
| Net Margin | 34.6% | |
| Pretax Margin | 44.2% | |
| ROA | 0.35% | |
| ROE | 3.0% |
Eficiencia 1
| Métrica | Tendencia | Q2 2026 |
|---|---|---|
| Asset Turnover | 0.0 |
Valoración (TTM) 8
| Métrica | Tendencia | Q2 2026 |
|---|---|---|
| Revenue TTM | $124M | |
| Net Income TTM | $795M | |
| Market Cap | $9.46B | |
| P/E | 12.1 | |
| P/S | 76.2 | |
| P/B | 1.1 | |
| P / Tangible Book | 1.7 | |
| Earnings Yield | 8.2% |
Estados Financieros Estado de resultados, balance general, flujo de caja — anual, últimos 5 años
Mis Métricas Tu lista de seguimiento personal — filas seleccionadas de Fundamentales Completos
Elige las métricas que te importan — haz clic en el ➕ junto a cualquier fila en Fundamentales Completos arriba.
Tu selección se guarda y te sigue en todos los tickers.
Propietarios institucionales (13F) 1 declarante · $10K total · A fecha de 30 de junio de 2026
Instituciones que informan tener esta acción en su Formulario 13F trimestral de la SEC. Solo posiciones largas; un solo presentador puede aparecer dos veces para tramos de opciones separados. Las patas de put/call de compensación grandes suelen reflejar la creación de mercado o el inventario cubierto, no la convicción direccional.
| Nuevas posiciones | Posiciones cerradas | Aumentado | Disminuido | Cambio neto de acciones |
|---|---|---|---|---|
| 0 (0 vs trimestre anterior) | 0 (0 vs trimestre anterior) | 0 (0 vs trimestre anterior) | 0 (0 vs trimestre anterior) | 0 |
Comparado con Q1 2026. Las presentaciones del Formulario 13F de la SEC vencen dentro de los 45 días posteriores al final del trimestre, más un pequeño margen para los presentadores tardíos; los trimestres que aún se encuentran dentro de esa ventana se omiten en favor del par más reciente completamente reportado.
| Institución | Valor | Acciones | % de 13F rastreadas | Tipo |
|---|---|---|---|---|
| Archer Investment Corp | $9 888 | 400 | 100,00% | Acciones |
Informantes de la empresa 1 insider · 1 directivos · 0 consejeros
| Insider | Rol | Última actividad | Acciones en propiedad | Compras 12m | Ventas 12m | Neto 12m |
|---|---|---|---|---|---|---|
| Nicholas J Chulos | Chief Legal Officer & Corp Sec | 28 de julio de 2026 S | 53 544 | 0 | 1 | $-533 200 |
Informantes de las presentaciones SEC Form 3/4/5; neto = solo P/S de mercado abierto
Activistas y propietarios del %+ 5 1 tenencia
Inversores que presentaron el Anexo 13D de la SEC — propiedad beneficiosa superior al % 5 con la intención de influir en el emisor (participaciones activistas, campañas de la junta directiva, M&A). Cada fila muestra el estado conocido más reciente de la posición de ese declarante.
| Declarante | Presentado | Participación | Estado | Propósito | Presentación |
|---|---|---|---|---|---|
| Old National Bancorp | 31 de octubre de 2006 | — | Presentación inicial | M&A / venta | SEC |
Purpose is an automated classification of the filer's own stated purpose (SEC Item 4) — not investment advice. "—" means no clear purpose was stated or the text could not be classified.
Propiedad de ETFs Mantenido por 1 ETF
El peso refleja solo las tenencias directas de acciones (N-PORT); los fondos apalancados o basados en derivados pueden tener exposición adicional a swaps no mostrada.
| Fondo | Ponderación | Unidades | A fecha de | Fuente |
|---|---|---|---|---|
| PFLD · ETF Series Solutions | 0,07% | 11 101 NS | 30 de abril de 2026 | N-PORT |