
VMRK Vivmark Residential Common Shares of Beneficial Interest
NYSE · Ver en SEC EDGAR ↗ 10-K/10-Q Abr 30, 2025VMRK Instantánea de la Acción Precio, capitalización bursátil, P/E, BPA, ROE, deuda/capital, rango de 52 semanas
VMRK Gráfico del Precio de la Acción OHLCV diario con indicadores técnicos — desplace, amplíe y personalice su vista
La granularidad de las barras se adapta al período seleccionado; pase el ratón sobre el gráfico para ver la apertura/máximo/mínimo/cierre de una barra.
| Fecha ex-dividendo | División | Tipo |
|---|---|---|
| 12 de octubre de 2001 | 2-for-1 | Adelante |
Acerca de Vivmark Residential Common Shares of Beneficial Interest Descripción general de la empresa de Wikipedia
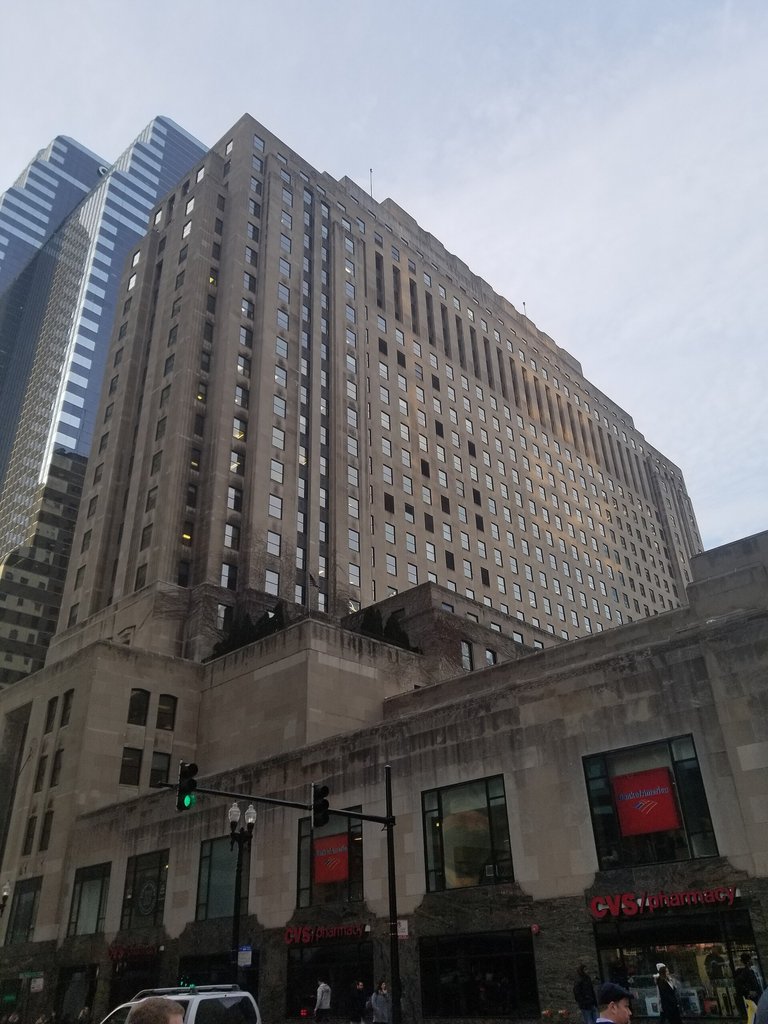
Vivmark Residential (formerly Equity Residential), based in Arlington, Virginia, and Chicago, Illinois, is a real estate investment trust that invests in apartments. As of August 2026, the company owned or had investments in 184,000 rental apartments and had over 11,100 apartments under construction.
It is the largest owner of apartments in the United States and the 18th largest apartment property manager in the United States.
History
The company had its origins in Equity Finance and Management Company, founded in 1969 by Sam Zell. In 1993, the company acquired a large portfolio of properties from Starwood Capital Group, owned by Barry Sternlicht and Bob Faith, in exchange for a 20% stake in the company. Starwood had acquired the properties via government auctions after the savings and loan crisis. In August 1993, the company became a public company via an initial public offering. At that time, the company owned 22,000 apartments.
In 1997, the company acquired Wellsford Residential Property Trust for $620 million in stock and the assumption of $346 million of debt. It also acquired Evans Withycombe Residential for $625 million in stock and the assumption of $432 million in debt.
In 1998, the company acquired a portfolio of 5,774 apartments from Lincoln Property Company for $465 million. It also acquired Merry Land, which owned 34,990 units in the southeast United States, for $1.17 billion in stock as well as $656 million in debt and $270 million in preferred stock.
In 1999, the company acquired Lexford Residential Trust for $203 million in stock and the assumption of $530 million of debt. Lexford owned mainly one-story affordable housing units, rented to households with incomes between $25,000 and $35,000.
In January 2003, CEO Douglas Crocker retired. During his tenure, the company increased its ownership from 22,000 apartments to 227,000 apartments. In 2006, the company sold its Lexford affordable housing division, which included 27,115 apartment units, for $1.09 billion.
In February 2013, the company and AvalonBay Communities closed a $9 billion deal to acquire Archstone from Lehman Brothers. In 2013, the company sold 8,010 apartment units to a joint venture of Goldman Sachs and Greystar Real Estate Partners for $1.5 billion. In 2016, the company sold 23,262 apartments to Starwood Capital Group for $5.365 billion.
In August 2026, the company acquired AvalonBay Communities and changed its name to Vivmark Residential.
Legal issues
In 2022, the company agreed to pay approximately $2 million to settle a lawsuit filed by Attorney General for the District of Columbia Karl Racine alleging that the company offered misleading rent discounts on a rent-controlled building in Washington, D.C.
The company was sued in a class action due to allegations that the late payment fees that it charged, including a $50 minimum fee even if rent was just one day late, and compounding fees and penalties, were in violation of California law. In a settlement finalized in 2026, the company agreed to pay $43 million to over 200,000 tenants in California as reimbursement of excessive fees.
In a multi-district class action lawsuit, the company and 10 other large landlords were accused of engaging in an unlawful conspiracy to use RealPage's revenue management software to share competitively sensitive data and coordinate rent increases. In 2026, as part of a settlement with all of the defendants, the company agreed to pay $56 million to settle the allegations.
Fuente: Wikipedia (Inglés), CC BY-SA 4.0 · Ver en Wikipedia ↗
Rendimiento a 10 años Tendencias de ingresos, beneficio neto, márgenes y BPA
Valoración Ratios P/E, P/S, P/B, EV/EBITDA: ¿está la acción cara o barata?
Aún no hay datos fundamentales para este ticker.
Rentabilidad Márgenes brutos, operativos y netos; ROE, ROA, ROIC
Aún no hay datos fundamentales para este ticker.
Salud financiera Deuda, liquidez, solvencia — solidez del balance general
Aún no hay datos fundamentales para este ticker.
Crecimiento Crecimiento de ingresos, BPA y beneficio neto: interanual, CAGR a 3 años, CAGR a 5 años
Aún no hay datos fundamentales para este ticker.
Eficiencia de capital Rotación de activos, rotación de inventario, rotación de cuentas por cobrar
Aún no hay datos fundamentales para este ticker.
valor · ≈ promedio 5A · mediana sectorial · veredicto relativo a la mediana
Dividendos Rendimiento, ratio de pago, historial de dividendos, CAGR a 5 años
| Fecha ex-dividendo | Monto | Moneda | Rendimiento |
|---|---|---|---|
| Oct 5, 2026 | $0,70 | USD | ≈4.7% |
| Jun 29, 2026 | $0,70 | USD | ≈4.1% |
| Mar 30, 2026 | $0,70 | USD | ≈4.7% |
| Ene 2, 2026 | $0,69 | USD | ≈4.5% |
| Sep 25, 2025 | $0,69 | USD | ≈4.3% |
| Jun 24, 2025 | $0,69 | USD | ≈4.1% |
| Mar 31, 2025 | $0,69 | USD | ≈3.8% |
| Ene 2, 2025 | $0,68 | USD | ≈3.9% |
| Sep 24, 2024 | $0,68 | USD | ≈3.6% |
| Jul 1, 2024 | $0,68 | USD | ≈3.9% |
| Mar 22, 2024 | $0,68 | USD | ≈4.3% |
| Dic 29, 2023 | $0,66 | USD | ≈4.3% |
| Sep 25, 2023 | $0,66 | USD | ≈4.4% |
| Jun 23, 2023 | $0,66 | USD | ≈4.1% |
| Mar 24, 2023 | $0,66 | USD | ≈4.5% |
| Dic 30, 2022 | $0,63 | USD | ≈4.2% |
| Sep 23, 2022 | $0,63 | USD | ≈3.6% |
| Jun 24, 2022 | $0,63 | USD | ≈3.4% |
| Mar 25, 2022 | $0,63 | USD | ≈2.7% |
| Dic 31, 2021 | $0,60 | USD | ≈2.7% |
Historial de Ganancias EPS real vs estimado, sorpresa %, tasa de aciertos, próxima fecha de resultados
| Período | Informe | EPS Actual | EPS est. | Sorpresa |
|---|---|---|---|---|
| 30 de junio de 2026 | $0.31 | $0.44 | -29.7% | |
| 31 de marzo de 2026 | $0.24 | $0.32 | -24.7% | |
| 31 de diciembre de 2025 | $1.00 | $0.40 | 153.2% | |
| 30 de septiembre de 2025 | $0.76 | $0.45 | 70.1% |
Fundamentales Completos Todas las métricas por año — estado de resultados, balance general, flujo de caja
Aún no tenemos presentaciones de la SEC para este ticker.
Por Acción
| Métrica | Tendencia | Q4 2025 |
|---|---|---|
| EPS (TTM) | $2.29 |
Valoración (TTM)
| Métrica | Tendencia | Q4 2025 |
|---|---|---|
| Revenue TTM | $2.70B | |
| Net Income TTM | $873M |
Período más reciente a la izquierda · valores nulos mostrados como ·
Informantes de la empresa 31 insiders · 15 directivos · 17 consejeros
| Insider | Rol | Última actividad | Acciones en propiedad | Compras 12m | Ventas 12m | Neto 12m |
|---|---|---|---|---|---|---|
| Benjamin Schall | President & CEO | 17 de agosto de 2026 A | · | 0 | 0 | $0 |
| Kevin P. O'Shea | Executive Vice President & CFO | 17 de agosto de 2026 A | · | 0 | 0 | $0 |
| Michael L Manelis | Executive Vice President & COO | 17 de agosto de 2026 A | 44 713 | 0 | 1 | $-503 226 |
| Sean Thomas Willson | Senior Vice President & CAO | 21 de agosto de 2026 S | 17 988 | 0 | 2 | $-35 973 |
| Matthew H. Birenbaum | Executive Vice President & CDO | 20 de agosto de 2026 G | 272 749 | 0 | 0 | $0 |
| Pamela Rogers Thomas | EVP, Portfolio & Asset Mgmt | 17 de agosto de 2026 A | 85 543 | 0 | 0 | $0 |
| Alaine Susan Walsh | EVP, Human Capital & Admin | 17 de agosto de 2026 A | · | 0 | 0 | $0 |
| Scott Fenster | EVP & General Counsel | 17 de agosto de 2026 A | · | 0 | 0 | $0 |
| Sean J. Breslin | EVP & CI & GO | 17 de agosto de 2026 A | · | 0 | 0 | $0 |
| Edward M Schulman | EVP, Legal Affairs | 17 de agosto de 2026 A | 48 776 | 0 | 1 | $-1 066 893 |
| Ian Kaufman | Chief Accounting Officer | 14 de agosto de 2026 A | 29 657 | 0 | 0 | $0 |
| Christa L Sorenson | Executive Vice President | 10 de febrero de 2020 S | 3 939 | 0 | 0 | $0 |
| Bruce C Strohm | EVP & General Counsel | 22 de diciembre de 2014 M | 2 179 | 0 | 0 | $0 |
| Gregory H Smith | Executive Vice President | 8 de febrero de 2006 S | 46 064 | 0 | 0 | $0 |
| Edward J Geraghty | Executive Vice President | 19 de agosto de 2003 S | 78 797 | 0 | 0 | $0 |
| Ann Hoff | Consejero | 17 de agosto de 2026 A | 6 330 | 0 | 0 | $0 |
| Nina P Jones | Consejero | 17 de agosto de 2026 A | 3 404 | 0 | 0 | $0 |
| Christopher B. Howard | Consejero | 17 de agosto de 2026 A | 12 730 | 0 | 1 | $-543 104 |
| Chris Carr | Consejero | 17 de agosto de 2026 A | 5 591 | 0 | 0 | $0 |
| Susan Swanezy | Consejero | 17 de agosto de 2026 A | 28 934 | 0 | 1 | $-1 001 660 |
| Terry S. Brown | Consejero | 17 de agosto de 2026 A | · | 0 | 0 | $0 |
| Conor C Flynn | Consejero | 17 de agosto de 2026 A | · | 0 | 0 | $0 |
| Angela M Aman | Consejero | 17 de agosto de 2026 A | · | 0 | 0 | $0 |
| Stephen E Sterrett | Consejero | 17 de agosto de 2026 A | 20 773 | 0 | 0 | $0 |
| David J Neithercut | Consejero | 17 de agosto de 2026 A | · | 0 | 0 | $0 |
| Timothy J Naughton | Consejero | 17 de agosto de 2026 A | 314 301 | 0 | 0 | $0 |
| Charles E Mueller JR | Consejero | 17 de agosto de 2026 A | 16 084 | 0 | 1 | $-511 200 |
| Mary Kay Haben | Consejero | 17 de agosto de 2026 A | 9 477 | 0 | 0 | $0 |
| Gerald A Spector | Consejero | 28 de febrero de 2013 A | 282 191 | 0 | 0 | $0 |
| Stephen O Evans | Consejero | 28 de febrero de 2006 A | 7 644 | 0 | 0 | $0 |
| Michael N Thompson | Consejero | 27 de febrero de 2004 A | 12 777 | 0 | 0 | $0 |
Informantes de las presentaciones SEC Form 3/4/5; neto = solo P/S de mercado abierto
Propiedad de ETFs Mantenido por 59 ETFs
El peso refleja solo las tenencias directas de acciones (N-PORT); los fondos apalancados o basados en derivados pueden tener exposición adicional a swaps no mostrada.
| Fondo | Ponderación | Unidades | A fecha de | Fuente |
|---|---|---|---|---|
| REZ · iShares Trust | 8,65% | 1 095 687 SH | 11 de septiembre de 2026 | Diario |
| ICF · iShares Trust | 4,77% | 1 448 479 SH | 11 de septiembre de 2026 | Diario |
| USRT · iShares Trust | 4,28% | 2 912 473 SH | 11 de septiembre de 2026 | Diario |
| IYR · iShares Trust | 3,59% | 2 258 051 SH | 11 de septiembre de 2026 | Diario |
| RSPR · Invesco Exchange-Traded Fund Trust | 3,27% | 43 465 | 28 de octubre de 2026 | Diario |
| REET · iShares Trust | 2,78% | 2 075 131 SH | 11 de septiembre de 2026 | Diario |
| ERET · iShares Trust | 2,73% | 5 650 SH | 11 de septiembre de 2026 | Diario |
| SPHD · Invesco Exchange-Traded Fund Trust … | 1,75% | 936 925 | 28 de octubre de 2026 | Diario |
| PABU · iShares Trust | 1,44% | 554 426 SH | 11 de septiembre de 2026 | Diario |
| IIGD · Invesco Exchange-Traded Self-Indexe… | 1,27% | 326 000 | 28 de octubre de 2026 | Diario |
| SPLV · Invesco Exchange-Traded Fund Trust … | 0,97% | 1 140 817 | 28 de octubre de 2026 | Diario |
| RDIV · Invesco Exchange-Traded Fund Trust … | 0,57% | 131 054 | 28 de octubre de 2026 | Diario |
| IWS · iShares Trust | 0,49% | 1 136 811 SH | 11 de septiembre de 2026 | Diario |
| IMCV · iShares Trust | 0,40% | 70 805 SH | 11 de septiembre de 2026 | Diario |
| SIZE · iShares Trust | 0,38% | 24 910 SH | 11 de septiembre de 2026 | Diario |
| IWR · iShares Trust | 0,36% | 3 117 549 SH | 11 de septiembre de 2026 | Diario |
| IMCB · iShares Trust | 0,33% | 85 059 SH | 11 de septiembre de 2026 | Diario |
| QUAL · iShares Trust | 0,29% | 2 111 212 SH | 11 de septiembre de 2026 | Diario |
| IMCG · iShares Trust | 0,27% | 163 022 SH | 11 de septiembre de 2026 | Diario |
| XOEF · iShares Trust | 0,27% | 910 SH | 11 de septiembre de 2026 | Diario |
| BSCQ · Invesco Exchange-Traded Self-Indexe… | 0,26% | 7 556 000 | 28 de octubre de 2026 | Diario |
| EUSA · iShares, Inc. | 0,21% | 60 634 SH | 11 de septiembre de 2026 | Diario |
| LRGF · iShares Trust | 0,20% | 110 832 SH | 11 de septiembre de 2026 | Diario |
| RSP · Invesco Exchange-Traded Fund Trust | 0,19% | 3,023,753,00 | 28 de octubre de 2026 | Diario |
| USXF · iShares Trust | 0,19% | 42 519 SH | 11 de septiembre de 2026 | Diario |
| IVE · iShares Trust | 0,16% | 1 209 462 SH | 11 de septiembre de 2026 | Diario |
| IUSV · iShares Trust | 0,15% | 640 730 SH | 11 de septiembre de 2026 | Diario |
| EQAL · Invesco Exchange-Traded Fund Trust … | 0,14% | 18 869 | 28 de octubre de 2026 | Diario |
| BSCT · Invesco Exchange-Traded Self-Indexe… | 0,14% | 4 374 000 | 28 de octubre de 2026 | Diario |
| PFIG · Invesco Exchange-Traded Fund Trust … | 0,13% | 195 000 | 26 de octubre de 2026 | Diario |
| IWD · iShares Trust | 0,13% | 1 691 737 SH | 11 de septiembre de 2026 | Diario |
| DSI · iShares Trust | 0,13% | 109 394 SH | 11 de septiembre de 2026 | Diario |
| BSCS · Invesco Exchange-Traded Self-Indexe… | 0,11% | 4 062 000 | 28 de octubre de 2026 | Diario |
| PRF · Invesco Exchange-Traded Fund Trust | 0,11% | 171 298 | 28 de octubre de 2026 | Diario |
| TOPC · iShares Trust | 0,09% | 443 SH | 11 de septiembre de 2026 | Diario |
| DIVB · iShares Trust | 0,08% | 26 534 SH | 11 de septiembre de 2026 | Diario |
| VLUE · iShares Trust | 0,08% | 124 640 SH | 11 de septiembre de 2026 | Diario |
| ILCV · iShares Trust | 0,08% | 16 911 SH | 11 de septiembre de 2026 | Diario |
| XVV · iShares Trust | 0,08% | 8 404 SH | 11 de septiembre de 2026 | Diario |
| USCL · iShares Trust | 0,08% | 33 766 SH | 11 de septiembre de 2026 | Diario |
| IVV · iShares Trust | 0,07% | 9 188 154 SH | 11 de septiembre de 2026 | Diario |
| ILCB · iShares Trust | 0,07% | 13 952 SH | 11 de septiembre de 2026 | Diario |
| IWB · iShares Trust | 0,07% | 525 058 SH | 11 de septiembre de 2026 | Diario |
| QVML · Invesco Exchange-Traded Fund Trust … | 0,07% | 19 212 | 28 de octubre de 2026 | Diario |
| IWV · iShares Trust | 0,07% | 213 841 SH | 11 de septiembre de 2026 | Diario |
| PBP · Invesco Exchange-Traded Fund Trust | 0,07% | 4 315 | 28 de octubre de 2026 | Diario |
| PBUS · Invesco Exchange-Traded Fund Trust … | 0,07% | 115 308 | 28 de octubre de 2026 | Diario |
| IYY · iShares Trust | 0,07% | 30 956 SH | 11 de septiembre de 2026 | Diario |
| ITOT · iShares Trust | 0,06% | 953 021 SH | 11 de septiembre de 2026 | Diario |
| ILCG · iShares Trust | 0,06% | 28 911 SH | 11 de septiembre de 2026 | Diario |
| TOK · iShares Trust | 0,06% | 2 101 SH | 11 de septiembre de 2026 | Diario |
| PHDG · Invesco Actively Managed Exchange-T… | 0,06% | 567 | 28 de octubre de 2026 | Diario |
| CRBN · iShares Trust | 0,06% | 10 037 SH | 11 de septiembre de 2026 | Diario |
| URTH · iShares, Inc. | 0,05% | 65 129 SH | 11 de septiembre de 2026 | Diario |
| OMFL · Invesco Exchange-Traded Self-Indexe… | 0,05% | 38 095 | 28 de octubre de 2026 | Diario |
| ACWI · iShares Trust | 0,05% | 232 770 SH | 11 de septiembre de 2026 | Diario |
| RWL · Invesco Exchange-Traded Fund Trust … | 0,01% | 24 358 | 27 de octubre de 2026 | Diario |
| GLOF · iShares Trust | 0,01% | 309 SH | 10 de septiembre de 2026 | Diario |
| GTO · Invesco Actively Managed Exchange-T… | 0,00% | 7 000 | 27 de octubre de 2026 | Diario |
VMRK Consenso de analistas Opiniones de analistas alcistas y bajistas, precio objetivo a 12 meses, potencial alcista
Precio objetivo a 12 meses
20 analistas · 2026-10-29Objetivo medio $71.62 +17,6%
Comparación de pares (subindustria GICS) Métricas clave frente a competidores del sector
Base del ejercicio fiscal, precios al cierre del último ejercicio fiscal de cada empresa.
| Ticker | Capitalización Bursátil | P/E | Ingresos interanuales | Margen Neto | ROE | Margen Bruto |
|---|---|---|---|---|---|---|
| VMRK | · | · | · | · | · | · |
| ESS | $16.86B | 25.2 | 6.4% | 37.2% | 12.7% | 69.9% |
| MAA | $16.24B | 36.7 | 0.83% | 20.2% | 7.7% | · |
| CPT | $11.48B | 31.1 | 81.7% | 2964.9% | 8.5% | · |
| UDR | $12.04B | 32.5 | 2.4% | 22.1% | 11.2% | · |
| IRT | $4.15B | 72.8 | 2.8% | 8.6% | 1.6% | · |
| CSR | $1.12B | 65.4 | 4.9% | 6.2% | 2.3% | · |
| NXRT | $763M | -23.9 | -3.2% | -12.8% | -9.1% | · |
Mis Métricas Tu lista de seguimiento personal — filas seleccionadas de Fundamentales Completos
Seleccione las métricas que le importan: haga clic en el + junto a cualquier fila en Fundamentales completos arriba.
Tu selección se guarda y te sigue en todos los tickers.