
CMSD CMS Energy Corporation 5.875% Junior Subordinated Notes due 2079
NYSE · Utilities · Voir sur SEC EDGAR ↗ clôture Oct 2, 2026 10-K/10-Q Jul 28, 2026CMSD Aperçu de l'action Prix, capitalisation boursière, P/E, EPS, ROE, dette/capitaux propres, fourchette sur 52 semaines
CMSD Graphique du cours de l'action OHLCV quotidien avec indicateurs techniques — panoramique, zoom et personnalisez votre vue
La granularité des barres s'adapte à la période sélectionnée — survolez le graphique pour voir l'ouverture/le maximum/le minimum/la clôture d'une barre.
À propos de CMS Energy Corporation 5.875% Junior Subordinated Notes due 2079 Présentation de l'entreprise depuis Wikipedia
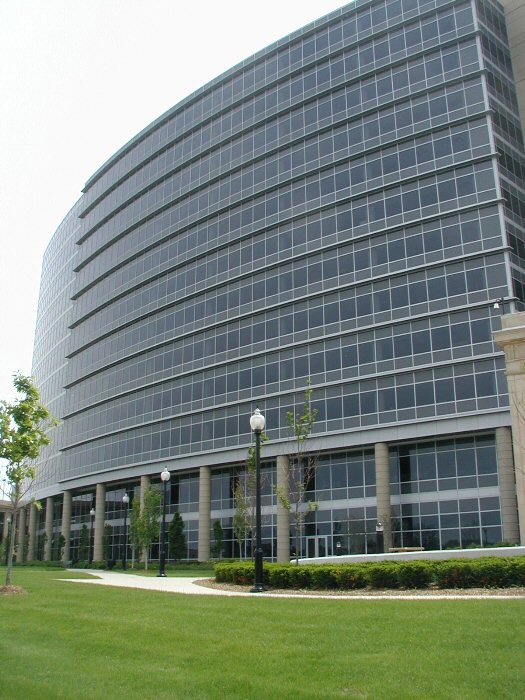
CMS Energy Corporation is an American energy company based in Jackson, Michigan, that is focused principally on utility operations in Michigan. Its principal business is Consumers Energy, a public utility that provides electricity and natural gas to more than 6 million of Michigan's 10 million residents. Its non-utility businesses are focused primarily on domestic independent power production. Consumers Energy has operated since 1886.
NorthStar Clean Energy's primary businesses are independent power production and natural gas transmission.
History
CMS Energy was formed in 1987 as a holding company with its principal subsidiaries as Consumers Energy and NorthStar Clean Energy. On October 23, 1987, CMS Energy became a publicly owned company and was listed at the New York Stock Exchange. The company's history dates back to 1886, when William Augustine Foote and Samuel Jarvis initially approached Jackson, Michigan officials and asked them to support efforts to illuminate Jackson's downtown with electric arc lights. They formed a company, Jackson Electric Light Works in 1888. In 1889, they built a hydro plant project at the Trowbridge Dam on the Kalamazoo River in Allegan. Foote, after seeing some early success, began consolidating his small power companies and formed Commonwealth Power Company.
In 1907, Foote and Jarvis built Croton Hydro project on the Muskegon River, the first project in the world that could transmit 110,000 volts of electricity. In 1920, Foote and Jarvis offered preferred shares of their company to the public to secure sufficient financing to enter other energy and power generation sectors. Over the next decades the company built several coal-fired, natural gas, nuclear and electric facilities. In 1946, the company formed a strategic partnership with Panhandle Company to convert former natural gas fields to underground natural gas storage areas. CMS Energy's primary subsidiary, Consumers Energy, announced Michigan's first nuclear power plant in 1961, Big Rock Point in Charlevoix, Michigan.
The company announced another nuclear plant, Palisades Nuclear Generating Station on Lake Michigan, which first produced electricity in December, 1971 to serve 400,000 people a day. CMS Energy owned the plant until 2006, when it was sold to Entergy. It then announced a gas reforming plant to furnish heat for Michigan homes in 1971. This plant was the first of its kind in North America to produce synthetic gas, converting impure liquid petroleum into pipeline-quality natural gas.
In 1987, CMS Energy, a holding company with its principal subsidiaries as Consumers Power and CMS Enterprises was formed. Consumers Power was rebranded Consumers Energy in 1997. The firm was one of the first companies to introduce an online billing system in the late 1990s.
In 2001, the firm entered into an exploration agreement with Eritrea for oil exploration in the Dismin Block of the Red Sea.
In 2002, CMS Energy founded EnerBank USA.
In 2003, the firm moved its headquarters to One Energy Plaza in Jackson, Michigan. In 2007, the company announced plans to invest $6 billion in Michigan's energy future to support new power plant technology and identify new energy sources. In 2014, Consumers Energy opened Cross Winds Energy Park in Michigan's Tuscola County and signed a contract with General Electric to supply 621.79-kilowatt wind turbine engines for the project which has a total generating capacity of 105 megawatts.
Oct 1, 2021, CMS Energy Completes Sale of EnerBank USA to Regions Bank.
On Nov 1st 2022, CMS Enterprises changes name to NorthStar Clean Energy as it begins to serve more corporate clients.
Sustainability and Environment
In 2015, 9 percent of CMS Energy's power comes from renewable energy sources. Primary CMS Energy subsidiary Consumers Energy joined the Wildlife Habitat Council as an active member. By 2007, all power facilities received the Clean Corporate Citizen award from the Michigan Department of Environmental Quality.
Awards
Consumers Energy, CMS Energy's primary subsidiary, was named Energy Star Partner of the Year in 2014 and 2015 for excellence in sustainable energy efficiency programs. In 2014, Consumers Energy was ranked among the top 15 most sustainable energy providers. Later that year, CMS Energy received Edison Electric Institute's Index Award for top cumulative shareholder return in the small cap category. The firm received the 2015 Emergency Recovery Award for its electricity restoration efforts during the December 2013 North American storm complex.
Criticism
In December 2011, the non-partisan organization Public Campaign criticized CMS Energy for spending $3.48 million on lobbying and not paying any taxes during 2008-2010, instead getting $29 million in tax rebates, despite making a profit of $415 million, and increasing executive pay by 79% to $900.4 million in 2010 for its top 5 executives.
Philanthropy
CMS Energy has helped establish and finance numerous research, educational and cultural institutes in the United States. Consumers Energy was given the William Booth Award in 2013 by The Salvation Army in recognition of its long history of philanthropic activities and leadership for the PeopleCare assistance program.
CMS Energy participates in internship and cooperative education programs to build career opportunities in Michigan. Consumers Energy has also worked on early childhood development and education in Michigan and has also received Wildlife Habitat Council (WHC) compliant certificates for its efforts to promote environmental education.
Source : Wikipedia (Anglais), CC BY-SA 4.0 · Voir sur Wikipedia ↗
Performance sur 10 ans Tendances du chiffre d'affaires, du bénéfice net, des marges et du BPA
Valorisation Ratios P/E, P/S, P/B, EV/EBITDA — l'action est-elle chère ou bon marché ?
| Métrique | Tendance sur 5 ans | CMSD | moyenne 5 ans | Médiane des pairs | Verdict |
|---|---|---|---|---|---|
| P/B (MRQ) | 0.7 | · | · | · |
La médiane des pairs est calculée sur une base standardisée par métrique et peut ne pas toujours correspondre à la base TTM/MRQ indiquée pour cette action.
Rentabilité Marges brutes, d'exploitation et nettes ; ROE, ROA, ROIC
Pas encore assez de données fondamentales pour calculer ce groupe de ratios.
Santé financière Dette, liquidité, solvabilité — solidité du bilan
| Métrique | Tendance sur 5 ans | CMSD | moyenne 5 ans | Médiane des pairs | Verdict |
|---|---|---|---|---|---|
| Dette / Capitaux propres (MRQ) | 1.9 | · | · | · | |
| Ratio de liquidité (MRQ) | 0.9 | · | · | · | |
| Dette à long terme / Capitaux propres (MRQ) | 1.9 | · | · | · |
Croissance Croissance du chiffre d'affaires, du BPA et du bénéfice net : Année/Année, TCAC 3 ans, TCAC 5 ans
Pas encore assez de données fondamentales pour calculer ce groupe de ratios.
Efficacité du capital Rotation des actifs, rotation des stocks, rotation des créances
Pas encore assez de données fondamentales pour calculer ce groupe de ratios.
valeur · ≈ moyenne 5 ans · médiane du secteur · verdict par rapport à la médiane
Dividendes Rendement, ratio de distribution, historique des dividendes, CAGR à 5 ans
| Date ex-dividende | Montant | Devise | Rendement |
|---|---|---|---|
| Aoû 17, 2026 | $0,37 | USD | ≈6.9% |
| Mai 15, 2026 | $0,37 | USD | ≈6.4% |
| Fév 13, 2026 | $0,37 | USD | ≈6.2% |
| Nov 14, 2025 | $0,37 | USD | ≈6.1% |
| Aoû 15, 2025 | $0,37 | USD | ≈6.3% |
| Mai 16, 2025 | $0,37 | USD | ≈6.7% |
| Fév 14, 2025 | $0,37 | USD | ≈6.2% |
| Nov 15, 2024 | $0,37 | USD | ≈6.0% |
| Aoû 16, 2024 | $0,37 | USD | ≈6.0% |
| Mai 16, 2024 | $0,37 | USD | ≈6.0% |
| Fév 14, 2024 | $0,37 | USD | ≈6.0% |
| Nov 15, 2023 | $0,37 | USD | ≈6.2% |
| Aoû 16, 2023 | $0,37 | USD | ≈6.2% |
| Mai 16, 2023 | $0,37 | USD | ≈6.1% |
| Fév 13, 2023 | $0,37 | USD | ≈6.0% |
| Nov 15, 2022 | $0,37 | USD | ≈6.2% |
| Aoû 16, 2022 | $0,37 | USD | ≈5.8% |
| Mai 16, 2022 | $0,37 | USD | ≈6.0% |
| Fév 11, 2022 | $0,36 | USD | ≈5.6% |
| Nov 15, 2021 | $0,37 | USD | ≈5.5% |
Historique des bénéfices BPA réel vs estimation, surprise %, taux de succès, prochaine date de publication des résultats
| Période | Rapport | EPS Actual | BPA est. | Surprise |
|---|---|---|---|---|
| 30 juin 2026 | $0.37 | $0.36 | 1.6% | |
| 31 mars 2026 | $1.13 | $1.11 | 1.9% | |
| 31 décembre 2025 | $0.94 | $0.95 | -1.2% | |
| 30 septembre 2025 | $0.93 | $0.85 | 8.9% | |
| 30 juin 2025 | $0.71 | $0.70 | 2.1% | |
| 31 mars 2025 | $1.02 | $1.02 | -0.41% |
Fondamentaux complets Tous les indicateurs par an — compte de résultat, bilan, flux de trésorerie
Bilan
| Métrique | Tendance | 2025 |
|---|---|---|
| Cash & Equivalents | $509M | |
| Other Current Assets | $160M | |
| Current Assets | $3.47B | |
| PP&E (Net) | $30.68B | |
| Accum. Depreciation | $10.13B | |
| Other Non-current Assets | $398M | |
| Total Assets | $39.94B | |
| Current Liabilities | $3.55B | |
| Deferred Tax | $3.25B | |
| Other Non-current Liabilities | $392M | |
| Long-term Debt | $18.76B | |
| Common Stock | $3M | |
| Retained Earnings | $2.44B | |
| AOCI | $-36M | |
| Stockholders' Equity | $9.14B | |
| Liabilities + Equity | $39.94B | |
| Shares Outstanding | 306,400,000 |
Compte de résultat
| Métrique | Tendance | Q2 2026 | Q1 2026 | Q2 2025 | Q1 2025 |
|---|---|---|---|---|---|
| Revenue | $1.83B | $2.73B | $1.84B | $2.45B | |
| Operating Expenses | $1.56B | $2.24B | $1.52B | $1.95B | |
| Operating Income | $264M | $490M | $317M | $494M | |
| Other Non-op | $75M | $75M | $137M | $50M | |
| Pretax Income | $129M | $362M | $255M | $358M | |
| Income Tax | $33M | $85M | $62M | $63M | |
| Net Income | $120M | $340M | $201M | $304M | |
| EPS (Basic) | $0.38 | $1.10 | $0.67 | $1.01 | |
| EPS (Diluted) | $0.37 | $1.10 | $0.66 | $1.01 | |
| Shares (Basic) | 310,200,000 | 306,400,000 | 298,500,000 | 298,200,000 | |
| Shares (Diluted) | 310,800,000 | 307,100,000 | 299,100,000 | 299,100,000 | |
| EBITDA | $572M | $902M | · | · |
Bilan
| Métrique | Tendance | Q2 2026 | Q1 2026 | Q2 2025 | Q1 2025 |
|---|---|---|---|---|---|
| Cash & Equivalents | $241M | $175M | · | · | |
| Other Current Assets | $243M | $225M | · | · | |
| Current Assets | $2.87B | $3.02B | · | · | |
| PP&E (Net) | $32.33B | $31.53B | · | · | |
| Accum. Depreciation | $10.50B | $10.38B | · | · | |
| Other Non-current Assets | $302M | $341M | · | · | |
| Total Assets | $40.91B | $40.28B | · | · | |
| Current Liabilities | $3.06B | $3.59B | · | · | |
| Deferred Tax | $3.40B | $3.35B | · | · | |
| Other Non-current Liabilities | $444M | $417M | · | · | |
| Long-term Debt | $19.04B | $18.86B | · | · | |
| Total Debt | $19.04B | $18.86B | · | · | |
| Common Stock | $3M | $3M | · | · | |
| Retained Earnings | $2.55B | $2.60B | · | · | |
| AOCI | $-35M | $-35M | · | · | |
| Stockholders' Equity | $9.77B | $9.47B | · | · | |
| Liabilities + Equity | $40.91B | $40.28B | · | · | |
| Shares Outstanding | 313,600,000 | 308,900,000 | · | · |
Flux de trésorerie
| Métrique | Tendance | Q2 2026 | Q1 2026 | Q2 2025 | Q1 2025 |
|---|---|---|---|---|---|
| D&A | $308M | $412M | $288M | $388M | |
| Other Non-cash | · | $-47M | · | · | |
| Operating Cash Flow | $622M | $705M | · | $1.00B | |
| CapEx | $967M | $1.04B | · | $888M | |
| Investing Cash Flow | $-1.02B | $-1.07B | · | $-918M | |
| Debt Issued | $909M | $258M | · | $1.20B | |
| Net Debt Issued | · | $54M | · | · | |
| Stock Issued | $362M | $166M | · | $3M | |
| Net Stock Activity | · | $166M | · | · | |
| Financing Cash Flow | $480M | $16M | · | $266M | |
| Net Change in Cash | $82M | $-352M | · | $348M | |
| Free Cash Flow | · | $-334M | · | · |
Rentabilité
| Métrique | Tendance | Q2 2026 | Q1 2026 | Q2 2025 | Q1 2025 |
|---|---|---|---|---|---|
| Operating Margin | 14.4% | 17.9% | · | · | |
| Net Margin | 6.6% | 12.4% | · | · | |
| Pretax Margin | 7.0% | 13.3% | · | · | |
| EBITDA Margin | 31.3% | 33.0% | · | · | |
| ROA | 0.31% | 0.89% | · | · | |
| ROE | 1.3% | 3.8% | · | · | |
| ROIC | 0.68% | 1.3% | · | · |
Liquidité et Solvabilité
| Métrique | Tendance | Q2 2026 | Q1 2026 | Q2 2025 | Q1 2025 |
|---|---|---|---|---|---|
| Current Ratio | 0.9 | 0.8 | · | · | |
| Quick Ratio | 0.1 | 0.0 | · | · | |
| Debt / Equity | 1.9 | 2.0 | · | · | |
| LT Debt / Equity | 1.9 | 1.8 | · | · |
Efficacité
| Métrique | Tendance | Q2 2026 | Q1 2026 | Q2 2025 | Q1 2025 |
|---|---|---|---|---|---|
| Asset Turnover | 0.0 | 0.1 | · | · |
Par action
| Métrique | Tendance | Q2 2026 | Q1 2026 | Q2 2025 | Q1 2025 |
|---|---|---|---|---|---|
| Book Value / Share | $31.17 | $30.64 | · | · | |
| Revenue / Share | $5.88 | $8.89 | · | · | |
| Cash Flow / Share | · | $2.30 | · | · | |
| Cash / Share | $0.77 | $0.57 | · | · | |
| Dividend / Share | $0.57 | $0.57 | $0.54 | $0.54 | |
| EPS (TTM) | $3.33 | $3.62 | $3.39 | $3.38 |
Valorisation (TTM)
| Métrique | Tendance | Q2 2026 | Q1 2026 | Q2 2025 | Q1 2025 |
|---|---|---|---|---|---|
| Revenue TTM | $8.81B | $8.82B | $8.02B | $7.79B | |
| Net Income TTM | $1.03B | $1.11B | $1.02B | $1.02B | |
| Market Cap | $6.87B | $6.83B | · | · | |
| Enterprise Value | $25.66B | $25.51B | · | · | |
| P/E | 6.6 | 6.1 | 6.5 | 6.7 | |
| P/S | 0.8 | 0.8 | 0.8 | 0.9 | |
| P/B | 0.7 | 0.7 | · | · | |
| P / Tangible Book | 0.7 | 0.7 | · | · | |
| P / Cash Flow | · | 9.7 | · | · | |
| EV / Revenue | 2.9 | 2.9 | 3.0 | 3.0 | |
| Earnings Yield | 15.2% | 16.4% | 15.3% | 14.8% |
Période la plus récente à gauche · valeurs nulles affichées comme ·
États financiers Compte de résultat, bilan, flux de trésorerie — annuel, sur les 5 dernières années
Pas assez de données fondamentales pour construire ce relevé pour le moment.
Pas assez de données fondamentales pour construire ce relevé pour le moment.
Pas assez de données fondamentales pour construire ce relevé pour le moment.
Détenteurs institutionnels (13F) 2 déclarants · $20K total · Au 30 juin 2026
Institutions qui déclarent détenir cette action dans leur Formulaire SEC 13F trimestriel. Uniquement les positions longues ; un même déclarant peut apparaître deux fois pour des jambes d'options distinctes. Les jambes put/call compensatoires importantes reflètent généralement la tenue de marché ou un inventaire couvert, pas une conviction directionnelle.
| Nouvelles positions | Positions clôturées | Augmenté | Diminué | Variation nette des actions |
|---|---|---|---|---|
| 0 (-1 vs T. préc.) | 0 (-1 vs T. préc.) | 1 (+1 vs T. préc.) | 1 (+1 vs T. préc.) | +478 |
Comparé à Q1 2026. Les dépôts de formulaire 13F de la SEC sont dus dans les 45 jours suivant la fin du trimestre, plus une courte période tampon pour les déposants tardifs — les trimestres encore dans cette fenêtre sont ignorés au profit de la paire la plus récente entièrement déclarée.
| Institution | Valeur | Actions | % de 13F suivies | Type |
|---|---|---|---|---|
| First Command Advisory Services, Inc. | $16 075 | 734 | 81,20% | Actions |
| PNC Financial Services Group, Inc. | $3 723 | 170 | 18,80% | Actions |
Initiés de la société 1 initié · 1 dirigeants · 0 administrateurs
| Dirigeant | Rôle | Dernière activité | Actions détenues | Achats 12m | Ventes 12m | Net 12m |
|---|---|---|---|---|---|---|
| Srikanth Maddipati | EVP/CFO | 31 juillet 2026 P | 34 895 | 1 | 0 | $14 492 |
Initiés issus des déclarations SEC Form 3/4/5 ; net = uniquement P/S de marché
Détention d'ETF Détenu par 1 ETF
Le poids reflète uniquement les participations directes en actions (N-PORT) ; les fonds à effet de levier ou basés sur des dérivés peuvent détenir une exposition supplémentaire aux swaps non indiquée.
| Fonds | Poids | Unités | Au | Source |
|---|---|---|---|---|
| FPE · First Trust Exchange-Traded Fund III | 0,25% | 705 428 NS | 31 juillet 2026 | N-PORT |
CMSD Consensus des analystes Opinions des analystes haussières et baissières, objectif de cours à 12 mois, potentiel de hausse
Comparaison des pairs (sous-secteur GICS) Indicateurs clés par rapport aux pairs du secteur
Base F.A., prix à la clôture de la dernière fin d'exercice de chaque société.
| Ticker | Capitalisation Boursière | P/E | Revenus Année/Année | Marge Nette | ROE | Marge Brute |
|---|---|---|---|---|---|---|
| CMSD | · | · | · | · | · | · |
| WEC | $34.32B | 21.9 | 14.0% | 15.9% | 11.2% | · |
| PEG | $39.99B | 19.0 | 18.2% | 17.3% | 12.6% | · |
| AEE | $27.60B | 18.7 | 15.4% | 16.6% | 11.5% | · |
| DTE | · | · | · | · | · | · |
| CNP | $25.03B | 24.0 | 8.3% | 11.2% | 9.5% | · |
| CMS | $21.43B | 19.8 | 13.6% | 12.5% | 12.3% | · |
| NI | $19.98B | 21.4 | 23.5% | 14.2% | 10.2% | · |
| BKH | $5.24B | 17.4 | 8.6% | 12.6% | 8.0% | · |
| NWE | $3.96B | 22.0 | 6.4% | 11.2% | 6.3% | · |
| NWE | $3.96B | 22.0 | 6.4% | 11.2% | 6.3% | · |
Mes métriques Votre watchlist personnelle — lignes sélectionnées de Fondamentaux Complets
Choisissez les indicateurs qui vous importent — cliquez sur le + à côté de n'importe quelle ligne dans les Fondamentaux complets ci-dessus.
Votre sélection est enregistrée et vous suit sur tous les tickers.