
KGC Kinross Gold Corporation Common Stock
NYSE · Metals & Mining · SEC EDGAR पर देखें ↗ 10-K/10-Q मा 26, 2026KGC स्टॉक स्नैपशॉट मूल्य, बाजार पूंजीकरण, P/E, EPS, ROE, ऋण/इक्विटी, 52-सप्ताह की सीमा
KGC स्टॉक मूल्य चार्ट तकनीकी संकेतकों के साथ दैनिक OHLCV — पैन, ज़ूम और अपना दृश्य कस्टमाइज़ करें
बार ग्रैन्युलैरिटी चयनित अवधि के अनुसार अनुकूलित होती है — बार के लिए ओपन/हाई/लो/क्लोज देखने के लिए चार्ट पर होवर करें।
| एक्स-डेट | स्प्लिट | प्रकार |
|---|---|---|
| 3 फ़रवरी 2003 | 1-for-3 | रिवर्स |
Kinross Gold Corporation Common Stock के बारे में विकिपीडिया से कंपनी का अवलोकन
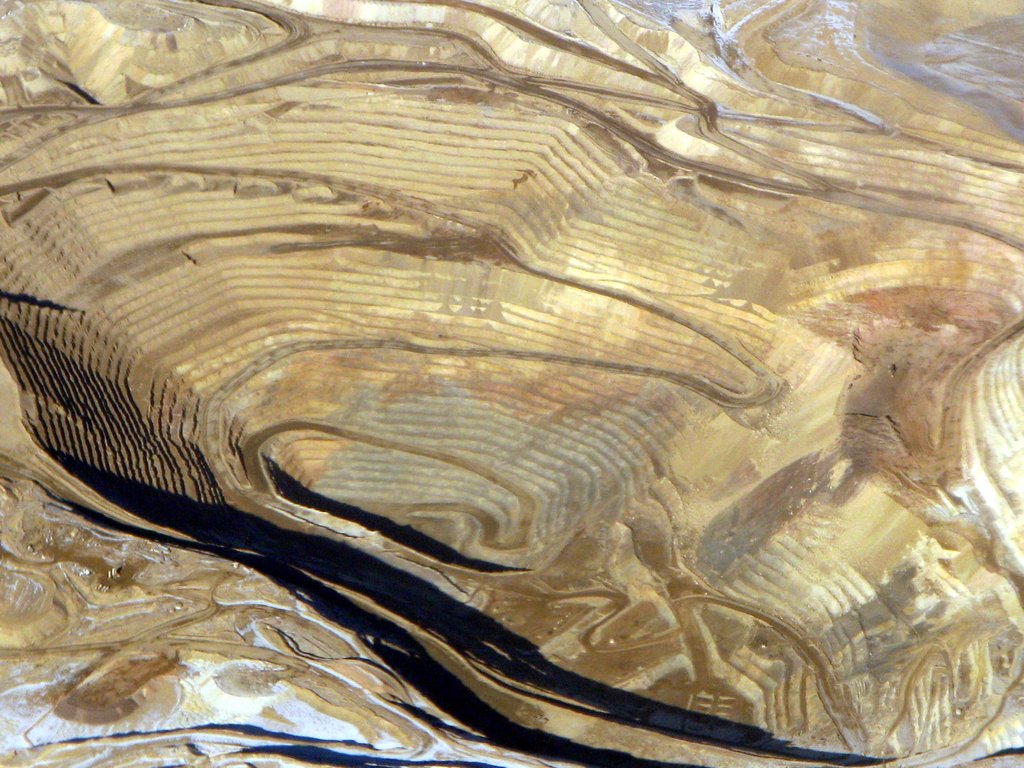
Kinross Gold Corporation is a Canadian gold and silver mining company founded in 1993 and headquartered in Toronto, Ontario, Canada. Kinross currently operates six active gold mines, and was ranked fifth of the "10 Top Gold-mining Companies" of 2019 by InvestingNews. The company's mines are located in Brazil, Mauritania, and the United States. It trades under the KGC ticker in the New York Stock Exchange, and under K in the Toronto Stock Exchange.
Operations
Kinross Gold operates mines in North and South America, and West Africa. In 2022, 58% of Kinross gold production was expected to come from the Americas.
Fort Knox
This property includes a mill, tailings storage, heap leach facility, the Gil project, and the True North open pit mine, which is closed and under monitoring. Expected to run out of ore in 2021, the mine's life has been extended to 2030 following a $100 million expansion investment announced in 2018, increasing life-of-mine production by about 1.5 million gold equivalent ounces.
Round Mountain
The Round Mountain Gold Mine is located in Nye County, Nevada and has operated by Kinross since 2003. They purchased the remaining outstanding interest in the company from Barrick Gold in 2016.
Bald Mountain
Located in White Pine County, Nevada, the Bald Mountain mine is operated by subsidiary KG Mining (Bald Mountain) Inc.
Paracatu
The open-pit Paracatu gold mine, located in northwest Minas Gerais, Brazil.
Tasiast
Kinross acquired the Tasiast mine (located in Mauritania) in 2010, expanding the operation twice by 2017.
In 2012, securities class action lawsuits launched in the U.S. and Canada, alleging Kinross Gold overstated the value of Tasiast mine in its financial statements, misrepresented some of the mine's project expansion schedules, and made other false statements. In 2015, the parties reached no-fault settlement agreements which included payments by Kinross totaling approximately $US 40 million.
In June 2016, due to "government allegations of invalid work permits" for expatriate employees, the mine suspended operations, resuming them in August that same year.
In May 2020, there was a short strike by unionized employees at the mine, which was suspended at the request of the Mauritanian government. A month later, Kinross reached an agreement in principle with the government, which included revalued royalties.
Chirano
Kinross holds 90% ownership of the Chirano gold mine, with the remainder held by the Government of Ghana. In April 2022, Kinross announced plans to sell its 90% ownership for US$225-million to Asante Gold Corp.
History
Founding and early years
Kinross Gold Corporation was founded in 1993, following the amalgamation of three companies: Plexus Resources Corporation, CMP Resources and numbered company 1021105 Ontario Corp., resulting in the new company owning a stake and royalties in a mining property in Fallon, Nevada and the QR Mine in British Columbia. On June 1, 1993, Kinross was listed on the Toronto Stock Exchange and NASDAQ, then on the New York Stock Exchange in 1994.
Kinross' first project – now operated by its subsidiary Fairbanks Gold Mining – was the Fort Knox Gold Mine, an open-pit mining operation in Alaska. The area, including surrounding deposits, was prospected as early as 1913, but no mining took place until 1996. The mine currently produces over 200,000 ounces of gold a year.
In 1998, a wholly owned subsidiary of Kinross merged with Amax Gold, forming Kinam Gold, the company's largest subsidiary. effectively transferring ownership of the mine back to Kinross, along with Maricunga Gold Mine in Chile, as part of the merger.
1999–2006
Kinross acquired Hollinger Mines in 1999 as part of a land package prior to the bankruptcy of Royal Oak Mines (later sold to Goldcorp in 2006). Also that year, Kinross acquired LA Teko Resources Ltd. through its wholly owned subsidiary, LT Acquisition Inc. division.
In July 2002, Kinross and Placer Dome combined their assets in Timmins, Ontario and formed the Porcupine Joint Venture (51% Placer Dome, 49% Kinross). In January 2003 Kinross TVX Gold and Echo Bay Mines shareholders approved a $3-billion merger, combining the three companies, while retaining the name Kinross Gold. The TVX merger resulted in Kinross' stake in the La Coipa open pit mine, the remainder being purchased from Goldcorp in 2007.
In 2006, Kinross bought Crown Resources Corporation, which gave it ownership of the mineral resource Buckhorn Mountain (later Buckhorn Gold Mine) and the associated mineral processing facilities.
2007–present
In 2007, Kinross traded assets with Goldcorp; Kinross received $200 million and the remaining portion of the La Coipa Gold Mine it had acquired with the TVX merger, in exchange for giving up its 49% of the Porcupine Joint Venture and 31.9% of the Musselwhite mine.
In 2010, Kinross purchased 91% of Red Back Mining for $7.1 billion. The purchase brought with it the two gold mines in Africa (Chirano and Tasiast). Also that year, Kinross acquired the Dvoinoye deposit and the property in Vodorazdelnaya, about 90 kilometres (56 mi) north of Kinross’ Kupol operation. In 2011, Kinross entered into a share purchase agreement with the State Unitary Enterprise of the Chukotka Autonomous Okrug, whereby it held 100% of the Kupol mine and exploration licenses. Kinross sold its interest in the Crixás mine to AngloGold Ashanti in 2012.
In December 2017, Kinross acquired mineral rights to Gilmore, or Parcel G, a 709-acre tract adjacent to its Fort Knox Gold Mine, about 25 miles northeast of Fairbanks, Alaska. Estimates of the land valued it as containing 2.1 million ounces of gold.
In December 2021, Kinross offered to acquire Great Bear Resources for $29 per share, or about $1.8 billion, giving it ownership of a gold mining prospect in Red Lake, Ontario, Canada. Kinross shares dropped 9% after it announced the buyout bid. The deal to acquire Great Bear closed on February 24, 2022.
Non-operating, discontinued and divested mines
Julietta Mine is a gold and silver mine located in the Omsukchansky District of Magadan Oblast, near Russia's far eastern border.
Kettle River-Buckhorn - the Washington-state based mine and mill were acquired by Kinross in 2006, and was closed in 2017.
Mineral Hill - located on the east side of Crevice Mountain, Montana, Mineral Hill operated from 1990 to 1996. In 2017, Kinross donated water rights representing 3 billion gallons of water to Trout Unlimited to protect fish habitat in tributaries of the Yellowstone River.
Cerro Casale - Chile-based mine acquired by Kinross in 2007. As of 2015, the mine was inactive, and Kinross divested in 2017.
Crixás - Kinross sold its 50% interest in the Brazil-based mine to AngloGold Ashanti for $220 million.
Fruta del Norte - Kinross purchased 100% of outstanding shares in the Ecuadorian deposit in 2008, but ceased development in 2013, and sold the rights in 2014.
La Coipa - Kinross incurred an impairment charge of $124 million in 2014 after development on the Chile-based mine ceased. In February 2020, Kinross announced it was proceeding with the La Coipa Restart project to mine the Phase 7 deposit, expected to operate from 2022 to 2024.
Lobo-Marte - After acquiring 40% interest in the Chile mine in 2008, Kinross acquired the remaining interest in 2009, for a total cost of $182 million. The results of a pre-feasibility study at Lobo-Marte was announced in July 2020. Subject to development decision, project construction will begin in 2025, with production expected in 2027.
Maricunga - Operations ceased in August 2016, after the Chilean government shut off the mine's water supply over environmental concerns. As a result, 300 employees were laid off, and Kinross incurred an impairment charge of $68 million.
Dvoinoye Gold Mine & Kupol Gold Mine - The Dvoinoye and Kupol gold mines are located in Russia approximately 100 kilometres (60 mi) apart; Dvoinoye is an underground mine, while Kupol is a combination of open-pit and underground. Acquired in 2010 and opened in 2013, Dvionoye/Kupol was one of Kinross' most profitable segments. In April 2022, Kinross announced that it was selling 100% of its Russian assets to the Highland Gold Mining, completing the sale of Russian assets two months later.
Financial performance
Gold production
Annual gold production (thousands of ounces) was:
2013 - 2,631
2014 - 2,710
2015 - 2,594
2016 - 2,789
2017 - 2,673
2018 - 2,450
2019 - 2,507
2020 - 2,366
2021 - 2,063
Gold reserves
Kinross' proven and probable gold reserves were 32.6 million ounces as of December 31, 2021.
Assets
Kinross Gold's total assets decreased significantly in recent years, from $US 16.39 billion in 2010 to $US 7.73 billion in 2015.
Other
Kinross suspended dividend payments in 2013. It started paying again in 2020, and that year, also announced a share buyback program.
In 2015 in the wake of declining gold prices, Kinross closed their office in Denver and eliminated 110 corporate positions in Denver, Chile, Spain, and Toronto.
In 2016, Standard & Poor's lowered Kinross' credit rating to junk bond status, largely based on the share of their production that came from mines in Russia, which the agency saw as a significant risk.
In 2017, Moody's Investors Service assigned a Ba1 rating to Kinross, "primarily driven by the company's good scale (2.78 million gold-equivalent ounces (GEO) as of March 2017 LTM), low leverage (1.7x LTM adjusted Debt/EBITDA), and very good liquidity (SGL-1).
On March 2, 2020, Moody's announced it had upgraded Kinross's credit rating to investment grade. Their senior unsecured notes rating was upgraded to Ba1, with a stable outlook. Kinross currently holds investment grade ratings from Moody's, S&P Global Ratings, and Fitch Ratings.
Corporate responsibility
In 2015, Kinross achieved an A− ranking in Maclean's magazine's annual assessment of socially responsible companies, the highest ranking of any Canadian mining company.
For Kinross' cooperation with an environmental group in Washington state, and for five out of eight mines being in compliance with the International Cyanide Management Code (as of May 2013, the Company had eight of its nine mines in compliance with the International Cyanide Management Code), Kinross was recognized as one of Canada's Top 50 Most Responsible Corporations by Maclean's magazine and Jantzi Research in 2009.
Through a $1 million donation by Kinross in 2010, the University of Guelph created a new chair as part of its BetterPlanet Project. Said Chair is named the Kinross Chair in Environmental Governance, and is held by a "succession of experts". Also with the university, Kinross provided $100 thousand towards its Fight Against Hunger.
In 2010, Kinross committed to contribute $10 million over a three-year period towards developing a mining school in Mauritania. The following year, it committed $2.5 million to build and equip a medical emergency centre in that country.
In 2013, Kinross was named to the Dow Jones Sustainability World Index for the third consecutive year, as well as the DJSI North American Index, the Ethibel Excellence Investment Register, and the Ethical Global Equity and ECPI Global Carbon Indices. For the fifth consecutive year, the company was named to the Jantzi Social Index, and as one of Canada's Best 50 Corporate Citizens by Corporate Knights magazine for the fourth year.
In 2021, Kinross was ranked no. 22 out of 120 oil, gas, and mining companies involved in resource extraction north of the Arctic Circle in the Arctic Environmental Responsibility Index (AERI).
Carbon footprint
Kinross Gold reported Total CO2e emissions (Direct + Indirect) for the twelve months ending 31 December 2020 at 1,631 Kt (+19/+1.2% y-o-y). There have been not any significant reductions in emissions in recent years. In May 2021, Kinross committed to reaching net-zero greenhouse gas emissions by 2050.
स्रोत: विकिपीडिया (अंग्रेज़ी), CC BY-SA 4.0 · विकिपीडिया पर देखें ↗
10-वर्षीय प्रदर्शन राजस्व, शुद्ध आय, मार्जिन और ईपीएस रुझान
मूल्यांकन P/E, P/S, P/B, EV/EBITDA अनुपात — क्या स्टॉक महंगा है या सस्ता?
| मेट्रिक | 5Y रुझान | KGC | 5Y औसत | सहकर्मी माध्यिका | निर्णय |
|---|---|---|---|---|---|
| P/E | 14.45Y औसत ≈13.9 | ≈13.9 | · | · |
सहकर्मी माध्यिका को प्रति मीट्रिक मानकीकृत आधार पर गणना की जाती है और यह हमेशा इस स्टॉक के लिए दिखाए गए TTM/MRQ आधार से मेल नहीं खा सकती है।
लाभप्रदता सकल, परिचालन और शुद्ध मार्जिन; ROE, ROA, ROIC
| मेट्रिक | 5Y रुझान | KGC | 5Y औसत | सहकर्मी माध्यिका | निर्णय |
|---|---|---|---|---|---|
| ROA | 20.5%5Y औसत ≈5.9% | ≈5.9% | · | · | |
| ROE | 31.0%5Y औसत ≈9.2% | ≈9.2% | · | · | |
| ROIC | 29.5%5Y औसत ≈11.2% | ≈11.2% | · | · |
वित्तीय स्वास्थ्य ऋण, तरलता, शोधन क्षमता — बैलेंस शीट की मजबूती
| मेट्रिक | 5Y रुझान | KGC | 5Y औसत | सहकर्मी माध्यिका | निर्णय |
|---|---|---|---|---|---|
| Current Ratio (वर्तमान अनुपात) | 2.35Y औसत ≈2.4 | ≈2.4 | · | · | |
| Quick Ratio (त्वरित अनुपात) | 0.75Y औसत ≈0.6 | ≈0.6 | · | · | |
| Interest Coverage (ब्याज कवरेज) | 40.15Y औसत ≈18.1 | ≈18.1 | · | · |
विकास राजस्व, EPS और शुद्ध आय वृद्धि: YoY, 3Y CAGR, 5Y CAGR
इस टिकर के लिए अभी तक कोई फंडामेंटल डेटा नहीं है।
पूंजी दक्षता एसेट टर्नओवर, इन्वेंटरी टर्नओवर, प्राप्य टर्नओवर
| मेट्रिक | 5Y रुझान | KGC | 5Y औसत | सहकर्मी माध्यिका | निर्णय |
|---|---|---|---|---|---|
| Inventory Turnover (इन्वेंटरी टर्नओवर) | 2.65Y औसत ≈2.6 | ≈2.6 | · | · |
मान · ≈ 5Y औसत · उद्योग माध्य · माध्य के सापेक्ष निर्णय
लाभांश यील्ड, भुगतान अनुपात, लाभांश इतिहास, 5Y CAGR
| एक्स-डेट | राशि | मुद्रा | यील्ड |
|---|---|---|---|
| अग 20, 2026 | $0.04 | USD | ≈0.48% |
| मई 21, 2026 | $0.04 | USD | ≈0.49% |
| मा 11, 2026 | $0.04 | USD | ≈0.31% |
| अग 21, 2025 | $0.03 | USD | ≈0.62% |
| मई 29, 2025 | $0.03 | USD | ≈0.82% |
| मा 5, 2025 | $0.03 | USD | ≈1.0% |
| नव 27, 2024 | $0.03 | USD | ≈1.2% |
| अग 22, 2024 | $0.03 | USD | ≈1.3% |
| मई 30, 2024 | $0.03 | USD | ≈1.5% |
| मा 5, 2024 | $0.03 | USD | ≈2.3% |
| नव 29, 2023 | $0.03 | USD | ≈2.1% |
| अग 23, 2023 | $0.03 | USD | ≈2.4% |
| मई 31, 2023 | $0.03 | USD | ≈2.5% |
| मा 7, 2023 | $0.03 | USD | ≈3.4% |
| नव 30, 2022 | $0.03 | USD | ≈2.9% |
| अग 17, 2022 | $0.03 | USD | ≈3.5% |
| जून 1, 2022 | $0.03 | USD | ≈2.7% |
| मा 8, 2022 | $0.03 | USD | ≈2.1% |
| नव 30, 2021 | $0.03 | USD | ≈2.0% |
| अग 18, 2021 | $0.03 | USD | ≈2.6% |
Earnings History EPS वास्तविक बनाम अनुमान, आश्चर्य %, बीट दर, अगली आय तिथि
| Period | रिपोर्ट | EPS Actual | EPS अनुमान | आश्चर्य |
|---|---|---|---|---|
| 30 जून 2026 | $0.71 | $0.74 | -4.1% | |
| 31 मार्च 2026 | $0.71 | $0.67 | 5.5% | |
| 31 दिसमबर 2025 | $0.67 | $0.60 | 11.4% | |
| 30 सितमबर 2025 | $0.44 | $0.37 | 20.2% | |
| 30 जून 2025 | $0.44 | $0.30 | 46.2% | |
| 31 मार्च 2025 | $0.30 | $0.23 | 28.6% |
पूर्ण मौलिक सभी मेट्रिक्स प्रति वर्ष — आय विवरण, बैलेंस शीट, नकदी प्रवाह
आय विवरण
| मेट्रिक | रुझान | 2025 | 2024 | 2023 | 2022 | 2021 | 2020 | 2019 | 2018 | 2017 | 2016 |
|---|---|---|---|---|---|---|---|---|---|---|---|
| Cost of Revenue | $3.34B | $3.27B | $3.08B | $2.94B | $2.06B | $1.92B | $2.15B | $2.63B | $2.60B | $2.98B | |
| Gross Profit | $3.72B | $1.88B | $1.16B | $515M | $541M | $2.30B | $1.35B | $580M | $705M | $494M | |
| SG&A Expense | $140M | $126M | $109M | $130M | $114M | $118M | $136M | $133M | $133M | $144M | |
| Operating Income | $3.28B | $1.54B | $801M | $118M | $72M | $1.90B | $991M | $200M | $336M | $46M | |
| Interest Expense | $82M | $50M | $69M | $68M | $72M | $90M | $77M | $72M | $86M | $100M | |
| Interest Income | $73M | $18M | $40M | $18M | $11M | $4M | $8M | $11M | $14M | $8M | |
| Pretax Income | $3.19B | $1.48B | $709M | $107M | $84M | $1.80B | $964M | $113M | $419M | $-60M | |
| Income Tax | $725M | $487M | $293M | $76M | $115M | $440M | $247M | $139M | $-23M | $50M | |
| Net Income | $2.39B | $949M | $416M | $-605M | $221M | $1.34B | $719M | $-24M | $445M | $-104M | |
| EPS (Basic) | $1.96 | $0.77 | $0.34 | $-0.47 | $0.18 | $1.07 | $0.57 | $-0.02 | $0.36 | $-0.08 | |
| EPS (Diluted) | $1.95 | $0.77 | $0.34 | $-0.47 | $0.17 | $1.06 | $0.57 | $-0.02 | $0.35 | $-0.08 | |
| Shares (Basic) | 1,219,466,000 | 1,228,855,000 | 1,226,985,000 | 1,280,531,000 | 1,259,059,000 | 1,257,200,000 | 1,252,300,000 | 1,249,500,000 | 1,246,619,000 | 1,227,007,000 | |
| Shares (Diluted) | 1,224,607,000 | 1,234,504,000 | 1,236,670,000 | 1,292,811,000 | 1,259,059,000 | 1,268,000,000 | 1,262,300,000 | 1,249,500,000 | 1,257,045,000 | 1,227,007,000 | |
| EBITDA | $4.38B | $2.69B | $1.79B | $902M | $1.30B | $2.74B | $1.72B | $973M | $1.16B | · |
बैलेंस शीट
| मेट्रिक | रुझान | 2025 | 2024 | 2023 | 2022 | 2021 | 2020 | 2019 | 2018 | 2017 | 2016 |
|---|---|---|---|---|---|---|---|---|---|---|---|
| Cash & Equivalents | $887M | $282M | $198M | $270M | $387M | $562M | $306M | $208M | $601M | $514M | |
| Receivables | $30M | $53M | $58M | $318M | $214M | $116M | $137M | $101M | $91M | $127M | |
| Inventory | $1.37B | $1.24B | $1.15B | $1.07B | $1.15B | $1.07B | $1.05B | $1.05B | $1.09B | $987M | |
| Current Assets | $3.29B | $2.13B | $1.80B | $1.85B | $1.95B | $2.45B | $1.82B | $1.60B | $2.28B | $2.08B | |
| PP&E (Net) | $8.29B | $7.97B | $7.96B | $7.74B | $7.62B | $7.65B | $6.34B | $5.52B | $4.89B | $4.92B | |
| Goodwill | · | · | · | · | $159M | $159M | $159M | $163M | $163M | $163M | |
| Total Assets | $12.41B | $10.87B | $10.54B | $10.40B | $10.43B | $10.93B | $9.08B | $8.06B | $8.16B | $7.98B | |
| Accounts Payable | $716M | $543M | $532M | $550M | $493M | $479M | $469M | $466M | $483M | $465M | |
| Current Liabilities | $1.40B | $1.06B | $686M | $752M | $741M | $1.35B | $616M | $612M | $585M | $638M | |
| Total Liabilities | $3.72B | $3.87B | $4.36B | $4.51B | $3.78B | $4.27B | $3.74B | $3.54B | $3.54B | $3.79B | |
| Retained Earnings | $-5.94B | $-8.18B | $-8.98B | $-9.25B | $-8.49B | $-8.56B | $-9.83B | $-10.55B | $-10.58B | $-11.03B | |
| Stockholders' Equity | $8.58B | $6.86B | $6.08B | $5.82B | $6.58B | $6.60B | $5.32B | $4.51B | $4.58B | $4.15B |
नकदी प्रवाह
| मेट्रिक | रुझान | 2025 | 2024 | 2023 | 2022 | 2021 | 2020 | 2019 | 2018 | 2017 | 2016 |
|---|---|---|---|---|---|---|---|---|---|---|---|
| D&A | $1.10B | $1.15B | $987M | $784M | $696M | $842M | $731M | $772M | $819M | $855M | |
| Other Non-cash | $265M | $350M | · | · | $73M | $-227M | $-225M | $40M | $-313M | · | |
| Operating Cash Flow | $3.76B | $2.45B | $1.61B | · | $1.14B | $1.96B | $1.22B | $789M | $952M | $1.10B | |
| CapEx | $1.19B | $1.08B | $1.10B | $764M | $822M | $916M | $1.06B | $1.04B | $898M | $634M | |
| Investing Cash Flow | · | · | · | · | $-1.19B | $-1.25B | $-1.03B | $-1.39B | $-687M | $-1.27B | |
| Financing Cash Flow | $-1.63B | $-1.01B | $-549M | · | $-623M | $-68M | $25M | $-73M | $-69M | $-48M | |
| Free Cash Flow | $2.57B | $1.37B | · | · | $197M | $1.04B | $120M | $-255M | $54M | · | |
| Levered FCF | $2.50B | $1.34B | · | · | $163M | $974M | $62M | $-238M | $-37M | · |
लाभप्रदता
| मेट्रिक | रुझान | 2025 | 2024 | 2023 | 2022 | 2021 | 2020 | 2019 | 2018 | 2017 | 2016 |
|---|---|---|---|---|---|---|---|---|---|---|---|
| ROA | 20.5% | 8.9% | 4.0% | -5.8% | 2.1% | 13.4% | 8.4% | -0.29% | 5.5% | · | |
| ROE | 31.0% | 14.7% | 7.0% | -9.8% | 3.4% | 22.5% | 14.6% | -0.52% | 10.2% | · | |
| ROIC | 29.5% | 15.1% | 7.7% | 0.58% | 3.3% | 21.8% | 13.9% | -1.0% | 7.8% | · |
तरलता और शोधन क्षमता
| मेट्रिक | रुझान | 2025 | 2024 | 2023 | 2022 | 2021 | 2020 | 2019 | 2018 | 2017 | 2016 |
|---|---|---|---|---|---|---|---|---|---|---|---|
| Current Ratio | 2.3 | 2.0 | 2.6 | 2.5 | 2.6 | 1.8 | 3.0 | 2.6 | 3.9 | · | |
| Quick Ratio | 0.7 | 0.3 | 0.7 | 0.8 | 0.8 | 0.5 | 0.7 | 0.5 | 1.2 | · | |
| Interest Coverage | 40.1 | 30.5 | 11.6 | 1.7 | 6.5 | 21.2 | 12.9 | 2.8 | 3.9 | · |
दक्षता
| मेट्रिक | रुझान | 2025 | 2024 | 2023 | 2022 | 2021 | 2020 | 2019 | 2018 | 2017 | 2016 |
|---|---|---|---|---|---|---|---|---|---|---|---|
| Inventory Turnover | 2.6 | 2.7 | 2.8 | 2.6 | 2.4 | 1.8 | 2.0 | 2.5 | 2.5 | · |
प्रति शेयर
| मेट्रिक | रुझान | 2025 | 2024 | 2023 | 2022 | 2021 | 2020 | 2019 | 2018 | 2017 | 2016 |
|---|---|---|---|---|---|---|---|---|---|---|---|
| Cash Flow / Share | $3.07 | $1.98 | · | · | $0.89 | $1.54 | $0.97 | $0.63 | $0.76 | · | |
| EPS (TTM) | $1.95 | $0.77 | $0.34 | $-0.47 | $0.17 | $1.06 | $0.57 | $-0.02 | $0.35 | · |
मूल्यांकन (TTM)
| मेट्रिक | रुझान | 2025 | 2024 | 2023 | 2022 | 2021 | 2020 | 2019 | 2018 | 2017 | 2016 |
|---|---|---|---|---|---|---|---|---|---|---|---|
| Net Income TTM | $2.39B | $949M | $416M | $-605M | $221M | $1.34B | $719M | $-24M | $445M | · | |
| P/E | 14.4 | 12.0 | 17.8 | -8.7 | 34.2 | 6.9 | 8.3 | -162.0 | 12.3 | · | |
| Earnings Yield | 6.9% | 8.3% | 5.6% | -11.5% | 2.9% | 14.4% | 12.0% | -0.62% | 8.1% | · |
प्रति शेयर
| मेट्रिक | रुझान | Q4 2016 | Q4 2015 | Q4 2014 | Q4 2013 | Q4 2012 | Q4 2011 | Q4 2010 | Q4 2009 | Q4 2008 | Q4 2007 | Q4 2006 | Q4 2005 | Q4 2004 | Q4 2003 | Q4 2002 |
|---|---|---|---|---|---|---|---|---|---|---|---|---|---|---|---|---|
| EPS (TTM) | $-0.08 | · | · | · | · | · | · | · | · | · | · | · | · | · | · |
मूल्यांकन (TTM)
| मेट्रिक | रुझान | Q4 2016 | Q4 2015 | Q4 2014 | Q4 2013 | Q4 2012 | Q4 2011 | Q4 2010 | Q4 2009 | Q4 2008 | Q4 2007 | Q4 2006 | Q4 2005 | Q4 2004 | Q4 2003 | Q4 2002 |
|---|---|---|---|---|---|---|---|---|---|---|---|---|---|---|---|---|
| Net Income TTM | $-104M | · | · | · | · | · | · | · | · | · | · | · | · | · | · | |
| P/E | -38.9 | · | · | · | · | · | · | · | · | · | · | · | · | · | · | |
| Earnings Yield | -2.6% | · | · | · | · | · | · | · | · | · | · | · | · | · | · |
सबसे हाल की अवधि बाईं ओर · शून्य मान इस प्रकार दिखाए गए हैं ·
वित्तीय विवरण आय विवरण, बैलेंस शीट, नकदी प्रवाह — वार्षिक, पिछले 5 वर्ष
| मेट्रिक | 2025-12-31 | 2024-12-31 | 2023-12-31 | 2022-12-31 | 2021-12-31 |
|---|---|---|---|---|---|
| शुद्ध आय | $2.39B | $949M | $416M | $-605M | $221M |
| तनुकरणित EPS | $1.95 | $0.77 | $0.34 | $-0.47 | $0.17 |
| मेट्रिक | 2025-12-31 | 2024-12-31 | 2023-12-31 | 2022-12-31 | 2021-12-31 |
|---|---|---|---|---|---|
| वर्तमान अनुपात | 2.3 | 2.0 | 2.6 | 2.5 | 2.6 |
| त्वरित अनुपात | 0.7 | 0.3 | 0.7 | 0.8 | 0.8 |
| मेट्रिक | 2025-12-31 | 2024-12-31 | 2023-12-31 | 2022-12-31 | 2021-12-31 |
|---|---|---|---|---|---|
| फ्री कैश फ्लो | $2.57B | $1.37B | · | · | $197M |
संस्थागत मालिक (13F) 707 फाइलर्स · $19.1B कुल · तिथि अनुसार 30 सितमबर 2026
संस्थान जो अपनी तिमाही SEC फॉर्म 13F में इस स्टॉक को होल्ड करने की रिपोर्ट करते हैं। केवल लॉन्ग पोजीशन; एक ही फाइलर अलग-अलग ऑप्शन लेग्स के लिए दो बार दिखाई दे सकता है। बड़े ऑफसेटिंग पुट/कॉल लेग्स आमतौर पर मार्केट-मेकिंग या हेज्ड इन्वेंट्री को दर्शाते हैं, न कि दिशात्मक विश्वास को।
| नई स्थितियाँ | बाहर निकली पोजीशन | बढ़ाया | घटा हुआ | शुद्ध शेयर परिवर्तन |
|---|---|---|---|---|
| 76 (-54 पिछली तिमाही की तुलना में) | 90 (+31 पिछली तिमाही की तुलना में) | 252 (+15 पिछली तिमाही की तुलना में) | 242 (+12 पिछली तिमाही की तुलना में) | +16.4M |
Q1 2026 की तुलना में। SEC फॉर्म 13F फाइलिंग तिमाही के अंत के 45 दिनों के भीतर देय होती है, साथ ही देर से फाइल करने वालों के लिए एक छोटा बफर भी होता है — उस विंडो के भीतर आने वाली तिमाहियों को सबसे हालिया पूरी तरह से रिपोर्ट की गई जोड़ी के पक्ष में छोड़ दिया जाता है।
| संस्था | मूल्य | शेयर | % ट्रैक किए गए 13F का | प्रकार |
|---|---|---|---|---|
| VANGUARD GROUP INC | $1433344952 | 50887386 | 7.52% | शेयर |
| VAN ECK ASSOCIATES CORP | $1295586963 | 54855608 | 6.80% | शेयर |
| Boston Partners | $899756645 | 36038587 | 4.72% | शेयर |
| VANGUARD CAPITAL MANAGEMENT LLC | $789855012 | 33359590 | 4.14% | शेयर |
| ROYAL BANK OF CANADA | $779032000 | 32981828 | 4.09% | शेयर |
| ARROWSTREET CAPITAL, LIMITED PARTNERSHIP | $697850348 | 29515179 | 3.66% | शेयर |
| RENAISSANCE TECHNOLOGIES LLC | $584529171 | 24747213 | 3.07% | शेयर |
| FIL Ltd | $490677660 | 20723752 | 2.57% | शेयर |
| MACKENZIE FINANCIAL CORP | $436040296 | 12985119 | 2.29% | शेयर |
| GEODE CAPITAL MANAGEMENT, LLC | $370263818 | 14840976 | 1.94% | शेयर |
| BANK OF MONTREAL /CAN/ | $342235637 | 14468801 | 1.80% | शेयर |
| 1832 Asset Management L.P. | $337595653 | 14292788 | 1.77% | शेयर |
| NORGES BANK | $313894501 | 13274824 | 1.65% | शेयर |
| MORGAN STANLEY | $306631520 | 12981858 | 1.61% | शेयर |
| Man Group plc | $298152337 | 12621448 | 1.56% | शेयर |
| CIBC Asset Management Inc | $275302096 | 11602154 | 1.44% | शेयर |
| Connor, Clark & Lunn Investment Management Ltd. | $264652432 | 11188912 | 1.39% | शेयर |
| BANK OF AMERICA CORP /DE/ | $255636580 | 10822887 | 1.34% | शेयर |
| VANGUARD FIDUCIARY TRUST CO | $251039891 | 10602690 | 1.32% | शेयर |
| JPMORGAN CHASE & CO | $250490610 | 10533666 | 1.31% | शेयर |
| Legal & General Group Plc | $244762202 | 10341184 | 1.28% | शेयर |
| NATIONAL BANK OF CANADA /FI/ | $244381964 | 10328709 | 1.28% | शेयर |
| SCHRODER INVESTMENT MANAGEMENT GROUP | $238085019 | 10079806 | 1.25% | शेयर |
| Allianz Asset Management GmbH | $227141000 | 9596638 | 1.19% | शेयर |
| MANUFACTURERS LIFE INSURANCE COMPANY, THE | $222973542 | 9435939 | 1.17% | शेयर |
| DEUTSCHE BANK AG\ | $217800021 | 9221000 | 1.14% | शेयर |
| CANADA PENSION PLAN INVESTMENT BOARD | $217190177 | 9182216 | 1.14% | शेयर |
| GOLDMAN SACHS GROUP INC | $215600711 | 9127887 | 1.13% | शेयर |
| Ninety One UK Ltd | $207995648 | 8614109 | 1.09% | शेयर |
| AQR CAPITAL MANAGEMENT LLC | $205351902 | 8777685 | 1.08% | शेयर |
| Amundi | $197878133 | 8376494 | 1.04% | शेयर |
| Invesco Ltd. | $188345194 | 7973971 | 0.99% | शेयर |
| CIBC WORLD MARKET INC. | $186048766 | 7864688 | 0.98% | शेयर |
| FMR LLC | $168707882 | 7130430 | 0.89% | शेयर |
| AustralianSuper Pty Ltd | $166115355 | 7022910 | 0.87% | शेयर |
| TORONTO DOMINION BANK | $156848972 | 6631151 | 0.82% | शेयर |
| DIMENSIONAL FUND ADVISORS LP | $156143384 | 6610297 | 0.82% | शेयर |
| TD Asset Management Inc | $155927792 | 6587926 | 0.82% | शेयर |
| First Eagle Investment Management, LLC | $151522135 | 6414993 | 0.80% | शेयर |
| MASSACHUSETTS FINANCIAL SERVICES CO /MA/ | $150902208 | 5199404 | 0.79% | शेयर |
| BANK OF NOVA SCOTIA | $125827667 | 5314702 | 0.66% | शेयर |
| Vanguard Global Advisers, LLC | $121079963 | 5113822 | 0.64% | शेयर |
| AMERICAN CENTURY COMPANIES INC | $118689383 | 5020395 | 0.62% | शेयर |
| UBS Group AG | $116009631 | 4911500 | 0.61% | शेयर |
| TWO SIGMA INVESTMENTS, LP | $92890799 | 3932718 | 0.49% | शेयर |
| Swiss National Bank | $91377497 | 3870618 | 0.48% | शेयर |
| JANE STREET GROUP, LLC | $87359728 | 3698549 | 0.46% | शेयर |
| CI INVESTMENTS INC. | $84137581 | 3562133 | 0.44% | शेयर |
| BlackRock, Inc. | $83289851 | 3526243 | 0.44% | शेयर |
| Cape Ann Asset Management Ltd | $82913617 | 3510314 | 0.44% | शेयर |
कार्यकर्ता और 5%+ मालिक 17 होल्डिंग्स
जिन निवेशकों ने SEC शेड्यूल 13D दाखिल किया है — जारीकर्ता को प्रभावित करने के इरादे से 5% से अधिक लाभकारी स्वामित्व (कार्यकर्ता दांव, बोर्ड अभियान, M&A)। प्रत्येक पंक्ति उस फाइलर की स्थिति की सबसे हालिया ज्ञात स्थिति दिखाती है।
| फाइलर | दाखिल किया | दांव | स्थिति | उद्देश्य | फाइलिंग |
|---|---|---|---|---|---|
| Kinross Gold Corporation ×5 फाइलिंग | 30 मार्च 2011 | · | प्रारंभिक फाइलिंग | · | SEC |
| अघोषित रिपोर्टिंग व्यक्ति | 14 अप्रैल 2006 | · | प्रारंभिक फाइलिंग | M&A / बिक्री | SEC |
| अघोषित रिपोर्टिंग व्यक्ति | 28 नवमबर 2005 | · | प्रारंभिक फाइलिंग | निष्क्रिय निवेश | SEC |
| अघोषित रिपोर्टिंग व्यक्ति | 26 अक्टूबर 2004 | · | प्रारंभिक फाइलिंग | · | SEC |
| अघोषित रिपोर्टिंग व्यक्ति | 30 अगस्त 2004 | · | प्रारंभिक फाइलिंग | · | SEC |
| अघोषित रिपोर्टिंग व्यक्ति | 5 अगस्त 2004 | · | प्रारंभिक फाइलिंग | · | SEC |
| अघोषित रिपोर्टिंग व्यक्ति | 7 जून 2004 | · | प्रारंभिक फाइलिंग | · | SEC |
| अघोषित रिपोर्टिंग व्यक्ति | 30 अप्रैल 2004 | · | प्रारंभिक फाइलिंग | निष्क्रिय निवेश | SEC |
| अघोषित रिपोर्टिंग व्यक्ति | 31 दिसमबर 2003 | · | प्रारंभिक फाइलिंग | · | SEC |
| अघोषित रिपोर्टिंग व्यक्ति, अघोषित रिपोर्टिंग व्यक्ति, अघोषित रिपोर्टिंग व्यक्ति | 19 सितमबर 2003 | · | प्रारंभिक फाइलिंग | · | SEC |
| अघोषित रिपोर्टिंग व्यक्ति, अघोषित रिपोर्टिंग व्यक्ति, अघोषित रिपोर्टिंग व्यक्ति | 16 सितमबर 2003 | · | प्रारंभिक फाइलिंग | · | SEC |
| अघोषित रिपोर्टिंग व्यक्ति, अघोषित रिपोर्टिंग व्यक्ति, अघोषित रिपोर्टिंग व्यक्ति | 6 अगस्त 2003 | · | प्रारंभिक फाइलिंग | · | SEC |
| अघोषित रिपोर्टिंग व्यक्ति, अघोषित रिपोर्टिंग व्यक्ति, अघोषित रिपोर्टिंग व्यक्ति | 10 फ़रवरी 2003 | · | प्रारंभिक फाइलिंग | निष्क्रिय निवेश | SEC |
| अघोषित रिपोर्टिंग व्यक्ति | 26 अप्रैल 2002 | · | प्रारंभिक फाइलिंग | · | SEC |
| अघोषित रिपोर्टिंग व्यक्ति | 9 अप्रैल 2002 | · | प्रारंभिक फाइलिंग | बोर्ड अभियान | SEC |
| अघोषित रिपोर्टिंग व्यक्ति | 14 सितमबर 2001 | · | प्रारंभिक फाइलिंग | बोर्ड अभियान | SEC |
| अघोषित रिपोर्टिंग व्यक्ति | 20 जुलाई 2001 | · | प्रारंभिक फाइलिंग | · | SEC |
Purpose is an automated classification of the filer's own stated purpose (SEC Item 4) — not investment advice. "—" means no clear purpose was stated or the text could not be classified.
ईटीएफ स्वामित्व 27 ETFs द्वारा धारित
वजन केवल प्रत्यक्ष इक्विटी होल्डिंग्स (N-PORT) को दर्शाता है; लीवरेज्ड या डेरिवेटिव-आधारित फंड में अतिरिक्त स्वैप एक्सपोजर हो सकता है जो नहीं दिखाया गया है।
| फंड | भार | इकाइयाँ | तिथि अनुसार | स्रोत |
|---|---|---|---|---|
| MGNR · AMERICAN BEACON SELECT FUNDS | 2.76% | 1006954 NS | 31 जुलाई 2026 | N-PORT |
| ABLD · Abacus FCF ETF Trust | 2.32% | 92972 NS | 31 जुलाई 2026 | N-PORT |
| NRES · DBX ETF Trust | 2.02% | 24738 NS | 31 अगस्त 2026 | N-PORT |
| ABLG · Abacus FCF ETF Trust | 1.60% | 11196 NS | 31 जुलाई 2026 | N-PORT |
| ICOW · Pacer Funds Trust | 1.17% | 918496 NS | 31 जुलाई 2026 | N-PORT |
| DARP · Tidal Trust II | 1.08% | 15535 NS | 31 जुलाई 2026 | N-PORT |
| BBCA · J.P. Morgan Exchange-Traded Fund Tr… | 0.90% | 4249615 NS | 31 जुलाई 2026 | N-PORT |
| IGE · iShares Trust | 0.84% | 232961 SH | 11 सितमबर 2026 | दैनिक |
| GUNR · FlexShares Trust | 0.67% | 2111502 NS | 31 जुलाई 2026 | N-PORT |
| FEDM · FlexShares Trust | 0.56% | 19257 NS | 31 जुलाई 2026 | N-PORT |
| DIHP · Dimensional ETF Trust | 0.52% | 1435670 NS | 31 जुलाई 2026 | N-PORT |
| PIEL · Pacer Funds Trust | 0.37% | 184 NS | 31 जुलाई 2026 | N-PORT |
| WLDR · Two Roads Shared Trust | 0.26% | 10431 NS | 31 जुलाई 2026 | N-PORT |
| FTLS · First Trust Exchange-Traded Fund III | 0.26% | 276036 NS | 31 जुलाई 2026 | N-PORT |
| DXIV · Dimensional ETF Trust | 0.21% | 18797 NS | 31 जुलाई 2026 | N-PORT |
| DFAX · Dimensional ETF Trust | 0.19% | 994129 NS | 31 जुलाई 2026 | N-PORT |
| DFIC · Dimensional ETF Trust | 0.19% | 1201837 NS | 31 जुलाई 2026 | N-PORT |
| FDEV · Fidelity Covington Trust | 0.17% | 21233 NS | 31 जुलाई 2026 | N-PORT |
| SPWO · SP Funds Trust | 0.14% | 12250 NS | 31 जुलाई 2026 | N-PORT |
| DFSI · Dimensional ETF Trust | 0.13% | 62862 NS | 31 जुलाई 2026 | N-PORT |
| DFAI · Dimensional ETF Trust | 0.13% | 947691 NS | 31 जुलाई 2026 | N-PORT |
| BKIE · BNY Mellon ETF Trust | 0.11% | 60474 NS | 31 जुलाई 2026 | N-PORT |
| DEEF · DBX ETF Trust | 0.10% | 1928 NS | 31 अगस्त 2026 | N-PORT |
| TLTD · FlexShares Trust | 0.09% | 25410 NS | 31 जुलाई 2026 | N-PORT |
| GLBL · Pacer Funds Trust | 0.07% | 32 NS | 31 जुलाई 2026 | N-PORT |
| KOKU · DBX ETF Trust | 0.04% | 10902 NS | 31 अगस्त 2026 | N-PORT |
| DFIV · Dimensional ETF Trust | 0.01% | 85829 NS | 31 जुलाई 2026 | N-PORT |
KGC विश्लेषक सर्वसम्मति तेजी और मंदी के विश्लेषक राय, 12-महीने का मूल्य लक्ष्य, अपसाइड
12-महीने का मूल्य लक्ष्य
10 विश्लेषक · 2026-10-25माध्य लक्ष्य $31.00 +38.8%
ताज़ा समाचार इस कंपनी का उल्लेख करने वाली हालिया सुर्खियां
मेरे मेट्रिक्स आपकी व्यक्तिगत वॉचलिस्ट — पूर्ण फंडामेंटल से चयनित पंक्तियाँ
उन मेट्रिक्स को चुनें जो आपके लिए मायने रखते हैं — ऊपर फुल फंडामेंटल्स में किसी भी पंक्ति के बगल में + पर क्लिक करें।
आपका चयन सहेजा गया है और यह सभी टिकर में आपके साथ रहता है।