
CMSD CMS Energy Corporation 5.875% Junior Subordinated Notes due 2079
NYSE · Utilities · Wyświetl na SEC EDGAR ↗ zamknij Paź 2, 2026 10-K/10-Q Lip 28, 2026CMSD Migawka akcji Cena, kapitalizacja rynkowa, P/E, EPS, ROE, zadłużenie/kapitał własny, zakres 52-tygodniowy
CMSD Wykres ceny akcji Dzienny OHLCV ze wskaźnikami technicznymi — przesuwaj, powiększaj i dostosowuj widok
Granularność słupków dostosowuje się do wybranego okresu — najedź kursorem na wykres, aby zobaczyć otwarcia/maksima/minima/zamknięcia dla danego słupka.
O CMS Energy Corporation 5.875% Junior Subordinated Notes due 2079 Przegląd firmy z Wikipedii
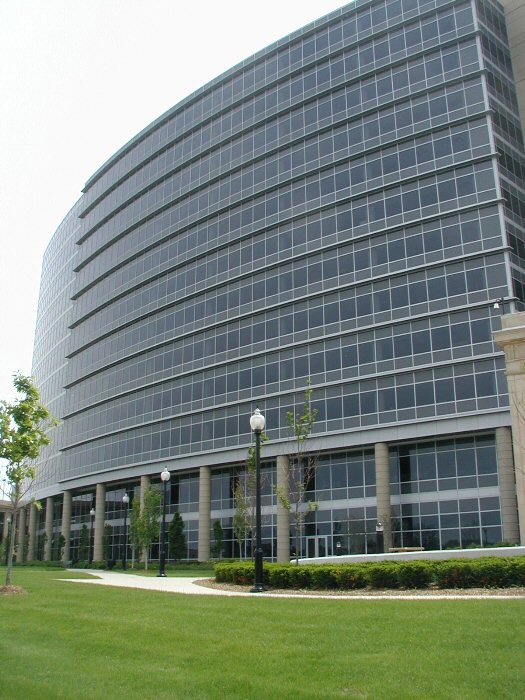
CMS Energy Corporation is an American energy company based in Jackson, Michigan, that is focused principally on utility operations in Michigan. Its principal business is Consumers Energy, a public utility that provides electricity and natural gas to more than 6 million of Michigan's 10 million residents. Its non-utility businesses are focused primarily on domestic independent power production. Consumers Energy has operated since 1886.
NorthStar Clean Energy's primary businesses are independent power production and natural gas transmission.
History
CMS Energy was formed in 1987 as a holding company with its principal subsidiaries as Consumers Energy and NorthStar Clean Energy. On October 23, 1987, CMS Energy became a publicly owned company and was listed at the New York Stock Exchange. The company's history dates back to 1886, when William Augustine Foote and Samuel Jarvis initially approached Jackson, Michigan officials and asked them to support efforts to illuminate Jackson's downtown with electric arc lights. They formed a company, Jackson Electric Light Works in 1888. In 1889, they built a hydro plant project at the Trowbridge Dam on the Kalamazoo River in Allegan. Foote, after seeing some early success, began consolidating his small power companies and formed Commonwealth Power Company.
In 1907, Foote and Jarvis built Croton Hydro project on the Muskegon River, the first project in the world that could transmit 110,000 volts of electricity. In 1920, Foote and Jarvis offered preferred shares of their company to the public to secure sufficient financing to enter other energy and power generation sectors. Over the next decades the company built several coal-fired, natural gas, nuclear and electric facilities. In 1946, the company formed a strategic partnership with Panhandle Company to convert former natural gas fields to underground natural gas storage areas. CMS Energy's primary subsidiary, Consumers Energy, announced Michigan's first nuclear power plant in 1961, Big Rock Point in Charlevoix, Michigan.
The company announced another nuclear plant, Palisades Nuclear Generating Station on Lake Michigan, which first produced electricity in December, 1971 to serve 400,000 people a day. CMS Energy owned the plant until 2006, when it was sold to Entergy. It then announced a gas reforming plant to furnish heat for Michigan homes in 1971. This plant was the first of its kind in North America to produce synthetic gas, converting impure liquid petroleum into pipeline-quality natural gas.
In 1987, CMS Energy, a holding company with its principal subsidiaries as Consumers Power and CMS Enterprises was formed. Consumers Power was rebranded Consumers Energy in 1997. The firm was one of the first companies to introduce an online billing system in the late 1990s.
In 2001, the firm entered into an exploration agreement with Eritrea for oil exploration in the Dismin Block of the Red Sea.
In 2002, CMS Energy founded EnerBank USA.
In 2003, the firm moved its headquarters to One Energy Plaza in Jackson, Michigan. In 2007, the company announced plans to invest $6 billion in Michigan's energy future to support new power plant technology and identify new energy sources. In 2014, Consumers Energy opened Cross Winds Energy Park in Michigan's Tuscola County and signed a contract with General Electric to supply 621.79-kilowatt wind turbine engines for the project which has a total generating capacity of 105 megawatts.
Oct 1, 2021, CMS Energy Completes Sale of EnerBank USA to Regions Bank.
On Nov 1st 2022, CMS Enterprises changes name to NorthStar Clean Energy as it begins to serve more corporate clients.
Sustainability and Environment
In 2015, 9 percent of CMS Energy's power comes from renewable energy sources. Primary CMS Energy subsidiary Consumers Energy joined the Wildlife Habitat Council as an active member. By 2007, all power facilities received the Clean Corporate Citizen award from the Michigan Department of Environmental Quality.
Awards
Consumers Energy, CMS Energy's primary subsidiary, was named Energy Star Partner of the Year in 2014 and 2015 for excellence in sustainable energy efficiency programs. In 2014, Consumers Energy was ranked among the top 15 most sustainable energy providers. Later that year, CMS Energy received Edison Electric Institute's Index Award for top cumulative shareholder return in the small cap category. The firm received the 2015 Emergency Recovery Award for its electricity restoration efforts during the December 2013 North American storm complex.
Criticism
In December 2011, the non-partisan organization Public Campaign criticized CMS Energy for spending $3.48 million on lobbying and not paying any taxes during 2008-2010, instead getting $29 million in tax rebates, despite making a profit of $415 million, and increasing executive pay by 79% to $900.4 million in 2010 for its top 5 executives.
Philanthropy
CMS Energy has helped establish and finance numerous research, educational and cultural institutes in the United States. Consumers Energy was given the William Booth Award in 2013 by The Salvation Army in recognition of its long history of philanthropic activities and leadership for the PeopleCare assistance program.
CMS Energy participates in internship and cooperative education programs to build career opportunities in Michigan. Consumers Energy has also worked on early childhood development and education in Michigan and has also received Wildlife Habitat Council (WHC) compliant certificates for its efforts to promote environmental education.
Źródło: Wikipedia (Angielski), CC BY-SA 4.0 · Zobacz w Wikipedii ↗
Wyniki 10-letnie Trendy przychodów, zysku netto, marż i EPS
Wycena Wskaźniki P/E, P/S, P/B, EV/EBITDA — czy akcje są drogie, czy tanie?
| Wskaźnik | Trend 5-letni | CMSD | średnia z 5 lat | Mediana porównawcza | Werdykt |
|---|---|---|---|---|---|
| P/B (MRQ) | 0.7 | · | · | · |
Mediana porównawcza jest obliczana na znormalizowanej podstawie dla każdej metryki i może nie zawsze odpowiadać podstawie TTM/MRQ pokazanej dla tej akcji.
Rentowność Marże brutto, operacyjne i netto; ROE, ROA, ROIC
Za mało danych fundamentalnych, aby obliczyć tę grupę wskaźników.
Zdrowie finansowe Dług, płynność, wypłacalność — siła bilansu
| Wskaźnik | Trend 5-letni | CMSD | średnia z 5 lat | Mediana porównawcza | Werdykt |
|---|---|---|---|---|---|
| Dług / Kapitał Własny (MRQ) | 1.9 | · | · | · | |
| Wskaźnik bieżący (MRQ) | 0.9 | · | · | · | |
| Dług długoterminowy / Kapitał własny (MRQ) | 1.9 | · | · | · |
Rozwój Wzrost przychodów, EPS i zysku netto: r/r, CAGR 3-letni, CAGR 5-letni
Za mało danych fundamentalnych, aby obliczyć tę grupę wskaźników.
Efektywność kapitałowa Rotacja aktywów, rotacja zapasów, rotacja należności
Za mało danych fundamentalnych, aby obliczyć tę grupę wskaźników.
wartość · ≈ średnia z 5 lat · mediana branżowa · werdykt względem mediany
Dywidendy Stopa dywidendy, wskaźnik wypłaty, historia dywidend, 5-letni CAGR
| Data ex-dywidendy | Kwota | Waluta | Stopa zwrotu |
|---|---|---|---|
| Sie 17, 2026 | $0,37 | USD | ≈6.9% |
| Maj 15, 2026 | $0,37 | USD | ≈6.4% |
| Lut 13, 2026 | $0,37 | USD | ≈6.2% |
| Lis 14, 2025 | $0,37 | USD | ≈6.1% |
| Sie 15, 2025 | $0,37 | USD | ≈6.3% |
| Maj 16, 2025 | $0,37 | USD | ≈6.7% |
| Lut 14, 2025 | $0,37 | USD | ≈6.2% |
| Lis 15, 2024 | $0,37 | USD | ≈6.0% |
| Sie 16, 2024 | $0,37 | USD | ≈6.0% |
| Maj 16, 2024 | $0,37 | USD | ≈6.0% |
| Lut 14, 2024 | $0,37 | USD | ≈6.0% |
| Lis 15, 2023 | $0,37 | USD | ≈6.2% |
| Sie 16, 2023 | $0,37 | USD | ≈6.2% |
| Maj 16, 2023 | $0,37 | USD | ≈6.1% |
| Lut 13, 2023 | $0,37 | USD | ≈6.0% |
| Lis 15, 2022 | $0,37 | USD | ≈6.2% |
| Sie 16, 2022 | $0,37 | USD | ≈5.8% |
| Maj 16, 2022 | $0,37 | USD | ≈6.0% |
| Lut 11, 2022 | $0,36 | USD | ≈5.6% |
| Lis 15, 2021 | $0,37 | USD | ≈5.5% |
Historia zysków EPS faktyczny vs szacowany, zaskoczenie %, wskaźnik trafień, data następnych wyników
| Okres | Raport | EPS Actual | EPS Szacowany | Niespodzianka |
|---|---|---|---|---|
| 30 czerwca 2026 | $0.37 | $0.36 | 1.6% | |
| 31 marca 2026 | $1.13 | $1.11 | 1.9% | |
| 31 grudnia 2025 | $0.94 | $0.95 | -1.2% | |
| 30 września 2025 | $0.93 | $0.85 | 8.9% | |
| 30 czerwca 2025 | $0.71 | $0.70 | 2.1% | |
| 31 marca 2025 | $1.02 | $1.02 | -0.41% |
Pełne podstawowe wskaźniki Wszystkie wskaźniki roczne — rachunek zysków i strat, bilans, przepływy pieniężne
Bilans
| Wskaźnik | Trend | 2025 |
|---|---|---|
| Cash & Equivalents | $509M | |
| Other Current Assets | $160M | |
| Current Assets | $3.47B | |
| PP&E (Net) | $30.68B | |
| Accum. Depreciation | $10.13B | |
| Other Non-current Assets | $398M | |
| Total Assets | $39.94B | |
| Current Liabilities | $3.55B | |
| Deferred Tax | $3.25B | |
| Other Non-current Liabilities | $392M | |
| Long-term Debt | $18.76B | |
| Common Stock | $3M | |
| Retained Earnings | $2.44B | |
| AOCI | $-36M | |
| Stockholders' Equity | $9.14B | |
| Liabilities + Equity | $39.94B | |
| Shares Outstanding | 306,400,000 |
Rachunek zysków i strat
| Wskaźnik | Trend | Q2 2026 | Q1 2026 | Q2 2025 | Q1 2025 |
|---|---|---|---|---|---|
| Revenue | $1.83B | $2.73B | $1.84B | $2.45B | |
| Operating Expenses | $1.56B | $2.24B | $1.52B | $1.95B | |
| Operating Income | $264M | $490M | $317M | $494M | |
| Other Non-op | $75M | $75M | $137M | $50M | |
| Pretax Income | $129M | $362M | $255M | $358M | |
| Income Tax | $33M | $85M | $62M | $63M | |
| Net Income | $120M | $340M | $201M | $304M | |
| EPS (Basic) | $0.38 | $1.10 | $0.67 | $1.01 | |
| EPS (Diluted) | $0.37 | $1.10 | $0.66 | $1.01 | |
| Shares (Basic) | 310,200,000 | 306,400,000 | 298,500,000 | 298,200,000 | |
| Shares (Diluted) | 310,800,000 | 307,100,000 | 299,100,000 | 299,100,000 | |
| EBITDA | $572M | $902M | · | · |
Bilans
| Wskaźnik | Trend | Q2 2026 | Q1 2026 | Q2 2025 | Q1 2025 |
|---|---|---|---|---|---|
| Cash & Equivalents | $241M | $175M | · | · | |
| Other Current Assets | $243M | $225M | · | · | |
| Current Assets | $2.87B | $3.02B | · | · | |
| PP&E (Net) | $32.33B | $31.53B | · | · | |
| Accum. Depreciation | $10.50B | $10.38B | · | · | |
| Other Non-current Assets | $302M | $341M | · | · | |
| Total Assets | $40.91B | $40.28B | · | · | |
| Current Liabilities | $3.06B | $3.59B | · | · | |
| Deferred Tax | $3.40B | $3.35B | · | · | |
| Other Non-current Liabilities | $444M | $417M | · | · | |
| Long-term Debt | $19.04B | $18.86B | · | · | |
| Total Debt | $19.04B | $18.86B | · | · | |
| Common Stock | $3M | $3M | · | · | |
| Retained Earnings | $2.55B | $2.60B | · | · | |
| AOCI | $-35M | $-35M | · | · | |
| Stockholders' Equity | $9.77B | $9.47B | · | · | |
| Liabilities + Equity | $40.91B | $40.28B | · | · | |
| Shares Outstanding | 313,600,000 | 308,900,000 | · | · |
Przepływy pieniężne
| Wskaźnik | Trend | Q2 2026 | Q1 2026 | Q2 2025 | Q1 2025 |
|---|---|---|---|---|---|
| D&A | $308M | $412M | $288M | $388M | |
| Other Non-cash | · | $-47M | · | · | |
| Operating Cash Flow | $622M | $705M | · | $1.00B | |
| CapEx | $967M | $1.04B | · | $888M | |
| Investing Cash Flow | $-1.02B | $-1.07B | · | $-918M | |
| Debt Issued | $909M | $258M | · | $1.20B | |
| Net Debt Issued | · | $54M | · | · | |
| Stock Issued | $362M | $166M | · | $3M | |
| Net Stock Activity | · | $166M | · | · | |
| Financing Cash Flow | $480M | $16M | · | $266M | |
| Net Change in Cash | $82M | $-352M | · | $348M | |
| Free Cash Flow | · | $-334M | · | · |
Rentowność
| Wskaźnik | Trend | Q2 2026 | Q1 2026 | Q2 2025 | Q1 2025 |
|---|---|---|---|---|---|
| Operating Margin | 14.4% | 17.9% | · | · | |
| Net Margin | 6.6% | 12.4% | · | · | |
| Pretax Margin | 7.0% | 13.3% | · | · | |
| EBITDA Margin | 31.3% | 33.0% | · | · | |
| ROA | 0.31% | 0.89% | · | · | |
| ROE | 1.3% | 3.8% | · | · | |
| ROIC | 0.68% | 1.3% | · | · |
Płynność i wypłacalność
| Wskaźnik | Trend | Q2 2026 | Q1 2026 | Q2 2025 | Q1 2025 |
|---|---|---|---|---|---|
| Current Ratio | 0.9 | 0.8 | · | · | |
| Quick Ratio | 0.1 | 0.0 | · | · | |
| Debt / Equity | 1.9 | 2.0 | · | · | |
| LT Debt / Equity | 1.9 | 1.8 | · | · |
Efektywność
| Wskaźnik | Trend | Q2 2026 | Q1 2026 | Q2 2025 | Q1 2025 |
|---|---|---|---|---|---|
| Asset Turnover | 0.0 | 0.1 | · | · |
Na akcję
| Wskaźnik | Trend | Q2 2026 | Q1 2026 | Q2 2025 | Q1 2025 |
|---|---|---|---|---|---|
| Book Value / Share | $31.17 | $30.64 | · | · | |
| Revenue / Share | $5.88 | $8.89 | · | · | |
| Cash Flow / Share | · | $2.30 | · | · | |
| Cash / Share | $0.77 | $0.57 | · | · | |
| Dividend / Share | $0.57 | $0.57 | $0.54 | $0.54 | |
| EPS (TTM) | $3.33 | $3.62 | $3.39 | $3.38 |
Wycena (TTM)
| Wskaźnik | Trend | Q2 2026 | Q1 2026 | Q2 2025 | Q1 2025 |
|---|---|---|---|---|---|
| Revenue TTM | $8.81B | $8.82B | $8.02B | $7.79B | |
| Net Income TTM | $1.03B | $1.11B | $1.02B | $1.02B | |
| Market Cap | $6.87B | $6.83B | · | · | |
| Enterprise Value | $25.66B | $25.51B | · | · | |
| P/E | 6.6 | 6.1 | 6.5 | 6.7 | |
| P/S | 0.8 | 0.8 | 0.8 | 0.9 | |
| P/B | 0.7 | 0.7 | · | · | |
| P / Tangible Book | 0.7 | 0.7 | · | · | |
| P / Cash Flow | · | 9.7 | · | · | |
| EV / Revenue | 2.9 | 2.9 | 3.0 | 3.0 | |
| Earnings Yield | 15.2% | 16.4% | 15.3% | 14.8% |
Najnowszy okres po lewej · wartości null pokazane jako ·
Sprawozdania finansowe Rachunek zysków i strat, bilans, przepływy pieniężne — roczne, ostatnie 5 lat
Zbyt mało danych fundamentalnych, aby utworzyć to sprawozdanie.
Zbyt mało danych fundamentalnych, aby utworzyć to sprawozdanie.
Zbyt mało danych fundamentalnych, aby utworzyć to sprawozdanie.
Właściciele instytucjonalni (13F) 2 emitenci · $20K łącznie · Na dzień 30 czerwca 2026
Instytucje, które zgłaszają posiadanie tych akcji w swoich kwartalnych zgłoszeniach SEC Form 13F. Tylko pozycje długie; pojedynczy zgłaszający może pojawić się dwukrotnie dla oddzielnych transz opcji. Duże przeciwstawne pozycje put/call zazwyczaj odzwierciedlają działalność market-makingową lub zabezpieczone zapasy, a nie przekonanie kierunkowe.
| Nowe pozycje | Zamknięte pozycje | Zwiększone | Zmniejszony | Zmiana liczby akcji netto |
|---|---|---|---|---|
| 0 (-1 vs poprzedni kw.) | 0 (-1 vs poprzedni kw.) | 1 (+1 vs poprzedni kw.) | 1 (+1 vs poprzedni kw.) | +478 |
Porównano z Q1 2026. Zgłoszenia SEC Form 13F są wymagane w ciągu 45 dni od końca kwartału plus krótki bufor dla spóźnionych zgłoszeń — kwartały mieszczące się jeszcze w tym terminie są pomijane na rzecz ostatniej w pełni zgłoszonej pary.
| Instytucja | Wartość | Akcje | % z śledzonych 13F | Typ |
|---|---|---|---|---|
| First Command Advisory Services, Inc. | $16 075 | 734 | 81,20% | Akcje |
| PNC Financial Services Group, Inc. | $3 723 | 170 | 18,80% | Akcje |
Insiderzy spółki 1 insider · 1 dyrektorzy generalni · 0 dyrektorzy
| Insider | Rola | Ostatnia aktywność | Posiadane akcje | Kupna 12m | Sprzedaże 12m | Netto 12m |
|---|---|---|---|---|---|---|
| Srikanth Maddipati | EVP/CFO | 31 lipca 2026 P | 34 895 | 1 | 0 | $14 492 |
Insiderzy z zgłoszeń SEC Form 3/4/5; netto = tylko otwarty rynek P/S
Posiadanie ETF-ów Posiadane przez 1 fundusz ETF
Waga odzwierciedla wyłącznie bezpośrednie udziały kapitałowe (N-PORT); fundusze oparte na dźwigni lub instrumentach pochodnych mogą posiadać dodatkowe ekspozycje na swapy, które nie są pokazane.
| Fundusz | Waga | Jednostki | Na dzień | Źródło |
|---|---|---|---|---|
| FPE · First Trust Exchange-Traded Fund III | 0,25% | 705 428 NS | 31 lipca 2026 | N-PORT |
CMSD Konsensus analityków Bycze i niedźwiedzie opinie analityków, 12-miesięczny cel cenowy, potencjał wzrostu
Porównanie z porównywalnymi firmami (podbranża GICS) Kluczowe metryki w porównaniu do konkurentów z sektora
Podstawa R/R, ceny według zamknięcia z ostatniego końca roku obrotowego każdej spółki.
| Ticker | Kapitalizacja Rynkowa | P/E | Przychody r/r | Marża Netto | ROE | Marża brutto |
|---|---|---|---|---|---|---|
| CMSD | · | · | · | · | · | · |
| WEC | $34.32B | 21.9 | 14.0% | 15.9% | 11.2% | · |
| PEG | $39.99B | 19.0 | 18.2% | 17.3% | 12.6% | · |
| AEE | $27.60B | 18.7 | 15.4% | 16.6% | 11.5% | · |
| DTE | · | · | · | · | · | · |
| CNP | $25.03B | 24.0 | 8.3% | 11.2% | 9.5% | · |
| CMS | $21.43B | 19.8 | 13.6% | 12.5% | 12.3% | · |
| NI | $19.98B | 21.4 | 23.5% | 14.2% | 10.2% | · |
| BKH | $5.24B | 17.4 | 8.6% | 12.6% | 8.0% | · |
| NWE | $3.96B | 22.0 | 6.4% | 11.2% | 6.3% | · |
| NWE | $3.96B | 22.0 | 6.4% | 11.2% | 6.3% | · |
Moje wskaźniki Twoja osobista lista obserwowanych — wybrane wiersze z Pełnych Fundamentów
Wybierz wskaźniki, które są dla Ciebie ważne — kliknij + obok dowolnego wiersza w sekcji Pełne dane fundamentalne powyżej.
Twój wybór został zapisany i będzie Ci towarzyszył we wszystkich tickerach.