
ONBPO Old National Bancorp - Depositary Shares, Each Representing a 1/40th Interest in a Share of Series C Preferred Stock
O Old National Bancorp - Depositary Shares, Each Representing a 1/40th Interest in a Share of Series C Preferred Stock Przegląd firmy z Wikipedii
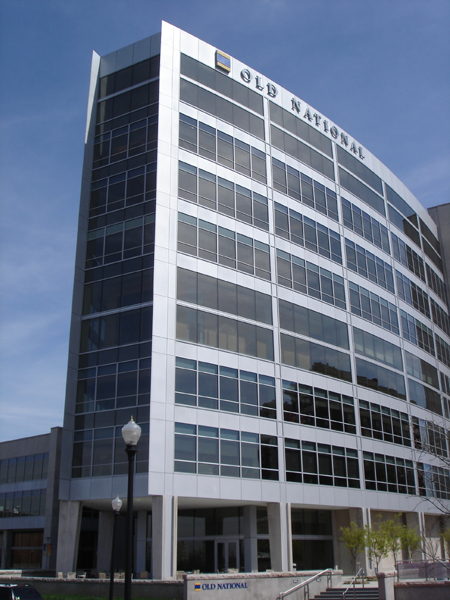
Old National Bank is an American regional bank with nearly 200 retail branches operated by Old National Bancorp and based in Chicago and Evansville, Indiana. With assets at $48.5 billion and 250 banking centers, Old National Bancorp is the largest financial services bank holding company headquartered in Indiana and one of the top 30 banking companies in the U.S. Old National Bank has locations in Illinois, Indiana, Iowa, Kentucky, Michigan, Minnesota, North Dakota, Tennessee, and Wisconsin.
Czytaj więcej
Old National Bank is an American regional bank with nearly 200 retail branches operated by Old National Bancorp and based in Chicago and Evansville, Indiana. With assets at $48.5 billion and 250 banking centers, Old National Bancorp is the largest financial services bank holding company headquartered in Indiana and one of the top 30 banking companies in the U.S. Old National Bank has locations in Illinois, Indiana, Iowa, Kentucky, Michigan, Minnesota, North Dakota, Tennessee, and Wisconsin.
History
The bank was founded in 1834.
In November 1995, Old National acquired the Greencastle-based First United Savings Bank for $18 million in stock. In the following year, Old National acquired the Bloomington-based Workingmens Capital Holdings with its Workingmens Federal Savings Bank subsidiary for an undisclosed amount in stock.
In 2009, Charter One's Indiana bank branches became Old National Bank after Old National Bank bought Charter One's Indiana operations. In January 2011, Old National acquired Bloomington-based Monroe Bancorp with its Monroe Bank subsidiary for $90 million in stock. Later that year, Integra Bank was closed by the Federal Deposit Insurance Corporation and all deposit accounts, excluding certain brokered deposits, were transferred to Old National. In 2012, Old National acquired 24 retail bank branches of Bank of America in Indiana and Michigan. In 2014, Old National acquired four banks: Tower Bank in Fort Wayne, Indiana, United Bank in Ann Arbor, Michigan, Lafayette Savings Bank in Lafayette, Indiana, and Founders Bank & Trust in Grand Rapids, Michigan.
In May 2016, AnchorBank, the third-largest bank based in Wisconsin, was bought by Old National for approximately $461 million.
In August 2017, Old National agreed to buy Anchor Bank of Minnesota for $303 million. The acquisition will add 17 locations in the Twin Cities and 1 in Mankato plus $1.7 billion in deposits and $2.1 billion in assets. In June 2018, KleinBank, based in Chaska, Minnesota, announced its 21 locations were being acquired by Old National, increasing Old National's presence in the western suburbs of Minneapolis.
In 2021, Old National merged with First Midwest Bancorp, combining the companies' assets, retaining the Old National name, and maintaining headquarters in Chicago and Evansville.
On April 10, 2023, a mass shooting at the Louisville, Kentucky branch resulted in five fatalities (all employees) and eight other injured people, including a rookie police officer. The injured officer's partner subsequently killed the perpetrator, who was a current bank employee.
In 2024, it was announced that CapStar Financial Holdings Inc. merged its operations with those of the bank. As a result, CapStar Bank became a division of Old National Bank.
On November 25, 2024, Old National announced its purchase of Minnesota-based Bremer Bank in a $1.4 billion sale which was finalized in October, 2025. The merger created a combined bank worth $70 billion.
Services
The company offers retail banking (checking accounts, savings accounts and certificates of deposit, consumer loans including home mortgages, and small business banking & lending), business or commercial banking (checking accounts, savings accounts & CDs, commercial loans and lines of credit, credit cards, capital markets, treasury management, and merchant services), and wealth management, investment, trust and retirement products and services.
Źródło: Wikipedia (Angielski), CC BY-SA 4.0 · Zobacz w Wikipedii ↗
ONBPO Migawka akcji Cena, kapitalizacja rynkowa, P/E, EPS, ROE, zadłużenie/kapitał własny, zakres 52-tygodniowy
ONBPO Wykres ceny akcji Dzienny OHLCV ze wskaźnikami technicznymi — przesuwaj, powiększaj i dostosowuj widok
Wyniki 10-letnie Trendy przychodów, zysku netto, marż i EPS
Wycena Wskaźniki P/E, P/S, P/B, EV/EBITDA — czy akcje są drogie, czy tanie?
Rentowność Marże brutto, operacyjne i netto; ROE, ROA, ROIC
Zdrowie finansowe Dług, płynność, wypłacalność — siła bilansu
Rozwój Wzrost przychodów, EPS i zysku netto: r/r, CAGR 3-letni, CAGR 5-letni
Efektywność kapitałowa Rotacja aktywów, rotacja zapasów, rotacja należności
Dywidendy Stopa dywidendy, wskaźnik wypłaty, historia dywidend, 5-letni CAGR
| Data ex-dywidendy | Kwota |
|---|---|
| 5 sierpnia 2026 | $0,4380 |
| 5 maja 2026 | $0,4380 |
| 5 lutego 2026 | $0,4380 |
| 5 listopada 2025 | $0,4380 |
| 5 sierpnia 2025 | $0,4380 |
| 5 maja 2025 | $0,4380 |
| 5 lutego 2025 | $0,4380 |
| 5 listopada 2024 | $0,4380 |
| 5 sierpnia 2024 | $0,4380 |
| 2 maja 2024 | $0,4380 |
| 2 lutego 2024 | $0,4380 |
| 2 listopada 2023 | $0,4380 |
| 3 sierpnia 2023 | $0,4380 |
| 4 maja 2023 | $0,4380 |
| 2 lutego 2023 | $0,4380 |
| 3 listopada 2022 | $0,4380 |
| 4 sierpnia 2022 | $0,4380 |
| 4 maja 2022 | $0,4380 |
| 3 lutego 2022 | $0,4380 |
| 4 listopada 2021 | $0,4380 |
ONBPO Konsensus analityków Bycze i niedźwiedzie opinie analityków, 12-miesięczny cel cenowy, potencjał wzrostu
- Mocne kupno 2 13,3%
- Kup 8 53,3%
- Trzymaj 5 33,3%
- Sprzedaj 0 0,0%
- Mocna sprzedaż 0 0,0%
Historia zysków EPS faktyczny vs szacowany, zaskoczenie %, wskaźnik trafień, data następnych wyników
| Okres | EPS Actual | EPS Szacowany | Niespodzianka |
|---|---|---|---|
| 30 czerwca 2026 | $0.65 | $0.64 | 0.01% |
| 31 marca 2026 | $0.61 | $0.61 | -0.00% |
| 31 grudnia 2025 | $0.62 | $0.60 | 0.02% |
| 30 września 2025 | $0.59 | $0.57 | 0.02% |
| 30 czerwca 2025 | $0.53 | $0.52 | 0.01% |
| 31 marca 2025 | $0.45 | $0.43 | 0.02% |
Porównanie z porównywalnymi firmami (podbranża GICS) Kluczowe metryki w porównaniu do konkurentów z sektora
| Ticker | Kapitalizacja Rynkowa | P/E | Przychody r/r | Marża Netto | ROE | Marża brutto |
|---|---|---|---|---|---|---|
| ONBPO | — | — | — | — | — | — |
| UMBF | $8.74B | 12.4 | 62.8% | 26.5% | 9.4% | — |
| WTFC | $9.36B | 12.3 | 5.9% | 310.1% | 11.4% | — |
| SSB | $9.33B | 12.0 | 56.1% | 29.8% | 8.9% | — |
| CFR | — | 12.8 | 8.3% | 29.0% | 14.8% | — |
| ZION | $8.64B | 9.7 | 3.6% | 135.8% | 13.1% | — |
| ONB | $8.69B | 12.5 | — | 26.5% | 8.1% | — |
| WAL | — | 9.6 | 99.7% | 713.6% | 13.5% | — |
| COLB | $8.26B | 12.2 | 18.8% | 310.7% | 8.5% | — |
| PB | $6.43B | 12.1 | 4.8% | 43.4% | 7.1% | — |
| BOKF | $7.18B | 12.9 | 6.1% | 26.6% | 10.1% | — |
Pełne podstawowe wskaźniki Wszystkie wskaźniki roczne — rachunek zysków i strat, bilans, przepływy pieniężne
Rachunek zysków i strat 8
| Wskaźnik | Trend | Q2 2026 |
|---|---|---|
| Interest Income | $894M | |
| Pretax Income | $324M | |
| Income Tax | $71M | |
| Net Income | $253M | |
| EPS (Basic) | $0.65 | |
| EPS (Diluted) | $0.65 | |
| Shares (Basic) | 381,864,000 | |
| Shares (Diluted) | 383,273,000 |
Bilans 11
| Wskaźnik | Trend | Q2 2026 |
|---|---|---|
| Cash & Equivalents | $1.77B | |
| Goodwill | $2.43B | |
| Intangibles | $433M | |
| Total Assets | $74.19B | |
| Total Liabilities | $65.61B | |
| Common Stock | $383M | |
| Retained Earnings | $2.78B | |
| AOCI | $-558M | |
| Stockholders' Equity | $8.58B | |
| Liabilities + Equity | $74.19B | |
| Shares Outstanding | 382,537,000 |
Przepływy pieniężne 10
| Wskaźnik | Trend | Q2 2026 |
|---|---|---|
| Stock-based Comp | $9M | |
| Amort. of Intangibles | $24M | |
| Operating Cash Flow | $280M | |
| CapEx | $4M | |
| Investing Cash Flow | $-1.17B | |
| Stock Repurchased | $115M | |
| Dividends Paid | $60M | |
| Financing Cash Flow | $908M | |
| Net Change in Cash | $14M | |
| Taxes Paid | $42M |
Rentowność 4
| Wskaźnik | Trend | Q2 2026 |
|---|---|---|
| Net Margin | 34.6% | |
| Pretax Margin | 44.2% | |
| ROA | 0.35% | |
| ROE | 3.0% |
Efektywność 1
| Wskaźnik | Trend | Q2 2026 |
|---|---|---|
| Asset Turnover | 0.0 |
Wycena (TTM) 8
| Wskaźnik | Trend | Q2 2026 |
|---|---|---|
| Revenue TTM | $124M | |
| Net Income TTM | $795M | |
| Market Cap | $9.46B | |
| P/E | 12.1 | |
| P/S | 76.2 | |
| P/B | 1.1 | |
| P / Tangible Book | 1.7 | |
| Earnings Yield | 8.2% |
Sprawozdania finansowe Rachunek zysków i strat, bilans, przepływy pieniężne — roczne, ostatnie 5 lat
Moje wskaźniki Twoja osobista lista obserwowanych — wybrane wiersze z Pełnych Fundamentów
Wybierz metryki, które są dla Ciebie ważne — kliknij ➕ obok dowolnego wiersza w Pełnych Fundamentach powyżej.
Twój wybór został zapisany i będzie Ci towarzyszył we wszystkich tickerach.
Właściciele instytucjonalni (13F) 1 emitent · $10K łącznie · Na dzień 30 czerwca 2026
Instytucje, które zgłaszają posiadanie tych akcji w swoich kwartalnych zgłoszeniach SEC Form 13F. Tylko pozycje długie; pojedynczy zgłaszający może pojawić się dwukrotnie dla oddzielnych transz opcji. Duże przeciwstawne pozycje put/call zazwyczaj odzwierciedlają działalność market-makingową lub zabezpieczone zapasy, a nie przekonanie kierunkowe.
| Nowe pozycje | Zamknięte pozycje | Zwiększone | Zmniejszony | Zmiana liczby akcji netto |
|---|---|---|---|---|
| 0 (0 vs poprzedni kw.) | 0 (0 vs poprzedni kw.) | 0 (0 vs poprzedni kw.) | 0 (0 vs poprzedni kw.) | 0 |
Porównano z Q1 2026. Zgłoszenia SEC Form 13F są wymagane w ciągu 45 dni od końca kwartału plus krótki bufor dla spóźnionych zgłoszeń — kwartały mieszczące się jeszcze w tym terminie są pomijane na rzecz ostatniej w pełni zgłoszonej pary.
| Instytucja | Wartość | Akcje | % z śledzonych 13F | Typ |
|---|---|---|---|---|
| Archer Investment Corp | $9 888 | 400 | 100,00% | Akcje |
Insiderzy spółki 1 insider · 1 dyrektorzy generalni · 0 dyrektorzy
| Insider | Rola | Ostatnia aktywność | Posiadane akcje | Kupna 12m | Sprzedaże 12m | Netto 12m |
|---|---|---|---|---|---|---|
| Nicholas J Chulos | Chief Legal Officer & Corp Sec | 28 lipca 2026 S | 53 544 | 0 | 1 | $-533 200 |
Insiderzy z zgłoszeń SEC Form 3/4/5; netto = tylko otwarty rynek P/S
Aktywiści i właściciele 5%+ 1 akcja
Inwestorzy, którzy złożyli SEC Schedule 13D — posiadanie beneficjentów powyżej 5% z zamiarem wpływania na emitenta (udziały aktywistów, kampanie zarządu, M&A). Każdy wiersz pokazuje najnowszy znany stan pozycji tego zgłaszającego.
| Zgłaszający | Złożono | Udział | Status | Cel | Zgłoszenie |
|---|---|---|---|---|---|
| Old National Bancorp | 31 października 2006 | — | Pierwotne zgłoszenie | M&A / sprzedaż | SEC |
Purpose is an automated classification of the filer's own stated purpose (SEC Item 4) — not investment advice. "—" means no clear purpose was stated or the text could not be classified.
Posiadanie ETF-ów Posiadane przez 1 fundusz ETF
Waga odzwierciedla wyłącznie bezpośrednie udziały kapitałowe (N-PORT); fundusze oparte na dźwigni lub instrumentach pochodnych mogą posiadać dodatkowe ekspozycje na swapy, które nie są pokazane.
| Fundusz | Waga | Jednostki | Na dzień | Źródło |
|---|---|---|---|---|
| PFLD · ETF Series Solutions | 0,07% | 11 101 NS | 30 kwietnia 2026 | N-PORT |