
ZIONP Zions Bancorporation N.A. - Depositary Shares each representing a 1/40th ownership interest in a share of Series A Floating-Rate Non-Cumulative Perpetual Preferred Stock
NASDAQ · Banking · Wyświetl na SEC EDGAR ↗ zamknij Paź 2, 2026 10-K/10-Q Sie 6, 2026ZIONP Migawka akcji Cena, kapitalizacja rynkowa, P/E, EPS, ROE, zadłużenie/kapitał własny, zakres 52-tygodniowy
ZIONP Wykres ceny akcji Dzienny OHLCV ze wskaźnikami technicznymi — przesuwaj, powiększaj i dostosowuj widok
Granularność słupków dostosowuje się do wybranego okresu — najedź kursorem na wykres, aby zobaczyć otwarcia/maksima/minima/zamknięcia dla danego słupka.
O Zions Bancorporation N.A. - Depositary Shares each representing a 1/40th ownership interest in a share of Series A Floating-Rate Non-Cumulative Perpetual Preferred Stock Przegląd firmy z Wikipedii
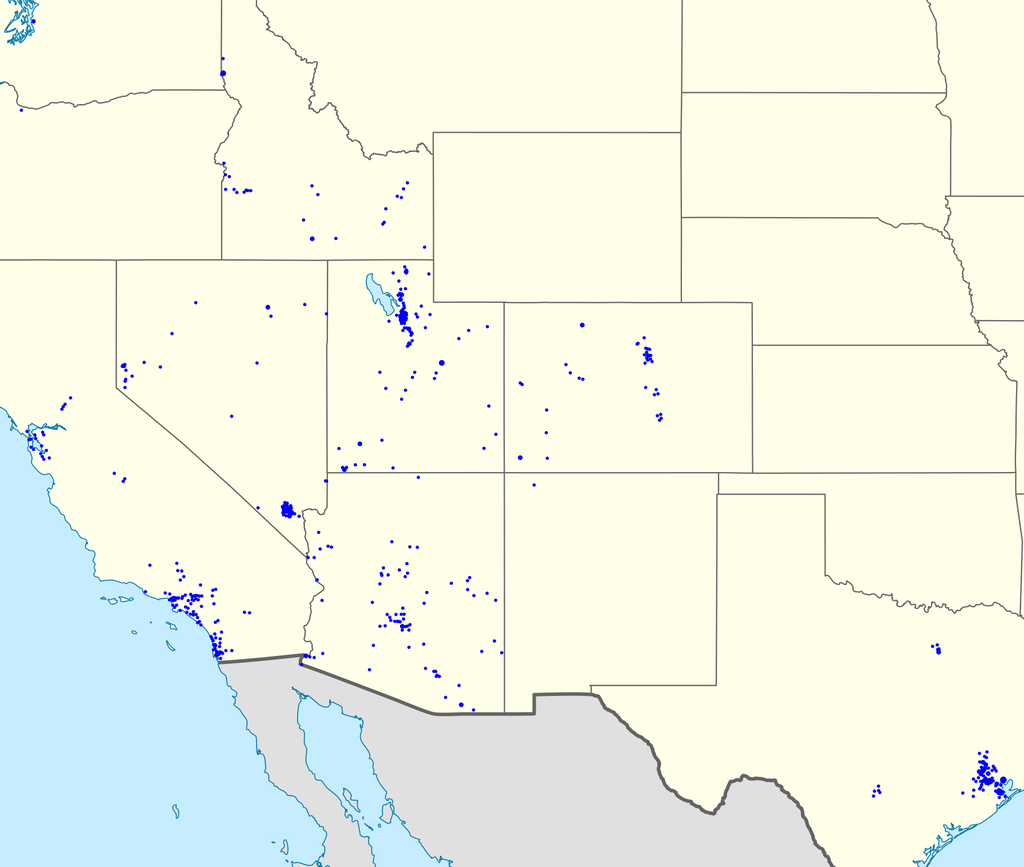
Zions Bancorporation is an American national bank headquartered in Salt Lake City, Utah. It operates as a national bank rather than as a bank holding company and does business under the following seven brands: Zions Bank, Amegy Bank of Texas, California Bank and Trust, National Bank of Arizona, Nevada State Bank, Vectra Bank Colorado, and the Commerce Bank of Washington.
As of 2023, it had 416 branches and over 1 million customers, mostly in the western United States. It was founded by the Church of Jesus Christ of Latter-day Saints (LDS Church) in 1873, although the church divested its interest in the bank in 1960.
History
Zion's Savings Bank & Trust Company was established by the LDS Church in July 1873 to take over the savings department of the Deseret National Bank, the fourth attempt at creating a national bank in Utah, incorporated in 1868. It opened for business on October 1, 1873 and received $5,876 in deposits from 46 depositors. Brigham Young, LDS Church president, was the bank's first president, and the bank was intended to encourage immigration to Utah and further the financial interests of the church.
During the Panic of 1893, the bank managed to remain solvent despite difficulties.
During the early 20th century, Zions financed such firms as:
Bingham Copper Company (later Kennecott Utah Copper)
Salt Lake and Los Angeles Railroad Company (later Union Pacific Railroad)
Big Cottonwood Power Company (later Utah Power and then Rocky Mountain Power)
Salt Lake Gas Company (later Mountain Fuel Supply Company and then Questar Gas)
The Panic of 1907 was the lone interruption in the steady growth of Zions. However, deposits grew from $2 million in 1901 to $9 million in 1918.
Great Depression
On the morning of February 15, 1932 customers began a run on the bank, waiting in lines that ran out of the building and onto the street. Tellers were instructed to honor all withdrawal requests. In 2.5 days, a total of $1.5 million was withdrawn. Near the end of the second day, Heber J. Grant, president of both the bank and the LDS Church, placed a sign in the bank's window that read, in part: "[The bank] is in a very strong, clean, liquid condition. It can pay off every depositor in full. Fear of its failure is not only without foundation, but positively foolish. There is not a safer bank in the State or the Nation."
Lines of depositors that had been as long as a city block began to dwindle, and within five or six days many customers returned to deposit their money. By month's end, total deposits were more than withdrawals, and Zions had survived the Great Depression.
In 1957, Zions merged with Utah Savings and Trust Company, established in 1889, and First National Bank of Salt Lake City, established in 1890. The surviving institution was named Zions First National Bank.
1960–2007
Keystone Insurance and Investment Co. was formed in April 1955 to acquire Lockhart Corporation. In April 1960, Keystone, together with several individual investors, acquired a 57.5% interest in Zions First National Bank from the LDS Church. At that time, the bank had deposits of approximately $120 million. In 1965, the name of the company was changed to Zions Bancorporation. However, it operated as Zions Utah Bancorporation from 1966 to 1987.
It acquired Bank of Kearns in 1962, Bank of Spanish Fork in 1968, Utah National Bank in 1969, Bank of Commerce, Bank of St. George, and Bountiful State Bank in 1970, Bank of Vernal and Carbon Emery Bank in 1973.
In January 1966, Zions became a public company via an initial public offering. There continued to be some minority shareholders until April 1972, when the company exchanged the remaining minority shares for common shares.
The bank expanded into Nevada in 1985 with the purchase of Nevada State Bank. It entered Arizona in 1986 with the acquisition of Mesa Bank, and expanded into Colorado and New Mexico in 1996 by acquiring Aspen Bancshares, which operated Pitkin County Bank and Trust, Valley National Bank of Cortez, and Centennial Savings Bank.
In March 1997, Zions acquired 27 branches in Arizona, Idaho, Nevada, and Utah from Wells Fargo. In July 1997, Zions acquired Tri-State Bank of Idaho. In September 1997, Zions acquired Vectra Banking Corporation and Tri-State Finance Corporation of Colorado for a total of $200 million.
In 1999, the company bid for First Security Corporation but lost to Wells Fargo after the U.S. Securities and Exchange Commission forced Zions to restate its results in prior years due to the way it accounted for acquisitions. Despite the unsuccessful pursuit of First Security, Zions became the largest bank headquartered in Utah.
In 1999, the company proposed a $5.9 billion acquisition of First Security Corporation. The acquisition was delayed due to accounting revisions Zions made at the request of federal regulators. By March 2000, the deal's value fell to $3.8 billion after First Security's stock plummeted following an earnings warning. Zions' shareholders ultimately rejected the merger. In April 2000, Wells Fargo agreed to acquire First Security.
In December 2005, the company expanded into Texas with the acquisition of Amegy Bank.
Since 2008
On October 27, 2008, Zions received a $1.4 billion loan from the U.S. government as a result of the Troubled Asset Relief Program. It repaid the final $700 million on September 26, 2012, and the government realized a profit of $253 million. In 2010, Zions sold NetDeposit to BankServ. Zions Bank paid over $8 million in civil penalties in 2011, related to investigation by the fraud division of the Office of the Comptroller of the Currency which alleged failures to follow regulations about possible money laundering activities. Harris Simmons, then CEO of Zions, said the investigation found no evidence of actual illegal activities and added the failures to follow regulations were not intentional. On June 1, 2015, Zions Bancorporation announced a corporate restructuring, which included the consolidation of seven bank charters into a single charter and $120 million in expense reduction initiatives. In October 2018, Zions merged the holding company and its banking subsidiary ZB, N.A. into Zions Bancorporation, N.A.
Źródło: Wikipedia (Angielski), CC BY-SA 4.0 · Zobacz w Wikipedii ↗
Wyniki 10-letnie Trendy przychodów, zysku netto, marż i EPS
Wycena Wskaźniki P/E, P/S, P/B, EV/EBITDA — czy akcje są drogie, czy tanie?
| Wskaźnik | Trend 5-letni | ZIONP | średnia z 5 lat | Mediana porównawcza | Werdykt |
|---|---|---|---|---|---|
| P/B (MRQ) | 0.3 | · | 1.1 | Niedowartościowany |
Mediana porównawcza jest obliczana na znormalizowanej podstawie dla każdej metryki i może nie zawsze odpowiadać podstawie TTM/MRQ pokazanej dla tej akcji.
Rentowność Marże brutto, operacyjne i netto; ROE, ROA, ROIC
Za mało danych fundamentalnych, aby obliczyć tę grupę wskaźników.
Zdrowie finansowe Dług, płynność, wypłacalność — siła bilansu
Za mało danych fundamentalnych, aby obliczyć tę grupę wskaźników.
Rozwój Wzrost przychodów, EPS i zysku netto: r/r, CAGR 3-letni, CAGR 5-letni
Za mało danych fundamentalnych, aby obliczyć tę grupę wskaźników.
Efektywność kapitałowa Rotacja aktywów, rotacja zapasów, rotacja należności
Za mało danych fundamentalnych, aby obliczyć tę grupę wskaźników.
wartość · ≈ średnia z 5 lat · mediana branżowa · werdykt względem mediany
Dywidendy Stopa dywidendy, wskaźnik wypłaty, historia dywidend, 5-letni CAGR
| Data ex-dywidendy | Kwota | Waluta | Stopa zwrotu |
|---|---|---|---|
| Wrz 1, 2026 | $0,28 | USD | ≈6.7% |
| Cze 1, 2026 | $0,32 | USD | ≈6.5% |
| Lut 27, 2026 | $0,28 | USD | ≈6.4% |
| Gru 1, 2025 | $0,30 | USD | ≈6.3% |
| Sie 29, 2025 | $0,32 | USD | ≈6.0% |
| Maj 30, 2025 | $0,32 | USD | ≈6.0% |
| Lut 28, 2025 | $0,37 | USD | ≈6.3% |
| Lis 29, 2024 | $0,36 | USD | ≈6.6% |
| Sie 30, 2024 | $0,39 | USD | ≈7.0% |
| Maj 31, 2024 | $0,39 | USD | ≈7.1% |
| Lut 29, 2024 | $0,39 | USD | ≈7.3% |
| Lis 30, 2023 | $0,39 | USD | ≈7.3% |
| Sie 31, 2023 | $0,39 | USD | ≈6.5% |
| Maj 31, 2023 | $0,34 | USD | ≈6.5% |
| Lut 28, 2023 | $0,33 | USD | ≈5.2% |
| Lis 30, 2022 | $0,25 | USD | ≈5.6% |
| Sie 31, 2022 | $0,26 | USD | ≈5.1% |
| Maj 31, 2022 | $0,26 | USD | ≈4.9% |
| Lut 28, 2022 | $0,25 | USD | ≈4.3% |
| Lis 30, 2021 | $0,25 | USD | ≈4.1% |
Historia zysków EPS faktyczny vs szacowany, zaskoczenie %, wskaźnik trafień, data następnych wyników
| Okres | Raport | EPS Actual | EPS Szacowany | Niespodzianka |
|---|---|---|---|---|
| 30 czerwca 2026 | $3.05 | $1.85 | 65.3% | |
| 31 marca 2026 | $1.56 | $1.45 | 7.3% | |
| 31 grudnia 2025 | $1.76 | $1.59 | 10.4% | |
| 30 września 2025 | $1.48 | $1.44 | 2.8% | |
| 30 czerwca 2025 | $1.63 | $1.34 | 21.8% | |
| 31 marca 2025 | $1.13 | $1.21 | -6.3% |
Pełne podstawowe wskaźniki Wszystkie wskaźniki roczne — rachunek zysków i strat, bilans, przepływy pieniężne
Nie mamy jeszcze dokumentów SEC dla tego tickera.
Rachunek zysków i strat
| Wskaźnik | Trend | Q2 2026 | Q2 2025 |
|---|---|---|---|
| Revenue | $182M | $164M | |
| Interest Income | $1.02B | $1.05B | |
| Income Tax | $130M | $68M | |
| Net Income | $453M | $244M | |
| EPS (Basic) | $3.05 | $1.63 | |
| EPS (Diluted) | $3.05 | $1.63 | |
| Shares (Basic) | 146,117,000 | 147,044,000 | |
| Shares (Diluted) | 146,210,000 | 147,053,000 |
Bilans
| Wskaźnik | Trend | Q2 2026 | Q2 2025 |
|---|---|---|---|
| Total Assets | $89.04B | · | |
| Total Liabilities | $81.36B | · | |
| Retained Earnings | $7.88B | · | |
| AOCI | $-1.87B | · | |
| Stockholders' Equity | $7.68B | · | |
| Liabilities + Equity | $89.04B | · | |
| Shares Outstanding | 145,939,000 | · |
Przepływy pieniężne
| Wskaźnik | Trend | Q2 2026 | Q2 2025 |
|---|---|---|---|
| D&A | $27M | · | |
| Stock-based Comp | $6M | · | |
| Deferred Tax | $-10M | · | |
| Operating Cash Flow | $422M | · | |
| CapEx | $33M | · | |
| Investing Cash Flow | $-688M | · | |
| Debt Issued | $1M | $0 | |
| Stock Issued | $3M | · | |
| Stock Repurchased | $75M | · | |
| Dividends Paid | $68M | · | |
| Financing Cash Flow | $398M | · | |
| Net Change in Cash | $132M | · | |
| Taxes Paid | $121M | · |
Rentowność
| Wskaźnik | Trend | Q2 2026 | Q2 2025 |
|---|---|---|---|
| Net Margin | 248.9% | · | |
| ROA | 0.51% | · | |
| ROE | 6.3% | · |
Efektywność
| Wskaźnik | Trend | Q2 2026 | Q2 2025 |
|---|---|---|---|
| Asset Turnover | 0.0 | · |
Na akcję
| Wskaźnik | Trend | Q2 2026 | Q2 2025 |
|---|---|---|---|
| Book Value / Share | $52.63 | · | |
| Revenue / Share | $1.24 | · | |
| Dividend Paid / Share | $0.45 | $0.43 | |
| EPS (TTM) | $7.85 | $5.47 |
Wycena (TTM)
| Wskaźnik | Trend | Q2 2026 | Q2 2025 |
|---|---|---|---|
| Revenue TTM | $694M | $655M | |
| Net Income TTM | $1.17B | $844M | |
| Market Cap | $2.70B | · | |
| P/E | 2.4 | 4.1 | |
| P/S | 3.9 | 5.0 | |
| P/B | 0.4 | · | |
| P / Tangible Book | 0.4 | · | |
| Dividend Yield | 10.1% | 8.4% | |
| Earnings Yield | 42.5% | 24.5% | |
| Annual Payout | $272M | $277M |
Najnowszy okres po lewej · wartości null pokazane jako ·
Sprawozdania finansowe Rachunek zysków i strat, bilans, przepływy pieniężne — roczne, ostatnie 5 lat
Zbyt mało danych fundamentalnych, aby utworzyć to sprawozdanie.
Zbyt mało danych fundamentalnych, aby utworzyć to sprawozdanie.
Zbyt mało danych fundamentalnych, aby utworzyć to sprawozdanie.
Insiderzy spółki 8 insiderów · 1 dyrektorzy generalni · 4 dyrektorzy
| Insider | Rola | Ostatnia aktywność | Posiadane akcje | Kupna 12m | Sprzedaże 12m | Netto 12m |
|---|---|---|---|---|---|---|
| Derek Steward | Executive Vice President | 28 lipca 2026 M | 17 449 | 0 | 1 | $-62 267 |
| Claire A Huang | Dyrektor | 30 czerwca 2026 A | · | 0 | 0 | $0 |
| Aaron Skonnard | Dyrektor | 30 czerwca 2026 A | · | 0 | 0 | $0 |
| Vivian S Lee | Dyrektor | 30 czerwca 2026 A | · | 0 | 0 | $0 |
| Stephen D Quinn | Dyrektor | 30 czerwca 2026 A | · | 0 | 0 | $0 |
| Harris H Simmons | · | 11 sierpnia 2026 G | 353 353 | 0 | 0 | $0 |
| Scott A. Law | · | 4 sierpnia 2026 M | 32 890 | 0 | 2 | $-333 731 |
| Scott J Mclean | · | 4 sierpnia 2026 M | 74 934 | 0 | 4 | $-5 887 880 |
Insiderzy z zgłoszeń SEC Form 3/4/5; netto = tylko otwarty rynek P/S
ZIONP Konsensus analityków Bycze i niedźwiedzie opinie analityków, 12-miesięczny cel cenowy, potencjał wzrostu
Porównanie z porównywalnymi firmami (podbranża GICS) Kluczowe metryki w porównaniu do konkurentów z sektora
Podstawa R/R, ceny według zamknięcia z ostatniego końca roku obrotowego każdej spółki.
| Ticker | Kapitalizacja Rynkowa | P/E | Przychody r/r | Marża Netto | ROE | Marża brutto |
|---|---|---|---|---|---|---|
| ZIONP | · | · | · | · | · | · |
| EWBC | $15.46B | 11.8 | 12.2% | 45.2% | 15.5% | · |
| PNFP | $7.41B | 11.8 | 18.3% | 31.2% | 9.5% | · |
| FHN | $11.59B | 12.8 | 7.2% | 28.7% | 11.1% | · |
| WTFC | $9.36B | 12.3 | 5.9% | 310.1% | 11.4% | · |
| ZION | $8.64B | 9.7 | 3.6% | 135.8% | 13.1% | · |
| UMBF | $8.74B | 12.4 | 62.8% | 26.5% | 9.4% | · |
| SSB | $9.33B | 12.0 | 56.1% | 29.8% | 8.9% | · |
| CFR | · | 12.8 | 8.3% | 29.0% | 14.8% | · |
| ONB | $8.69B | 12.5 | · | 26.5% | 8.1% | · |
| WAL | · | 9.6 | 99.7% | 713.6% | 13.5% | · |
Moje wskaźniki Twoja osobista lista obserwowanych — wybrane wiersze z Pełnych Fundamentów
Wybierz wskaźniki, które są dla Ciebie ważne — kliknij + obok dowolnego wiersza w sekcji Pełne dane fundamentalne powyżej.
Twój wybór został zapisany i będzie Ci towarzyszył we wszystkich tickerach.