FRANKLIN RESOURCES INC
Pierwszy wniosek do SEC: 22 kwietnia 2026 · Najnowszy: 5 czerwca 2026
Biografia
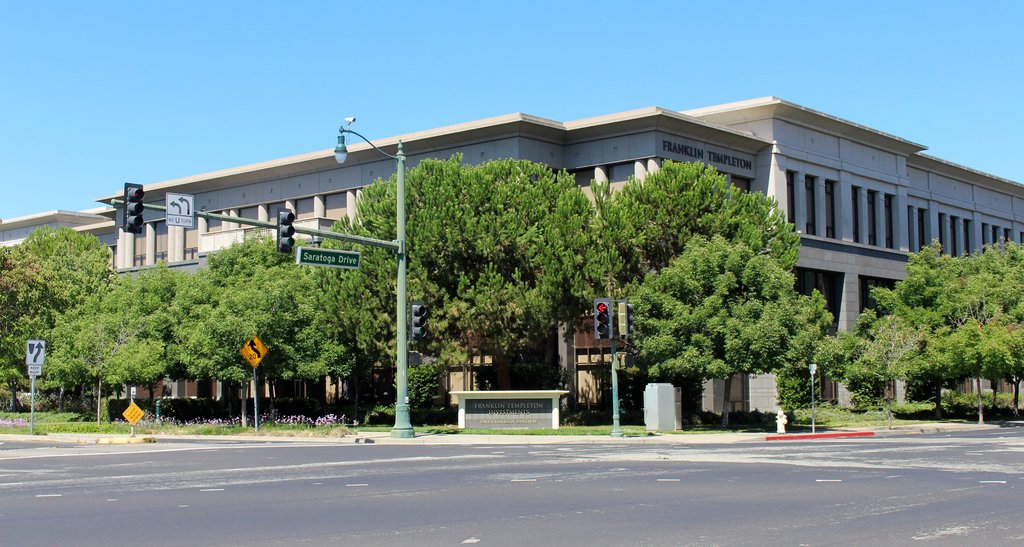
Franklin Templeton, Inc. is an American multinational investment management holding company that, together with its subsidiaries, is referred to as Franklin Templeton. It is a global investment firm with operations in over 150 countries. They were founded in New York City in 1947 as Franklin Distributors, Inc. In 1992 they merged with Templeton, Galbraith & Hansberger which had started in 1954 under John Templeton.
Czytaj więcej
Franklin Templeton, Inc. is an American multinational investment management holding company that, together with its subsidiaries, is referred to as Franklin Templeton. It is a global investment firm with operations in over 150 countries. They were founded in New York City in 1947 as Franklin Distributors, Inc. In 1992 they merged with Templeton, Galbraith & Hansberger which had started in 1954 under John Templeton.
The company’s stock is listed on the New York Stock Exchange under the ticker symbol BEN, in honor of Benjamin Franklin, for whom the company is named, and who was admired by founder Rupert Johnson Sr.
In 1973, the company's headquarters moved from New York to San Mateo, California.
History
The company was founded in 1947 in New York by Rupert H. (Harris) Johnson Sr. (1900–1989), who ran a successful retail brokerage firm from an office on Wall Street. He named the company for American polymath Benjamin Franklin because Franklin espoused frugality and prudence when it came to saving and investing. The company's first line of mutual funds, Franklin Custodian Funds, was a series of conservatively managed equity and bond funds designed to appeal to most investors.
After Rupert Sr. retired, his son, Charles B. Johnson (Charlie), took over as president and chief executive officer in 1957 at age 24. At that time, the funds had total assets under management of US$2.5 million. Rupert Johnson Jr., Charlie's brother, joined the company in 1965.
Franklin went public in 1971. In 1973, the company acquired Winfield & Company, a San Mateo, California-based investment firm, and moved Franklin's offices from New York to California. The combined organization had close to US$250 million in assets under management and approximately 60 employees. In 1979, Franklin Money Fund began a growth surge that made it Franklin's first billion-dollar fund and launched the company's significant asset growth in the 1980s.
Starting in 1980, the company's total assets under management doubled (or nearly doubled) every year for the next six years. The company's stock began trading on the New York Stock Exchange in 1986. In the same year, the company opened its first office outside North America in Taiwan. In 1988, Franklin acquired L.F. Rothschild Fund Management Company. Assets under management for Franklin grew from just over US$2 billion in 1982 to more than US$40 billion in 1989 (the crash of 1987 had little impact on Franklin's income and bond funds).
In October 1992, Franklin acquired Templeton, Galbraith & Hansberger Ltd. for a reported cost of $913 million, leading to the common name Franklin Templeton. Mutual fund pioneer Sir John Templeton was the owner of Templeton, Galbraith & Hansberger Ltd together with his son Dr. John Templeton and John Galbraith who together owned 70% of the firm.
In November 1996, Heine Securities Corporation, known for the Mutual Series of funds, merged into the Franklin Templeton complex. In October 2000, Franklin acquired Bissett Funds to increase its Canadian presence, and Bissett remains a key brand from Franklin in the Canadian market. The Fiduciary Trust Company was acquired by Franklin Templeton in April 2001.
Fiduciary Trust Company International, a member of the Franklin family, maintained an office of over 650 employees in 2 World Trade Center at the time of the September 11 attacks in 2001. 87 employees died in the collapse.
The firm has specialized expertise across a full range of asset classes. It offers products under the Franklin, Templeton, Mutual Series and Fiduciary brand names, among others. Like other large investment companies, the firm offers a wide variety of funds but is traditionally best known for bond funds under the Franklin brand, international funds under the Templeton brand, and value funds under the Mutual Series brand.
In April 2007, Franklin Resources was 445th in the Fortune 500, and 7th overall among securities companies. The same month, USA Today listed BEN stock as the top stock pick for the last 25 years based on returns, claiming it is up 64,224% since 1982. As of July 31, 2008, Franklin Resources, Inc. managed over $570 billion in total assets worldwide. In February 2009, Barron's Magazine called Franklin Templeton "King of the Decade" among fund families over the ten-year period ending in 2008.
In 2013, Charles Johnson retired as chairman and his son Greg Johnson became chairman of the board, CEO and president.
In 2019, the firm acquired Benefit Street Partners, an alternative credit investment group.
In 2020, Jenny Johnson became CEO and President of the firm and Greg Johnson became Executive chairman.
Franklin Templeton acquired AdvisorEngine in May 2020, completing the deal in September 2022. Founded 2014 by Rich Cancro, the wealth management technology platform provides advisors with CRM, portfolio management, client portal, and digital onboarding tools, enhancing Franklin Templeton's digital wealth management offerings.
In July 2020, Franklin Templeton acquired Legg Mason, Inc., making Franklin Templeton one of the world's largest independent, specialized global investment managers, with a combined $1.4 trillion in assets under management (AUM). The combined footprint deepened Templeton's presence in key geographies and created an expansive investment platform that includes institutional and retail client AUM.
In November 2021, Franklin Templeton announced its acquisition of Lexington Partners in a $1.75 billion cash deal. The acquisition completed in April 2022.
In January 2022, Franklin Templeton acquired O'Shaughnessy Asset Management, an asset management firm founded by James O'Shaughnessy.
On May 31, 2022, it was announced that BNY Mellon Investment Management would sell Alcentra to Franklin Templeton. The transaction was completed on November 1, 2022.
On May 31, 2023, Great-West Lifeco announced that Franklin Templeton would acquire Putnam Investments for $925 million. Putnam Investments subsidiary, PanAgora Asset Management would not be included in the acquisition. The deal was completed in January 2024.
In August 2023, Bloomberg News reported that Franklin Templeton executives in China were mandated to attend courses on Xi Jinping Thought.
Mutual funds and ETFs
Franklin Templeton has 455 open-ended mutual funds and seven closed-end funds. Included in these are 27 state and federal tax-free income funds, an area of investment pioneered by Franklin.
Prominent funds include the Templeton Growth Fund, Inc. (opened 1954), the Mutual Shares fund (opened 1949), and the Mutual Discovery Fund (opened 1992) and the Templeton Growth (Euro) Fund.
The Franklin Income Fund (FKINX) is a mutual fund in Morningstar's "conservative allocation" category and "large/value" style box. The fund was created in 1948 and has paid uninterrupted dividends for 60 years. The Franklin Income Fund is constructed primarily of dividend-paying stocks and bonds (2%).
Franklin Templeton launched its first exchange-traded funds (ETFs) in 2013. By 2021, these included 55 active, smart beta/multifactor and passively managed ETFs in the U.S, with US$9.7 billion in assets under management.
In 2021, Franklin Templeton launched the first "tokenised" US mutual fund as a pilot – it uses a blockchain to process transactions and record share ownership. The technology is provided by the Stellar network and Blockchain Administrator, a Delaware company. The OnChain US Government Money Fund pilot started with $1.4M of seed money and investment from employees. The automated administration can trade around the clock and removes the need for brokerages, which should result in a "highly significant decrease in fees". However, the fund actually has a high level of costs because of its small size and the fact that, as a pilot, it is maintaining traditional records in parallel.
In February 2025, Franklin Templeton launched a spot crypto exchange-traded fund that holds a combination of roughly 80% bitcoin and 20% ether. That same month Franklin applied with the SEC for a spot Solana ETF.
Effective August 17, 2026, Franklin Resources, Inc. changed its corporate name to Franklin Templeton, Inc. to bring it into alignment with its Franklin Templeton brand.
Źródło: Wikipedia (Angielski), CC BY-SA 4.0 · Zobacz w Wikipedii ↗
Instytucja
Insider w
Transakcje insiderów
Zmiana ceny w stosunku do bieżącej wyceny, skorygowana o podział akcji z powodu działań korporacyjnych od czasu złożenia wniosku — nieporównana, nieannualizowana, nie ważona wielkością
| Data | Ticker | Kod | Akcje | Cena | Wartość | Posiadane po | Δ własne | A/D | vs teraz |
|---|---|---|---|---|---|---|---|---|---|
| 20 lipca 2026 | BEN | S | 1 682 905 | $11,29 | $18 999 997 | 5 103 658 Bezpośrednie | -24,80% | Zbyto | 191,1% (cena według stanu na 2026-10-06) |
| 20 kwietnia 2026 | 1762562 | S | 1 672 535 | $11,36 | $18 999 998 | 6 786 563 Bezpośrednie | -19,77% | Zbyto | |
| 16 kwietnia 2026 | 1762562 | J | 88 106 | $11,35 | $1 000 003 | 8 459 098 Bezpośrednie | +1,05% | Nabyte | |
| 16 kwietnia 2026 | 1762562 | J | 88 028 | $11,36 | $999 998 | 8 370 992 Bezpośrednie | -1,04% | Zbyto | |
| 29 stycznia 2026 | 2063946 | P | 75 000 | $10,00 | $750 000 | 75 000 Bezpośrednie | · | Nabyte | |
| 14 stycznia 2026 | 1762562 | S | 1 581 722 | $11,38 | $17 999 996 | 8 459 020 Bezpośrednie | -15,75% | Zbyto | |
| 4 grudnia 2025 | 1762562 | S | 1 755 926 | $11,39 | $19 999 997 | 10 040 743 Bezpośrednie | -14,88% | Zbyto | |
| 15 października 2025 | 1762562 | S | 1 614 311 | $11,46 | $18 500 004 | 11 796 669 Bezpośrednie | -12,04% | Zbyto | |
| 15 lipca 2025 | 1762562 | S | 1 519 097 | $11,52 | $17 499 997 | 13 410 980 Bezpośrednie | -10,17% | Zbyto | |
| 17 kwietnia 2025 | 1762562 | S | 863 558 | $11,58 | $10 000 002 | 14 930 077 Bezpośrednie | -5,47% | Zbyto | |
| 8 stycznia 2025 | EMO | S | 9 704 | $47,06 | $456 670 | 0 Bezpośrednie | -100,00% | Zbyto | 7,0% (cena według stanu na 2026-10-06) |
| 3 stycznia 2025 | EMO | S | 8 772 | $47,00 | $412 284 | 8 204 Bezpośrednie | -51,67% | Zbyto | 7,2% (cena według stanu na 2026-10-06) |
| 27 grudnia 2024 | EMO | S | 1 124 | $46,03 | $51 738 | 16 976 Bezpośrednie | -6,21% | Zbyto | 9,4% (cena według stanu na 2026-10-06) |
| 24 grudnia 2024 | EMO | S | 8 153 | $46,01 | $375 120 | 18 100 Bezpośrednie | -31,06% | Zbyto | 9,5% (cena według stanu na 2026-10-06) |
| 20 grudnia 2024 | EMO | S | 1 747 | $45,09 | $78 772 | 26 253 Bezpośrednie | -6,24% | Zbyto | 11,7% (cena według stanu na 2026-10-06) |
| 16 grudnia 2024 | EMO | S | 2 209 | $46,04 | $101 702 | 28 000 Bezpośrednie | -7,31% | Zbyto | 9,4% (cena według stanu na 2026-10-06) |
| 11 grudnia 2024 | EMO | S | 1 200 | $47,45 | $56 940 | 31 709 Bezpośrednie | -3,65% | Zbyto | 6,1% (cena według stanu na 2026-10-06) |
| 11 grudnia 2024 | EMO | S | 2 700 | $47,45 | $128 115 | 30 209 Bezpośrednie | -8,20% | Zbyto | 6,1% (cena według stanu na 2026-10-06) |
| 10 grudnia 2024 | EMO | S | 2 610 | $47,43 | $123 792 | 32 909 Bezpośrednie | -7,35% | Zbyto | 6,2% (cena według stanu na 2026-10-06) |
| 9 grudnia 2024 | EMO | S | 1 000 | $48,05 | $48 050 | 35 519 Bezpośrednie | -2,74% | Zbyto | 4,8% (cena według stanu na 2026-10-06) |
| 18 października 2024 | EMO | S | 7 900 | $43,71 | $345 309 | 36 519 Bezpośrednie | -17,79% | Zbyto | 15,2% (cena według stanu na 2026-10-06) |
| 17 października 2024 | EMO | S | 6 600 | $43,69 | $288 354 | 44 419 Bezpośrednie | -12,94% | Zbyto | 15,3% (cena według stanu na 2026-10-06) |
| 16 października 2024 | EMO | S | 8 467 | $43,69 | $369 923 | 51 019 Bezpośrednie | -14,23% | Zbyto | 15,3% (cena według stanu na 2026-10-06) |
| 15 października 2024 | EMO | S | 6 376 | $43,42 | $276 846 | 59 486 Bezpośrednie | -9,68% | Zbyto | 16,0% (cena według stanu na 2026-10-06) |
| 14 października 2024 | EMO | S | 7 657 | $43,90 | $336 142 | 65 862 Bezpośrednie | -10,41% | Zbyto | 14,7% (cena według stanu na 2026-10-06) |
| 9 listopada 2023 | SABA | U | 6 549 764 | $4,19 | $27 443 511 | 3 440 823 Bezpośrednie | -65,56% | Zbyto | -6,0% (cena według stanu na 2026-10-06) |
| 9 listopada 2023 | SABA | U | 102 881 | $4,19 | $431 071 | 54 047 Pośrednie | -65,56% | Zbyto | -6,0% (cena według stanu na 2026-10-06) |
| 8 listopada 2022 | SABA | P | 10 134 | $4,21 | $42 664 | 9 990 587 Bezpośrednie | +0,10% | Nabyte | -6,5% (cena według stanu na 2026-10-06) |
| 7 listopada 2022 | SABA | P | 44 574 | $4,24 | $188 994 | 9 980 453 Bezpośrednie | +0,45% | Nabyte | -7,1% (cena według stanu na 2026-10-06) |
| 4 listopada 2022 | SABA | P | 40 694 | $4,17 | $169 694 | 9 935 879 Bezpośrednie | +0,41% | Nabyte | -5,6% (cena według stanu na 2026-10-06) |
| 3 listopada 2022 | SABA | P | 50 786 | $4,15 | $210 762 | 9 895 185 Bezpośrednie | +0,52% | Nabyte | -5,1% (cena według stanu na 2026-10-06) |
| 2 listopada 2022 | SABA | P | 55 596 | $4,15 | $230 723 | 9 844 399 Bezpośrednie | +0,57% | Nabyte | -5,1% (cena według stanu na 2026-10-06) |
| 1 listopada 2022 | SABA | P | 65 500 | $4,28 | $280 340 | 9 788 803 Bezpośrednie | +0,67% | Nabyte | -8,0% (cena według stanu na 2026-10-06) |
| 31 października 2022 | SABA | P | 65 118 | $4,29 | $279 356 | 9 723 303 Bezpośrednie | +0,67% | Nabyte | -8,2% (cena według stanu na 2026-10-06) |
| 28 października 2022 | SABA | P | 64 406 | $4,25 | $273 726 | 9 658 185 Bezpośrednie | +0,67% | Nabyte | -7,4% (cena według stanu na 2026-10-06) |
| 27 października 2022 | SABA | P | 55 502 | $4,20 | $233 108 | 9 593 779 Bezpośrednie | +0,58% | Nabyte | -6,3% (cena według stanu na 2026-10-06) |
| 26 października 2022 | SABA | P | 71 000 | $4,26 | $302 460 | 9 538 277 Bezpośrednie | +0,75% | Nabyte | -7,6% (cena według stanu na 2026-10-06) |
| 25 października 2022 | SABA | P | 70 500 | $4,18 | $294 690 | 9 467 277 Bezpośrednie | +0,75% | Nabyte | -5,8% (cena według stanu na 2026-10-06) |
| 24 października 2022 | SABA | P | 53 800 | $4,07 | $218 966 | 9 396 777 Bezpośrednie | +0,58% | Nabyte | -3,3% (cena według stanu na 2026-10-06) |
| 21 października 2022 | SABA | P | 37 672 | $4,07 | $153 325 | 9 342 977 Bezpośrednie | +0,40% | Nabyte | -3,3% (cena według stanu na 2026-10-06) |
| 20 października 2022 | SABA | P | 66 413 | $4,08 | $270 965 | 9 305 305 Bezpośrednie | +0,72% | Nabyte | -3,5% (cena według stanu na 2026-10-06) |
| 19 października 2022 | SABA | P | 61 729 | $4,06 | $250 620 | 9 238 892 Bezpośrednie | +0,67% | Nabyte | -3,0% (cena według stanu na 2026-10-06) |
| 18 października 2022 | SABA | P | 60 150 | $4,08 | $245 412 | 9 177 163 Bezpośrednie | +0,66% | Nabyte | -3,5% (cena według stanu na 2026-10-06) |
| 17 października 2022 | SABA | P | 51 277 | $4,16 | $213 312 | 9 117 013 Bezpośrednie | +0,57% | Nabyte | -5,3% (cena według stanu na 2026-10-06) |
| 14 października 2022 | SABA | P | 59 500 | $4,09 | $243 355 | 9 065 736 Bezpośrednie | +0,66% | Nabyte | -3,7% (cena według stanu na 2026-10-06) |
| 13 października 2022 | SABA | P | 59 700 | $4,16 | $248 352 | 9 006 236 Bezpośrednie | +0,67% | Nabyte | -5,3% (cena według stanu na 2026-10-06) |
| 12 października 2022 | SABA | P | 46 244 | $4,19 | $193 762 | 8 946 536 Bezpośrednie | +0,52% | Nabyte | -6,0% (cena według stanu na 2026-10-06) |
| 11 października 2022 | SABA | P | 56 167 | $4,26 | $239 271 | 8 900 292 Bezpośrednie | +0,64% | Nabyte | -7,6% (cena według stanu na 2026-10-06) |
| 10 października 2022 | SABA | P | 36 136 | $4,29 | $155 023 | 8 844 125 Bezpośrednie | +0,41% | Nabyte | -8,2% (cena według stanu na 2026-10-06) |
| 7 października 2022 | SABA | P | 17 402 | $4,27 | $74 307 | 8 807 989 Bezpośrednie | +0,20% | Nabyte | -7,8% (cena według stanu na 2026-10-06) |
| 5 października 2022 | 1762562 | P | 1 963 865 | $12,73 | $25 000 001 | 7 867 833 Pośrednie | +33,26% | Nabyte | |
| 5 października 2022 | SABA | P | 2 967 386 | $4,27 | $12 670 738 | 8 790 587 Bezpośrednie | +50,96% | Nabyte | -7,8% (cena według stanu na 2026-10-06) |
| 21 września 2022 | SABA | P | 49 621 | $4,50 | $223 294 | 5 823 201 Bezpośrednie | +0,86% | Nabyte | -12,5% (cena według stanu na 2026-10-06) |
| 20 września 2022 | SABA | P | 50 921 | $4,49 | $228 635 | 5 773 580 Bezpośrednie | +0,89% | Nabyte | -12,3% (cena według stanu na 2026-10-06) |
| 19 września 2022 | SABA | P | 66 591 | $4,51 | $300 325 | 5 722 659 Bezpośrednie | +1,18% | Nabyte | -12,7% (cena według stanu na 2026-10-06) |
| 16 września 2022 | SABA | P | 49 769 | $4,47 | $222 467 | 5 656 068 Bezpośrednie | +0,89% | Nabyte | -11,9% (cena według stanu na 2026-10-06) |
| 15 września 2022 | SABA | P | 72 568 | $4,54 | $329 459 | 5 606 299 Bezpośrednie | +1,31% | Nabyte | -13,3% (cena według stanu na 2026-10-06) |
| 14 września 2022 | SABA | P | 38 437 | $4,55 | $174 888 | 5 533 731 Bezpośrednie | +0,70% | Nabyte | -13,5% (cena według stanu na 2026-10-06) |
| 14 września 2022 | 1547341 | P | 100 | $30,50 | $3 050 | 73 014 Bezpośrednie | +0,14% | Nabyte | |
| 13 września 2022 | 1547341 | P | 4 917 | $30,74 | $151 149 | 72 914 Bezpośrednie | +7,23% | Nabyte | |
| 13 września 2022 | SABA | P | 53 895 | $4,58 | $246 839 | 5 495 294 Bezpośrednie | +0,99% | Nabyte | -14,0% (cena według stanu na 2026-10-06) |
| 12 września 2022 | 1547341 | P | 4 500 | $31,35 | $141 075 | 67 997 Bezpośrednie | +7,09% | Nabyte | |
| 12 września 2022 | SABA | P | 70 903 | $4,61 | $326 863 | 5 441 399 Bezpośrednie | +1,32% | Nabyte | -14,6% (cena według stanu na 2026-10-06) |
| 9 września 2022 | 1547341 | P | 4 194 | $30,74 | $128 924 | 63 497 Bezpośrednie | +7,07% | Nabyte | |
| 9 września 2022 | SABA | P | 26 347 | $4,56 | $120 142 | 5 370 496 Bezpośrednie | +0,49% | Nabyte | -13,7% (cena według stanu na 2026-10-06) |
| 8 września 2022 | 1547341 | P | 4 400 | $29,97 | $131 868 | 59 303 Bezpośrednie | +8,01% | Nabyte | |
| 8 września 2022 | SABA | P | 58 211 | $4,55 | $264 860 | 5 344 149 Bezpośrednie | +1,10% | Nabyte | -13,5% (cena według stanu na 2026-10-06) |
| 7 września 2022 | 1762562 | P | 1 965 409 | $12,72 | $25 000 002 | 5 903 968 Pośrednie | +49,90% | Nabyte | |
| 7 września 2022 | 1547341 | P | 4 500 | $29,82 | $134 190 | 54 903 Bezpośrednie | +8,93% | Nabyte | |
| 7 września 2022 | SABA | P | 71 230 | $4,56 | $324 809 | 5 285 938 Bezpośrednie | +1,37% | Nabyte | -13,7% (cena według stanu na 2026-10-06) |
| 6 września 2022 | 1547341 | P | 4 645 | $30,05 | $139 582 | 50 403 Bezpośrednie | +10,15% | Nabyte | |
| 6 września 2022 | SABA | P | 67 752 | $4,59 | $310 982 | 5 214 708 Bezpośrednie | +1,32% | Nabyte | -14,2% (cena według stanu na 2026-10-06) |
| 2 września 2022 | 1547341 | P | 4 600 | $30,31 | $139 426 | 45 758 Bezpośrednie | +11,18% | Nabyte | |
| 2 września 2022 | SABA | P | 58 900 | $4,64 | $273 296 | 5 146 956 Bezpośrednie | +1,16% | Nabyte | -15,1% (cena według stanu na 2026-10-06) |
| 1 września 2022 | 1547341 | P | 4 300 | $29,51 | $126 893 | 41 158 Bezpośrednie | +11,67% | Nabyte | |
| 1 września 2022 | SABA | P | 76 800 | $4,64 | $356 352 | 5 088 056 Bezpośrednie | +1,53% | Nabyte | -15,1% (cena według stanu na 2026-10-06) |
| 31 sierpnia 2022 | 1547341 | P | 4 496 | $30,37 | $136 544 | 36 858 Bezpośrednie | +13,89% | Nabyte | |
| 31 sierpnia 2022 | SABA | P | 75 286 | $4,65 | $350 080 | 5 011 256 Bezpośrednie | +1,53% | Nabyte | -15,3% (cena według stanu na 2026-10-06) |
| 30 sierpnia 2022 | 1547341 | P | 4 000 | $30,79 | $123 160 | 32 362 Bezpośrednie | +14,10% | Nabyte | |
| 30 sierpnia 2022 | SABA | P | 75 695 | $4,65 | $351 982 | 4 935 970 Bezpośrednie | +1,56% | Nabyte | -15,3% (cena według stanu na 2026-10-06) |
| 29 sierpnia 2022 | SABA | P | 74 435 | $4,67 | $347 611 | 4 860 275 Bezpośrednie | +1,56% | Nabyte | -15,7% (cena według stanu na 2026-10-06) |
| 29 sierpnia 2022 | 1547341 | P | 4 378 | $31,74 | $138 958 | 28 362 Bezpośrednie | +18,25% | Nabyte | |
| 26 sierpnia 2022 | SABA | P | 63 577 | $4,70 | $298 812 | 4 785 840 Bezpośrednie | +1,35% | Nabyte | -16,2% (cena według stanu na 2026-10-06) |
| 26 sierpnia 2022 | 1547341 | P | 4 419 | $31,56 | $139 464 | 23 984 Bezpośrednie | +22,59% | Nabyte | |
| 25 sierpnia 2022 | 1547341 | P | 4 219 | $31,95 | $134 797 | 19 565 Bezpośrednie | +27,49% | Nabyte | |
| 25 sierpnia 2022 | SABA | P | 82 067 | $4,71 | $386 536 | 4 722 263 Bezpośrednie | +1,77% | Nabyte | -16,4% (cena według stanu na 2026-10-06) |
| 24 sierpnia 2022 | 1547341 | P | 2 187 | $31,62 | $69 153 | 15 346 Bezpośrednie | +16,62% | Nabyte | |
| 24 sierpnia 2022 | SABA | P | 74 710 | $4,70 | $351 137 | 4 640 196 Bezpośrednie | +1,64% | Nabyte | -16,2% (cena według stanu na 2026-10-06) |
| 23 sierpnia 2022 | 1547341 | P | 4 200 | $31,18 | $130 956 | 13 159 Bezpośrednie | +46,88% | Nabyte | |
| 23 sierpnia 2022 | SABA | P | 74 898 | $4,62 | $346 029 | 4 565 486 Bezpośrednie | +1,67% | Nabyte | -14,8% (cena według stanu na 2026-10-06) |
| 22 sierpnia 2022 | 1547341 | P | 4 328 | $30,70 | $132 870 | 8 959 Bezpośrednie | +93,46% | Nabyte | |
| 22 sierpnia 2022 | SABA | P | 71 931 | $4,60 | $330 883 | 4 490 588 Bezpośrednie | +1,63% | Nabyte | -14,4% (cena według stanu na 2026-10-06) |
| 19 sierpnia 2022 | SABA | P | 82 931 | $4,64 | $384 800 | 4 418 657 Bezpośrednie | +1,91% | Nabyte | -15,1% (cena według stanu na 2026-10-06) |
| 18 sierpnia 2022 | SABA | P | 83 345 | $4,72 | $393 388 | 4 335 726 Bezpośrednie | +1,96% | Nabyte | -16,6% (cena według stanu na 2026-10-06) |
| 17 sierpnia 2022 | SABA | P | 82 516 | $4,76 | $392 776 | 4 252 381 Bezpośrednie | +1,98% | Nabyte | -17,3% (cena według stanu na 2026-10-06) |
| 16 sierpnia 2022 | SABA | P | 49 355 | $4,79 | $236 410 | 4 169 865 Bezpośrednie | +1,20% | Nabyte | -17,8% (cena według stanu na 2026-10-06) |
| 15 sierpnia 2022 | SABA | P | 60 084 | $4,80 | $288 403 | 4 120 510 Bezpośrednie | +1,48% | Nabyte | -18,0% (cena według stanu na 2026-10-06) |
| 12 sierpnia 2022 | SABA | P | 23 986 | $4,81 | $115 373 | 4 060 426 Bezpośrednie | +0,59% | Nabyte | -18,1% (cena według stanu na 2026-10-06) |
| 11 sierpnia 2022 | SABA | P | 128 398 | $4,84 | $621 446 | 4 036 440 Bezpośrednie | +3,29% | Nabyte | -18,6% (cena według stanu na 2026-10-06) |
| 10 sierpnia 2022 | SABA | P | 89 536 | $4,81 | $430 668 | 3 908 042 Bezpośrednie | +2,34% | Nabyte | -18,1% (cena według stanu na 2026-10-06) |
Wyświetlanie ostatnich 100 z 626 transakcji
P = Zakup na wolnym rynku · S = Sprzedaż · A = Przyznanie/nagroda · M = Wykonanie opcji · G = Prezent · F = Potrącenie podatku
Transakcje insiderów nie stanowią rekomendacji; sprzedaż jest często motywowana względami płynności lub podatkowymi.
Papiery wartościowe pochodne (Formularz 4, Tabela II) Opcje, RSU i papiery wartościowe zamienne zgłoszone w Formularzu 4, Tabela II.
| Data | Ticker | Papier wartościowy | Podstawa | Cena wykonania | Wygaśnięcie | Akcje | A/D |
|---|---|---|---|---|---|---|---|
| 9 grudnia 2021 | 943861 | Convertible Notes | Common Stock | $21,33 | 31 maja 2023 | 26 955 | Nabyte |
| 9 grudnia 2021 | 943861 | Convertible Notes | Common Stock | $21,33 | 31 maja 2023 | 1 347 918 | Zbyto |
| 15 października 2021 | 943861 | Convertible Notes | Common Stock | $21,33 | 31 maja 2023 | 43 127 | Nabyte |
| 15 lipca 2021 | 943861 | Convertible Notes | Common Stock | $21,33 | 31 maja 2023 | 41 719 | Nabyte |
| 15 kwietnia 2021 | 943861 | Convertible Notes | Common Stock | $21,33 | 31 maja 2023 | 16 465 | Nabyte |
| 9 marca 2021 | 943861 | Convertible Notes | Common Stock | $21,33 | 31 maja 2023 | 1 219 652 | Nabyte |
| 9 marca 2021 | 943861 | Convertible Notes | Common Stock | $21,33 | 31 maja 2022 | 698 046 | Zbyto |
| 15 stycznia 2021 | 943861 | Convertible Notes | Common Stock | $21,33 | 31 maja 2022 | 22 790 | Nabyte |
| 15 października 2020 | 943861 | Convertible Notes | Common Stock | $21,33 | 31 maja 2022 | 22 046 | Nabyte |
| 15 lipca 2020 | 943861 | Convertible Notes | Common Stock | $21,33 | 31 maja 2021 | 21 326 | Nabyte |
| 15 lipca 2020 | 943861 | Convertible Notes | Common Stock | $21,33 | 31 maja 2021 | 21 326 | Nabyte |
| 15 kwietnia 2020 | 943861 | Convertible Notes | Common Stock | $21,33 | 31 maja 2021 | 20 630 | Nabyte |
| 15 stycznia 2020 | 943861 | Convertible Notes | Common Stock | $21,33 | 31 maja 2021 | 19 956 | Nabyte |
| 15 października 2019 | 943861 | Convertible Notes | Common Stock | $21,33 | 31 maja 2021 | 19 305 | Nabyte |
| 15 lipca 2019 | 943861 | Convertible Notes | Common Stock | $21,33 | 31 maja 2021 | 9 492 | Nabyte |
| 31 maja 2019 | 943861 | Convertible Notes | Common Stock | $21,33 | 31 maja 2021 | 562 501 | Nabyte |
| 29 maja 2019 | 943861 | Convertible Notes | Common Stock | $21,33 | 30 sierpnia 2019 | 410 156 | Zbyto |
| 7 lutego 2018 | 943861 | Warrants | Common Stock | $0,01 | 12 października 2026 | 546 875 | Zbyto |
| 28 września 2017 | 1282648 | Warrants | Common Stock | $14,04 | 9 września 2020 | 11 650 | Zbyto |
| 10 maja 2017 | 1282648 | Warrants | Common Stock | $14,04 | 9 września 2020 | 1 165 | Zbyto |
| 7 kwietnia 2017 | 1282648 | Warrants | Common Stock | $14,04 | 9 września 2020 | 10 485 | Zbyto |
| 9 marca 2017 | 1282648 | Warrants | Common Stock | $14,04 | 9 września 2020 | 583 | Zbyto |
| 22 listopada 2016 | 1504167 | Class A Warrants | Common Stock | $0,35 | · | 4 375 000 | Nabyte |
| 29 marca 2016 | 1504167 | Warrants | Common Stock | $1,20 | 29 marca 2021 | 270 000 | Nabyte |
| 12 kwietnia 2013 | 1379895 | Warrants | Common Stock | $40,00 | 2 października 2017 | 10 161 | Zbyto |
Cena wykonania/konwersji jest pusta, gdy nie dotyczy (np. RSU).
Początkowe posiadanie (Formularz 3) 17 akcji
Papiery wartościowe posiadane w momencie pierwszego uzyskania statusu insidera, zgodnie z Formularzem 3 SEC.
| Data | Ticker | Papier wartościowy | Akcje | Posiadanie |
|---|---|---|---|---|
| 19 sierpnia 2024 | 2008602 | Common Shares | · | Pośrednie |
| 22 sierpnia 2022 | 1547341 | Common Stock | · | Pośrednie |
| 1 lipca 2022 | SABA | Shares of beneficial interest | · | Pośrednie |
| 5 sierpnia 2021 | 1762562 | Common Stock | · | Pośrednie |
| 2 lipca 2021 | WDI | Common Stock | 5 000 | Bezpośrednie |
| 14 listopada 2016 | 1282648 | Common Stock | · | Pośrednie |
| 14 listopada 2016 | 1282648 | Warrants | · | Pośrednie |
| 24 października 2016 | 943861 | Common Stock | 4 469 465 | Pośrednie |
| 24 października 2016 | 943861 | Convertible Notes | 410 156 | Pośrednie |
| 24 października 2016 | 943861 | Warrants | 546 875 | Pośrednie |
| 29 września 2016 | 1282648 | Common Stock | 33 822 339 | Pośrednie |
| 29 września 2016 | 1282648 | Warrants | 439 097 | Pośrednie |
| 21 grudnia 2015 | 1504167 | Common Stock | 4 100 000 | Pośrednie |
| 10 października 2012 | 1379895 | Common Stock | 31 387 446 | Pośrednie |
| 10 października 2012 | 1379895 | Warrants | 1 544 050 | Pośrednie |
| 8 lutego 2010 | 30419 | Common Stock | 15 264 757 | Pośrednie |
| 17 stycznia 2008 | 906338 | Ordinary Shares | 3 694 822 | Pośrednie |