
ONBPO Old National Bancorp - Depositary Shares, Each Representing a 1/40th Interest in a Share of Series C Preferred Stock
เกี่ยวกับ Old National Bancorp - Depositary Shares, Each Representing a 1/40th Interest in a Share of Series C Preferred Stock ภาพรวมบริษัทจาก Wikipedia
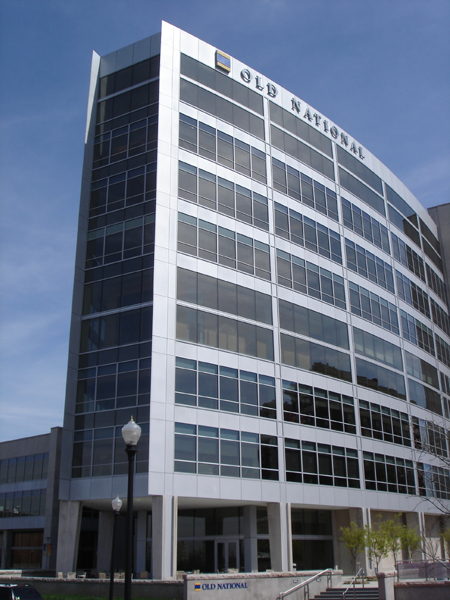
Old National Bank is an American regional bank with nearly 200 retail branches operated by Old National Bancorp and based in Chicago and Evansville, Indiana. With assets at $48.5 billion and 250 banking centers, Old National Bancorp is the largest financial services bank holding company headquartered in Indiana and one of the top 30 banking companies in the U.S. Old National Bank has locations in Illinois, Indiana, Iowa, Kentucky, Michigan, Minnesota, North Dakota, Tennessee, and Wisconsin.
อ่านเพิ่มเติม
Old National Bank is an American regional bank with nearly 200 retail branches operated by Old National Bancorp and based in Chicago and Evansville, Indiana. With assets at $48.5 billion and 250 banking centers, Old National Bancorp is the largest financial services bank holding company headquartered in Indiana and one of the top 30 banking companies in the U.S. Old National Bank has locations in Illinois, Indiana, Iowa, Kentucky, Michigan, Minnesota, North Dakota, Tennessee, and Wisconsin.
History
The bank was founded in 1834.
In November 1995, Old National acquired the Greencastle-based First United Savings Bank for $18 million in stock. In the following year, Old National acquired the Bloomington-based Workingmens Capital Holdings with its Workingmens Federal Savings Bank subsidiary for an undisclosed amount in stock.
In 2009, Charter One's Indiana bank branches became Old National Bank after Old National Bank bought Charter One's Indiana operations. In January 2011, Old National acquired Bloomington-based Monroe Bancorp with its Monroe Bank subsidiary for $90 million in stock. Later that year, Integra Bank was closed by the Federal Deposit Insurance Corporation and all deposit accounts, excluding certain brokered deposits, were transferred to Old National. In 2012, Old National acquired 24 retail bank branches of Bank of America in Indiana and Michigan. In 2014, Old National acquired four banks: Tower Bank in Fort Wayne, Indiana, United Bank in Ann Arbor, Michigan, Lafayette Savings Bank in Lafayette, Indiana, and Founders Bank & Trust in Grand Rapids, Michigan.
In May 2016, AnchorBank, the third-largest bank based in Wisconsin, was bought by Old National for approximately $461 million.
In August 2017, Old National agreed to buy Anchor Bank of Minnesota for $303 million. The acquisition will add 17 locations in the Twin Cities and 1 in Mankato plus $1.7 billion in deposits and $2.1 billion in assets. In June 2018, KleinBank, based in Chaska, Minnesota, announced its 21 locations were being acquired by Old National, increasing Old National's presence in the western suburbs of Minneapolis.
In 2021, Old National merged with First Midwest Bancorp, combining the companies' assets, retaining the Old National name, and maintaining headquarters in Chicago and Evansville.
On April 10, 2023, a mass shooting at the Louisville, Kentucky branch resulted in five fatalities (all employees) and eight other injured people, including a rookie police officer. The injured officer's partner subsequently killed the perpetrator, who was a current bank employee.
In 2024, it was announced that CapStar Financial Holdings Inc. merged its operations with those of the bank. As a result, CapStar Bank became a division of Old National Bank.
On November 25, 2024, Old National announced its purchase of Minnesota-based Bremer Bank in a $1.4 billion sale which was finalized in October, 2025. The merger created a combined bank worth $70 billion.
Services
The company offers retail banking (checking accounts, savings accounts and certificates of deposit, consumer loans including home mortgages, and small business banking & lending), business or commercial banking (checking accounts, savings accounts & CDs, commercial loans and lines of credit, credit cards, capital markets, treasury management, and merchant services), and wealth management, investment, trust and retirement products and services.
แหล่งที่มา: Wikipedia (ภาษาอังกฤษ), CC BY-SA 4.0 · ดูบน Wikipedia ↗
ONBPO ภาพรวมหุ้น ราคา, มูลค่าหลักทรัพย์ตามราคาตลาด, P/E, EPS, ROE, อัตราส่วนหนี้สินต่อทุน, ช่วงราคา 52 สัปดาห์
ONBPO กราฟราคาหุ้น OHLCV รายวันพร้อมตัวชี้วัดทางเทคนิค — แพน ซูม และปรับแต่งมุมมองของคุณ
ผลการดำเนินงาน 10 ปี แนวโน้มรายได้ กำไรสุทธิ อัตรากำไร และ EPS
การประเมินมูลค่า อัตราส่วน P/E, P/S, P/B, EV/EBITDA — หุ้นมีราคาแพงหรือถูก?
ความสามารถในการทำกำไร อัตรากำไรขั้นต้น, อัตรากำไรจากการดำเนินงาน และอัตรากำไรสุทธิ; ROE, ROA, ROIC
สุขภาพทางการเงิน หนี้สิน, สภาพคล่อง, ความสามารถในการชำระหนี้ — ความแข็งแกร่งของงบดุล
การเติบโต การเติบโตของรายได้, EPS และกำไรสุทธิ: YoY, CAGR 3 ปี, CAGR 5 ปี
ประสิทธิภาพของเงินทุน อัตราหมุนเวียนสินทรัพย์, อัตราหมุนเวียนสินค้าคงคลัง, อัตราหมุนเวียนลูกหนี้
เงินปันผล ผลตอบแทน, อัตราการจ่ายเงินปันผล, ประวัติเงินปันผล, CAGR 5 ปี
| วันที่ไม่ได้รับสิทธิปันผล | จำนวน |
|---|---|
| 5 สิงหาคม 2026 | $0.4380 |
| 5 พฤษภาคม 2026 | $0.4380 |
| 5 กุมภาพันธ์ 2026 | $0.4380 |
| 5 พฤศจิกายน 2025 | $0.4380 |
| 5 สิงหาคม 2025 | $0.4380 |
| 5 พฤษภาคม 2025 | $0.4380 |
| 5 กุมภาพันธ์ 2025 | $0.4380 |
| 5 พฤศจิกายน 2024 | $0.4380 |
| 5 สิงหาคม 2024 | $0.4380 |
| 2 พฤษภาคม 2024 | $0.4380 |
| 2 กุมภาพันธ์ 2024 | $0.4380 |
| 2 พฤศจิกายน 2023 | $0.4380 |
| 3 สิงหาคม 2023 | $0.4380 |
| 4 พฤษภาคม 2023 | $0.4380 |
| 2 กุมภาพันธ์ 2023 | $0.4380 |
| 3 พฤศจิกายน 2022 | $0.4380 |
| 4 สิงหาคม 2022 | $0.4380 |
| 4 พฤษภาคม 2022 | $0.4380 |
| 3 กุมภาพันธ์ 2022 | $0.4380 |
| 4 พฤศจิกายน 2021 | $0.4380 |
ONBPO ความเห็นหลายต่อหลายของนักวิเคราะห์ มุมมองนักวิเคราะห์ทั้งเชิงบวกและเชิงลบ, ราคาเป้าหมาย 12 เดือน, อัพไซด์
- ซื้อแนะนำ 2 13.3%
- ซื้อ 8 53.3%
- ถือ 5 33.3%
- ขาย 0 0.0%
- ขายแนะนำ 0 0.0%
ประวัติผลประกอบการ EPS จริงเทียบกับประมาณการ, เปอร์เซ็นต์ส่วนต่าง%, อัตราการชนะ, วันประกาศผลประกอบการครั้งถัดไป
| งวด | EPS Actual | EPS คาด | ส่วนต่าง |
|---|---|---|---|
| 30 มิถุนายน 2026 | $0.65 | $0.64 | 0.01% |
| 31 มีนาคม 2026 | $0.61 | $0.61 | -0.00% |
| 31 ธันวาคม 2025 | $0.62 | $0.60 | 0.02% |
| 30 กันยายน 2025 | $0.59 | $0.57 | 0.02% |
| 30 มิถุนายน 2025 | $0.53 | $0.52 | 0.01% |
| 31 มีนาคม 2025 | $0.45 | $0.43 | 0.02% |
การเปรียบเทียบกับบริษัทคู่เทียบ (อุตสาหกรรมย่อย GICS) เมตริกสำคัญเทียบกับบริษัทในกลุ่มอุตสาหกรรมเดียวกัน
| Ticker | มูลค่าตลาด | P/E | รายได้ YoY | อัตรากำไรสุทธิ | ROE | อัตรากำไรขั้นต้น |
|---|---|---|---|---|---|---|
| ONBPO | — | — | — | — | — | — |
| FHN | $11.59B | 12.8 | 7.2% | 28.7% | 11.1% | — |
| UMBF | $8.74B | 12.4 | 62.8% | 26.5% | 9.4% | — |
| SSB | $9.33B | 12.0 | 56.1% | 29.8% | 8.9% | — |
| WTFC | $9.36B | 12.3 | 5.9% | 310.1% | 11.4% | — |
| CFR | — | 12.8 | 8.3% | 29.0% | 14.8% | — |
| ONB | $8.69B | 12.5 | — | 26.5% | 8.1% | — |
| ZION | $8.64B | 9.7 | 3.6% | 135.8% | 13.1% | — |
| COLB | $8.26B | 12.2 | 18.8% | 310.7% | 8.5% | — |
| PB | $6.43B | 12.1 | 4.8% | 43.4% | 7.1% | — |
| BOKF | $7.18B | 12.9 | 6.1% | 26.6% | 10.1% | — |
ปัจจัยพื้นฐานฉบับเต็ม ตัวชี้วัดทั้งหมดรายปี — งบกำไรขาดทุน, งบดุล, งบกระแสเงินสด
งบกำไรขาดทุน 8
| ตัวชี้วัด | แนวโน้ม | Q2 2026 |
|---|---|---|
| Interest Income | $894M | |
| Pretax Income | $324M | |
| Income Tax | $71M | |
| Net Income | $253M | |
| EPS (Basic) | $0.65 | |
| EPS (Diluted) | $0.65 | |
| Shares (Basic) | 381,864,000 | |
| Shares (Diluted) | 383,273,000 |
งบดุล 11
| ตัวชี้วัด | แนวโน้ม | Q2 2026 |
|---|---|---|
| Cash & Equivalents | $1.77B | |
| Goodwill | $2.43B | |
| Intangibles | $433M | |
| Total Assets | $74.19B | |
| Total Liabilities | $65.61B | |
| Common Stock | $383M | |
| Retained Earnings | $2.78B | |
| AOCI | $-558M | |
| Stockholders' Equity | $8.58B | |
| Liabilities + Equity | $74.19B | |
| Shares Outstanding | 382,537,000 |
กระแสเงินสด 10
| ตัวชี้วัด | แนวโน้ม | Q2 2026 |
|---|---|---|
| Stock-based Comp | $9M | |
| Amort. of Intangibles | $24M | |
| Operating Cash Flow | $280M | |
| CapEx | $4M | |
| Investing Cash Flow | $-1.17B | |
| Stock Repurchased | $115M | |
| Dividends Paid | $60M | |
| Financing Cash Flow | $908M | |
| Net Change in Cash | $14M | |
| Taxes Paid | $42M |
ความสามารถในการทำกำไร 4
| ตัวชี้วัด | แนวโน้ม | Q2 2026 |
|---|---|---|
| Net Margin | 34.6% | |
| Pretax Margin | 44.2% | |
| ROA | 0.35% | |
| ROE | 3.0% |
ประสิทธิภาพ 1
| ตัวชี้วัด | แนวโน้ม | Q2 2026 |
|---|---|---|
| Asset Turnover | 0.0 |
การประเมินมูลค่า (TTM) 8
| ตัวชี้วัด | แนวโน้ม | Q2 2026 |
|---|---|---|
| Revenue TTM | $124M | |
| Net Income TTM | $795M | |
| Market Cap | $9.46B | |
| P/E | 12.1 | |
| P/S | 76.2 | |
| P/B | 1.1 | |
| P / Tangible Book | 1.7 | |
| Earnings Yield | 8.2% |
งบการเงิน งบกำไรขาดทุน, งบดุล, งบกระแสเงินสด — รายปี, 5 ปีล่าสุด
ตัวชี้วัดของฉัน รายการเฝ้าดูส่วนตัวของคุณ — แถวที่เลือกจากข้อมูลพื้นฐานฉบับเต็ม
เลือกเมตริกที่สำคัญสำหรับคุณ — คลิก ➕ ถัดจากแถวใดก็ได้ในข้อมูลพื้นฐานฉบับเต็มด้านบน
การเลือกของคุณถูกบันทึกและจะติดตามคุณไปในทุกสัญลักษณ์หุ้น
ผู้ถือครองสถาบัน (13F) 1 รายงาน · $10K ทั้งหมด · ณ วันที่ 30 มิถุนายน 2026
สถาบันที่รายงานการถือครองหุ้นนี้ในเอกสาร SEC Form 13F รายไตรมาสของตน เฉพาะสถานะ Long; ผู้ยื่นคำร้องรายเดียวอาจปรากฏสองครั้งสำหรับสัญญาออปชันที่แยกจากกัน ขา put/call ขนาดใหญ่ที่หักล้างกันมักสะท้อนถึงการทำตลาด (market-making) หรือสินค้าคงคลังที่มีการป้องกันความเสี่ยง (hedged inventory) ไม่ใช่การเชื่อมั่นในทิศทาง
| พอร์ตใหม่ | ตำแหน่งที่ปิดไปแล้ว | เพิ่มขึ้น | ลดลง | การเปลี่ยนแปลงสุทธิของจำนวนหุ้น |
|---|---|---|---|---|
| 0 (0 เทียบกับไตรมาสก่อน) | 0 (0 เทียบกับไตรมาสก่อน) | 0 (0 เทียบกับไตรมาสก่อน) | 0 (0 เทียบกับไตรมาสก่อน) | 0 |
เปรียบเทียบกับ Q1 2026. การยื่นแบบฟอร์ม 13F ของ SEC จะครบกำหนดภายใน 45 วันนับจากสิ้นสุดไตรมาส บวกกับระยะเวลาผ่อนผันสั้นๆ สำหรับผู้ยื่นล่าช้า — ไตรมาสที่ยังอยู่ในช่วงเวลานี้จะถูกข้ามไปเพื่อใช้คู่ที่รายงานล่าสุดอย่างสมบูรณ์
| สถาบัน | มูลค่า | หุ้น | % ของ 13F ที่ติดตาม | ประเภท |
|---|---|---|---|---|
| Archer Investment Corp | $9,888 | 400 | 100.00% | หุ้น |
ผู้บริหารบริษัท 1 รายชื่อผู้บริหาร · ผู้บริหาร 1 คน · กรรมการ 0 คน
| ผู้บริหารภายใน | บทบาท | กิจกรรมล่าสุด | หุ้นที่ถือครอง | ซื้อ 12 เดือน | ขาย 12 เดือน | สุทธิ 12 เดือน |
|---|---|---|---|---|---|---|
| Nicholas J Chulos | Chief Legal Officer & Corp Sec | 28 กรกฎาคม 2026 S | 53,544 | 0 | 1 | $-533,200 |
ผู้บริหารจากเอกสาร SEC Form 3/4/5; สุทธิ = เฉพาะการซื้อขายในตลาดเปิด
นักเคลื่อนไหวและเจ้าของ %+ 5 1 รายการ
นักลงทุนที่ยื่น SEC Schedule 13D — กรรมสิทธิ์ตามผลประโยชน์ที่แท้จริงสูงกว่า % 5 โดยมีเจตนาที่จะมีอิทธิพลต่อผู้ออกหลักทรัพย์ (การถือหุ้นของนักเคลื่อนไหว, การรณรงค์ในคณะกรรมการ, M&A) แต่ละแถวแสดงสถานะล่าสุดที่ทราบของตำแหน่งของผู้ยื่นคำร้องรายนั้น
| ผู้ยื่นคำร้อง | ยื่นแล้ว | ส่วนได้เสีย | สถานะ | วัตถุประสงค์ | การยื่นคำร้อง |
|---|---|---|---|---|---|
| Old National Bancorp | 31 ตุลาคม 2006 | — | การยื่นคำร้องครั้งแรก | M&A / การขาย | SEC |
Purpose is an automated classification of the filer's own stated purpose (SEC Item 4) — not investment advice. "—" means no clear purpose was stated or the text could not be classified.
การถือครอง ETF ถือโดย ETF 1 ราย
น้ำหนักสะท้อนถึงการถือครองหุ้นโดยตรง (N-PORT) เท่านั้น กองทุนเลเวอเรจหรือกองทุนที่อิงตราสารอนุพันธ์อาจมีการเปิดรับความเสี่ยงจากสัญญาแลกเปลี่ยน (swap) เพิ่มเติมซึ่งไม่แสดง
| กองทุน | น้ำหนัก | หน่วย | ณ วันที่ | แหล่งที่มา |
|---|---|---|---|---|
| PFLD · ETF Series Solutions | 0.07% | 11,101 NS | 30 เมษายน 2026 | N-PORT |