
AZO AutoZone, Inc. Common Stock
NYSE · Retail · SEC EDGAR'da Görüntüle ↗ 10-K/10-Q Eki 26, 2026AZO Hisse Senedi Özeti Fiyat, piyasa değeri, P/E, EPS, ROE, borç/öz sermaye, 52 haftalık aralık
AZO Hisse Senedi Fiyat Grafiği Teknik göstergeler ile günlük OHLCV — kaydır, yakınlaştır ve görünümünüzü özelleştirin
Çubuk çözünürlüğü seçilen döneme uyum sağlar — bir çubuk için açılış/yüksek/düşük/kapanış değerlerini görmek için grafiğin üzerine gelin.
| Ex-tarihi | Bölünme | Tür |
|---|---|---|
| 21 Nisan 1994 | 2-for-1 | İleri |
| 03 Şubat 1992 | 2-for-1 | İleri |
AutoZone, Inc. Common Stock Hakkında Wikipedia'dan şirket genel bakışı
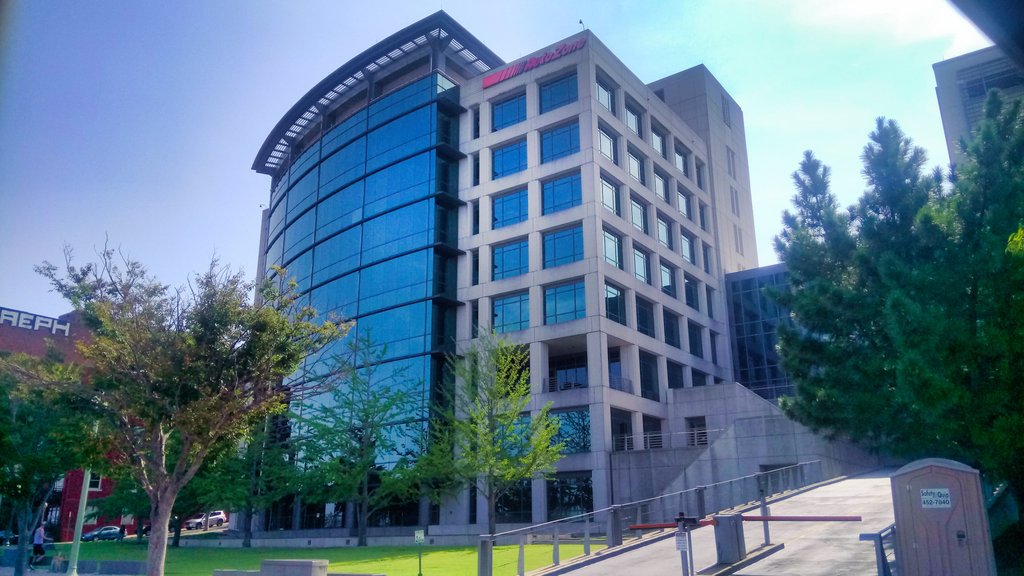
AutoZone, Inc., doing business as AutoZone (and formerly known as Auto Shack from 1979 to 1987), is an American retailer of aftermarket automotive parts and accessories, the largest in the United States. Founded in 1979, AutoZone has 7,140 stores across the United States, Mexico, Puerto Rico, Brazil, and the US Virgin Islands. The company is based in Memphis, Tennessee.
Company History
Auto Shack
AutoZone was founded by J.R. "Pitt" Hyde III as the auto parts division of Malone & Hyde, a Memphis-based wholesale grocer founded by his family. After joining the board of directors at Wal-Mart in 1978, Hyde explored new ways to diversify his family's business. On July 4, 1979, the first store opened in Forrest City, Arkansas under the name of Auto Shack. Doc Crain was the store's first manager. Sales that first day totaled $300.00. Despite not knowing much about cars, Hyde's vision was to offer good customer service, and everyday low prices, in a clean, well designed, and brightly lit shop.
By 1980, the chain expanded to eight stores across five states, and then to 20 stores the year after. In 1981, the company opened its first Express Parts Service warehouse in Memphis, allowing customers to order hard to find parts not found in most stores. By 1983, Auto Shack opened its 100th store in Weslaco, Texas.
By 1984, it had 190 locations across 13 states. In 1984, Malone & Hyde was acquired in a management buyout that included Hyde, investment firm Kohlberg Kravis Roberts & Company, and other executives, taking the public company (including Auto Shack) private. Total stores were 194 in 13 states.
In 1985, Peter Formanek was named president. He oversaw the auto parts firm's daily operations and worked on growth strategy. In 1986, Auto Shack was spun off from Malone & Hyde, with Hyde and Formanek remaining in charge. Malone & Hyde was later sold to Fleming Companies in 1988.
By 1986, expansion had made the company grow into a large store chain across the South and the Midwest. Auto Shack debuted its Duralast auto parts line, starting with alternators and starters. The Loan-A-Tool program was also introduced, allowing customers to borrow specialty tools. The fourth distribution center in Greenville, South Carolina opened. The total number of stores was 339 in 15 states.
AutoZone
In 1986, Auto Shack was sued by Radio Shack for trademark infringement. While a court initially ruled in favor of Auto Shack, Radio Shack ultimately won on appeal. In 1987 Auto Shack announced plans to change its name to AutoZone. The first AutoZone store was in Enid, Oklahoma. The company introduced an electronic catalog used to look up parts, check warranties, and view inventory. The total number of stores was 459 in 16 states.
1990s
In 1991, Hyde and KKR took the company public. Its stock began trading on the New York Stock Exchange using the ticker symbol "AZO." KKR initially held a majority of the stock, but began selling off its shares by 1993.
In 1994, AutoZone began using satellites to facilitate communication between stores and the corporate office. Sales hit $1.5 billion.
In 1995, AutoZone opened its 1,000th store in Louisville, Kentucky. Also, the Duralast trademark made its debut with the Duralast and Duralast Gold batteries. Total of stores is now 1,143 in 26 states.
In 1996, the company launched its website. It also spent $56 million to acquire ALLDATA, a software company based in Elk Grove, California that provides automotive diagnostic and repair information.
Company founder Pitt Hyde retired as chairman and CEO in 1997. John Adams became the new chairman and CEO. AutoZone made several acquisitions in 1998. In January, it acquired 112 Auto Palace stores in six states for $55 million. It also bought 43 TruckPro L.P. locations in May and 560 Chief Auto Parts stores across in June. In October, AutoZone bought 100 Express auto parts stores from Pep Boys. The company established its first international location when it opened a store in Nuevo Laredo, Mexico in December 1998. By January 1999, it announced plans to open additional stores in the country. AutoZone closed the 1990s by debuting at the Fortune 500 list in 1999.
2000s
In 2000, AutoZone opened a data processing and support center, known as DataZone, in Chihuahua, Mexico. In the years to come, new departments, including Finance, Customer Service, IT, Merchandising, and Store Technical Support would be added.
In January 2001, Steve Odland was named chairman and CEO, replacing Adams. That May, the company opened its 3,000th store in Cicero, Illinois. In December, AutoZone sold TruckPro to Paratus Capital Management.
In 2002, AutoZone developed a network of "hub, feeder, and satellite" stores to have more product in the market area, while reducing inventory investment. Sales hit $5.33 billion.
In 2003, the Duralast tool line was introduced. In April, Midas announced it was exiting the parts distribution business and would instead contract AutoZone to be its official distributor. AutoZone de Mexico opens the first DC in Nuevo Laredo, Mexico. Total stores number 3,219 in 48 states and 49 in Mexico. In April 2004, AutoZone acquired 12 stores from ABC Discount Auto Parts, an auto parts chain headquartered in Cherry Hill, New Jersey. That year, founder J.R. "Pitt" Hyde III was inducted into the Automotive Hall of Fame.
In 2005, William C. Rhodes III was named president and CEO. Steve Odland left to become the chairman and CEO of Office Depot. AutoZone opened its first Puerto Rican location in Bayamon.
In June 2007, Bill Rhodes was also made chairman. The company also opened its 4,000th store in Houston, Texas. That year, AutoZone introduced its Z-net electronic parts catalog and repair database. The system replaced the company's original text-based catalog.
2010s
In May 2010, AutoZone announced a new “Buy Online Pick-Up In-Store” service. The in June, the company unveiled a new mobile app that provides iPhone users access to vehicle repair guides, product catalogs, pricing information, and store locations. On December 15, 2011, ALLDATA LLC, an operating unit of AutoZone, expanded its direct presence in Canada to better serve its growing customer base.
On August 17, 2012, AutoZone expanded into Alaska, the company's 49th state, by opening its 5,000th store in Wasilla, Alaska. The company announced in December that it had acquired online automotive retailer AutoAnything.com. In 2012, AutoZone entered the Brazilian market by opening a store in Sao Paulo, Brazil.
In December 2012, AutoZone purchased AutoAnything.com, an e-commerce leader in aftermarket automotive parts based in San Diego, California. In 2014, the company acquired Interamerican Motor Corporation, a distributor of imported replacement parts. The deal gave AutoZone access to European and Asian markets. By November 2015, the company had expanded its hub stores to include mega hubs in Atlanta, Chicago, Los Angeles, Memphis, and New Jersey.
Between 2012 and 2016, AutoZone's stock valuation doubled in value. By April 2017, AutoZone had been the largest retailer of automotive parts in North America for three consecutive years. As of August 2017, AutoZone had 5,465 locations in the United States, 524 locations in Mexico, and 46 locations in Brazil, for a total of 6,035. The company opened its 6,000th store, in Memphis, Tennessee, on August 25, 2017.
In February 2018, AutoZone announced it had sold IMC to Parts Authority and AutoAnything to Kingswood Capital. In September, the company introduced next-day home delivery on online orders in 83 US markets. The service included 100,000 products and expanded to 95 markets by the end of the year. On October 22, 2018, Pitt Hyde announced that he would be stepping down from AutoZone's board of directors. By June 2019, the company had 174 hub stores and 28 mega hubs, with plans to continue expanding.
2020s
In March 2020, during the early days of the COVID-19 pandemic, AutoZone introduced free curbside pickup for all buy online and pickup in store orders. In late May, two AutoZone stores were destroyed by arson during the George Floyd protests in Minneapolis–Saint Paul. By September 2021, the company had 58 mega hubs and announced plans to open 20 more over the next year.
In 2023, after years functioning as a shared services center, DataZone was renamed to AutoZone Business and Technology Store Support Center. In June 2023, Rhodes announced his intention to step down as president and CEO in January 2024. Phillip Daniele was promoted to president and CEO, with Rhodes remaining as executive chairman. By May 2024, AutoZone opened over 100 mega hubs stores.
In October 2026, an AutoZone store in White Plains, New York unionized under the United Auto Workers, the first AutoZone retail location to unionize.
Corporate affairs
AutoZone is incorporated in the state of Nevada.
Headquarters
Since October 1995, AutoZone has been headquartered in its J.R. Hyde, III Store Support Center (SSC), a 270,000-square-foot (25,000 m2), eight-story building in Downtown Memphis, Tennessee. As of 2013 there were over 1,200 employees there.
The building has the capability to withstand a 9.0 magnitude earthquake because it has a special base isolation system that had a price tag of $950,000.
Private labels
AutoZone sells lead-acid car batteries (manufactured primarily by Johnson Controls) and other automotive parts using its Valucraft and Duralast private label brands. AutoZone also sells tools under the Duralast brand.
Retail stores
AutoZone's 7,657 retail outlets as of August 30, 2025 throughout the United States, Mexico and Brazil stock a variety of aftermarket parts as well as some OEM parts. All AutoZone stores are corporately owned; the company does not have franchise operations.
Sponsorships
In 2004, AutoZone celebrated its 25th anniversary and announced a corporate sponsorship agreement with auto racing association NASCAR.
In 2007, AutoZone sponsored Kevin Harvick and Timothy Peters in the NASCAR Busch Series.
AutoZone holds the naming rights to the downtown Memphis baseball stadium that is the home of the Memphis Redbirds of the Pacific Coast League. The company also sponsors the AutoZone Liberty Bowl. The AutoZone Liberty Bowl, alongside the College Football Playoff Foundation donated $250,136.03 to the St. Jude Children's Research Hospital. The AutoZone Liberty Bowl awarded 2018's Distinguished Citizen Award to Priscilla Presley.
They are an official sponsor of Bellator MMA, the world's second largest Mixed Martial Arts promotion.
Lawsuits
State prosecutors and the district attorneys of San Bernardino, Monterey, San Diego, and San Joaquin counties sued AutoZone in 2005, accusing the company of mishandling used motor oil and overcharging customers. AutoZone agreed to pay $1.5 million to settle the case.
AutoZone faced a lawsuit for gender discrimination in which the plaintiff alleged that men treated her differently when she was promoted and that she feared revealing a pregnancy to her superior. When the pregnancy was discovered, she alleges that her district manager pressured her to step down from her position. She was demoted in February 2006 and fired in November 2011. The jury on the case ruled in 2014 in favor of the plaintiff, awarding her $185 million in punitive damages as well as approximately $873,000 in back wages. AutoZone has announced its intention to appeal the verdict. The Wall Street Journal's Jacob Gershman suggested that the verdict would be scaled back.
In 2018, AutoZone paid $3.3 million to settle a lawsuit stemming from a 2016 crash that killed three after an AutoZone-owned truck rear-ended a stalled vehicle. The suit alleged that AutoZone was negligent in training the driver of the truck.
A Georgia woman was fired after a customer insulted her and used multiple racial epithets against her. In 2018, she filed a lawsuit against the company for violating her civil rights, alleging that the district manager told her to "suck it up."
In June 2019, AutoZone entered into an $11 million settlement against with the State of California to resolve allegations that the company had violated state laws governing hazardous waste, hazardous materials, and confidential consumer information. AutoZone is charged with illegally disposing of millions of hazardous waste items, including used motor oil and automotive fluids, at landfills not authorized to accept hazardous waste.
Kaynak: Wikipedia (İngilizce), CC BY-SA 4.0 · Wikipedia'da Görüntüle ↗
10 Yıllık Performans Gelir, net kar, marjlar ve EPS trendleri
Değerleme P/E, P/S, P/B, EV/EBITDA oranları — hisse senedi pahalı mı ucuz mu?
| Metrik | 5 Yıllık trend | AZO | 5Y ort. | Akran Ortalaması | Sonuç |
|---|---|---|---|---|---|
| P/E (TTM) | 20.65Y ort. ≈21.3 | ≈21.3 | 16.5 | Aşırı değerli | |
| F/S (TTM) | 2.55Y ort. ≈2.8 | ≈2.8 | 0.4 | Aşırı değerli | |
| F/D (MRQ) | -20.35Y ort. ≈-14.5 | ≈-14.5 | · | · | |
| Price / Cash Flow (Fiyat / Nakit Akışı) | 15.75Y ort. ≈16.6 | ≈16.6 | 15.4 | Adil değer | |
| EV / Revenue (EV / Gelir) | 2.95Y ort. ≈3.2 | ≈3.2 | · | · | |
| PEG Ratio (PEG Oranı) | ≈2.1 | · | · | · |
Akran ortalaması, metrik başına standartlaştırılmış bir temelde hesaplanır ve bu hisse senedi için gösterilen TTM/MRQ temelini her zaman eşleşmeyebilir.
Kârlılık Brüt, faaliyet ve net kâr marjları; ROE, ROA, ROIC
| Metrik | 5 Yıllık trend | AZO | 5Y ort. | Akran Ortalaması | Sonuç |
|---|---|---|---|---|---|
| Brüt Kar Marjı (TTM) | 52.3%5Y ort. ≈52.4% | ≈52.4% | 17.8% | En üst düzey | |
| Faaliyet Kâr Marjı (TTM) | 18.3%5Y ort. ≈19.6% | ≈19.6% | 5.0% | En üst düzey | |
| EBITDA Margin (FAVÖK Marjı) | 21.7%5Y ort. ≈22.6% | ≈22.6% | 5.1% | En üst düzey | |
| Vergi Öncesi Kar Marjı (TTM) | 16.0%5Y ort. ≈17.5% | ≈17.5% | 4.1% | En üst düzey | |
| Net Kâr Marjı (TTM) | 12.6%5Y ort. ≈13.9% | ≈13.9% | 3.1% | En üst düzey | |
| ROA (TTM) | 12.6%5Y ort. ≈15.0% | ≈15.0% | 6.8% | En üst düzey | |
| ROE (TTM) | -87.0%5Y ort. ≈-68.5% | ≈-68.5% | 14.9% | Zayıf | |
| ROIC | 44.8%5Y ort. ≈70.5% | ≈70.5% | 28.0% | En üst düzey |
Finansal Sağlık Borç, likidite, solventlik — bilanço gücü
| Metrik | 5 Yıllık trend | AZO | 5Y ort. | Akran Ortalaması | Sonuç |
|---|---|---|---|---|---|
| Debt / Equity (Borç / Öz Sermaye) | -3.65Y ort. ≈-2.3 | ≈-2.3 | 0.3 | Düşük borç | |
| Cari Oran (MRQ) | 0.95Y ort. ≈0.8 | ≈0.8 | 0.9 | Düşük likidite | |
| Quick Ratio (Cari Oran) | 0.15Y ort. ≈0.1 | ≈0.1 | 0.2 | Düşük likidite | |
| Uzun Vadeli Borç / Özkaynak (MRQ) | -3.65Y ort. ≈-2.3 | ≈-2.3 | 0.4 | Düşük borç |
Büyüme Gelir, EPS ve net gelir büyümesi: YOY, 3 Yıllık CAGR, 5 Yıllık CAGR
| Metrik | 5 Yıllık trend | AZO | 5Y ort. | Akran Ortalaması | Sonuç |
|---|---|---|---|---|---|
| Revenue YoY (Gelir Yıllık Bazda) | 7.4%5Y ort. ≈6.8% | ≈6.8% | · | · | |
| Revenue CAGR 3Y (Gelir 3 Yıllık Bileşik Büyüme Oranı) | 5.2%5Y ort. ≈7.5% | ≈7.5% | · | · | |
| Revenue CAGR 5Y (Gelir 5 Yıllık Bileşik Büyüme Oranı) | 6.8% | · | · | · | |
| EPS YoY (EPS YB) | 5.3%5Y ort. ≈10.2% | ≈10.2% | · | · | |
| Net Income YoY (Net Gelir Yıllık Bazda) | 3.0%5Y ort. ≈3.6% | ≈3.6% | · | · | |
| EPS CAGR 3Y (EPS Bileşik Yıllık Büyüme Oranı 3Y) | 4.9%5Y ort. ≈12.7% | ≈12.7% | · | · | |
| EPS CAGR 5Y (EPS Bileşik Yıllık Büyüme Oranı 5Y) | 9.9% | · | · | · | |
| Net Income CAGR 3Y (Net Gelir Bileşik Yıllık Büyüme Oranı 3Y) | 0.58%5Y ort. ≈5.5% | ≈5.5% | · | · | |
| Net Income CAGR 5Y (Net Gelir Bileşik Yıllık Büyüme Oranı 5Y) | 3.5% | · | · | · |
Sermaye Verimliliği Aktif devir hızı, stok devir hızı, alacak devir hızı
| Metrik | 5 Yıllık trend | AZO | 5Y ort. | Akran Ortalaması | Sonuç |
|---|---|---|---|---|---|
| Asset Turnover (Aktif Devir Hızı) | 1.05Y ort. ≈1.1 | ≈1.1 | 1.6 | Zayıf | |
| Receivables Turnover (Alacak Devir Hızı) | 28.55Y ort. ≈33.0 | ≈33.0 | 42.6 | Zayıf | |
| Revenue / Employee (Çalışan Başına Gelir) | ≈$260.8K | · | · | · |
değer · ≈ 5Y ort. · sektör ortalaması · ortalamaya göre değerlendirme
Kazanç Geçmişi EPS gerçekleşen vs tahmin, sürpriz %, kazanma oranı, bir sonraki kazanç tarihi
| Dönem | Rapor | EPS Gerçek | EPS Tahmin | Sürpriz |
|---|---|---|---|---|
| 30 Eylül 2026 | Eyl 22, 2026 | $56.05 | $54.40 | 3.0% |
| 30 Haziran 2026 | $38.07 | $36.65 | 3.9% | |
| 31 Mart 2026 | $27.63 | $27.40 | 0.84% | |
| 31 Aralık 2025 | $31.04 | $32.83 | -5.5% | |
| 30 Eylül 2025 | $48.71 | $51.30 | -5.1% | |
| 30 Haziran 2025 | $35.36 | $37.49 | -5.7% |
Tüm Temeller Tüm metrikler yıla göre — gelir tablosu, bilanço, nakit akışı
Gelir Tablosu
| Metrik | Eğilim | 2026 | 2025 | 2024 | 2023 | 2022 | 2021 | 2020 | 2019 | 2018 | 2017 | 2016 | 2015 |
|---|---|---|---|---|---|---|---|---|---|---|---|---|---|
| Revenue | $20.34B | $18.94B | $18.49B | $17.46B | $16.25B | $14.63B | $12.63B | $11.86B | $11.22B | $10.89B | $10.64B | $10.19B | |
| Cost of Revenue | $9.69B | $8.97B | $8.67B | $8.39B | $7.78B | $6.91B | $5.86B | $5.50B | $5.25B | $5.15B | $5.03B | $4.86B | |
| Gross Profit | $10.64B | $9.97B | $9.82B | $9.07B | $8.47B | $7.72B | $6.77B | $6.37B | $5.97B | $5.74B | $5.61B | $5.33B | |
| SG&A Expense | $6.92B | $6.36B | $6.03B | $5.60B | $5.20B | $4.77B | $4.35B | $4.15B | $4.16B | $3.66B | $3.55B | $3.37B | |
| Operating Income | $3.72B | $3.61B | $3.79B | $3.47B | $3.27B | $2.94B | $2.42B | $2.22B | $1.81B | $2.08B | $2.06B | $1.95B | |
| Interest Expense | · | · | · | $320M | $199M | $202M | $208M | $194M | $182M | $159M | $151M | $153M | |
| Interest Income | $13M | $11M | $11M | $12M | $6M | $5M | $6M | $7M | $6M | $4M | $2M | $2M | |
| Pretax Income | $3.25B | $3.13B | $3.34B | $3.17B | $3.08B | $2.75B | $2.22B | $2.03B | $1.64B | $1.93B | $1.91B | $1.80B | |
| Income Tax | $678M | $636M | $675M | $639M | $649M | $579M | $484M | $414M | $299M | $645M | $672M | $642M | |
| Net Income | $2.57B | $2.50B | $2.66B | $2.53B | $2.43B | $2.17B | $1.73B | $1.62B | $1.34B | $1.28B | $1.24B | $1.16B | |
| EPS (Basic) | $156.11 | $148.80 | $153.82 | $136.60 | $120.83 | $97.60 | $73.62 | $64.78 | $49.59 | $45.05 | $41.52 | $36.76 | |
| EPS (Diluted) | $152.55 | $144.87 | $149.55 | $132.36 | $117.19 | $95.19 | $71.93 | $63.43 | $48.77 | $44.07 | $40.70 | $36.03 | |
| Shares (Basic) | 16,481,000 | 16,789,000 | 17,309,000 | 18,510,000 | 20,107,000 | 22,237,000 | 23,540,000 | 24,966,000 | 26,970,000 | 28,430,000 | 29,889,000 | 31,560,000 | |
| Shares (Diluted) | 16,865,000 | 17,245,000 | 17,803,000 | 19,103,000 | 20,733,000 | 22,799,000 | 24,093,000 | 25,498,000 | 27,424,000 | 29,065,000 | 30,488,000 | 32,206,000 | |
| EBITDA | $4.41B | $4.22B | $4.34B | $3.97B | $3.71B | $3.35B | $2.82B | $2.59B | $2.16B | $2.40B | $2.36B | $2.22B |
Bilanço
| Metrik | Eğilim | 2026 | 2025 | 2024 | 2023 | 2022 | 2021 | 2020 | 2019 | 2018 | 2017 | 2016 | 2015 |
|---|---|---|---|---|---|---|---|---|---|---|---|---|---|
| Cash & Equivalents | $326M | $272M | $298M | $277M | $264M | $1.17B | $1.75B | $176M | $218M | $293M | $190M | $175M | |
| Receivables | $755M | $670M | $546M | $520M | $505M | $378M | $365M | $309M | $258M | $281M | $288M | $248M | |
| Other Current Assets | $289M | $374M | $308M | $218M | $221M | $226M | $223M | $224M | $216M | $155M | $130M | $122M | |
| Current Assets | $9.11B | $8.34B | $7.31B | $6.78B | $6.63B | $6.42B | $6.81B | $5.03B | $4.64B | $4.61B | $4.24B | $3.97B | |
| PP&E (Net) | $8.06B | $7.06B | $6.18B | $5.60B | $5.17B | $4.86B | $4.51B | $4.40B | $4.22B | $4.03B | $3.73B | $3.51B | |
| PP&E (Gross) | $14.17B | $12.55B | $11.31B | $10.34B | $9.45B | $8.81B | $8.14B | $7.71B | $7.29B | $6.87B | $6.33B | $5.89B | |
| Accum. Depreciation | $6.12B | $5.49B | $5.12B | $4.74B | $4.28B | $3.95B | $3.63B | $3.31B | $3.07B | $2.84B | $2.60B | $2.39B | |
| Goodwill | $303M | $303M | $303M | $303M | $303M | $303M | $303M | $303M | $303M | $392M | $392M | $392M | |
| Intangibles | · | · | · | · | · | · | $1M | $6M | $10M | $52M | $61M | $70M | |
| Other Non-current Assets | $515M | $336M | $242M | $223M | $203M | $182M | $191M | $139M | $155M | $190M | $198M | $192M | |
| Total Assets | $21.63B | $19.36B | $17.18B | $15.99B | $15.28B | $14.52B | $14.42B | $9.90B | $9.35B | $9.26B | $8.60B | $8.10B | |
| Accounts Payable | $8.60B | $8.03B | $7.36B | $7.20B | $7.30B | $6.01B | $5.16B | $4.86B | $4.41B | $4.17B | $4.10B | $3.86B | |
| Accrued Liabilities | $1.16B | $1.15B | $1.06B | $1.00B | $1.01B | $1.04B | $828M | $622M | $607M | $563M | $552M | $532M | |
| Current Liabilities | $10.11B | $9.52B | $8.71B | $8.51B | $8.59B | $7.37B | $6.28B | $5.51B | $5.03B | $4.77B | $4.69B | $4.71B | |
| Capital Leases | $3.37B | $3.09B | $2.96B | $2.92B | $2.84B | $2.63B | $2.50B | $0 | · | · | · | · | |
| Deferred Tax | $727M | $521M | $447M | $536M | $534M | $337M | $354M | $312M | · | · | $284M | · | |
| Other Non-current Liabilities | $852M | $836M | $780M | $702M | $732M | $704M | $650M | $579M | $548M | $470M | $488M | $466M | |
| Long-term Debt | · | · | · | · | · | · | $5.51B | · | · | · | · | $4.62B | |
| Total Debt | $9.08B | $8.80B | $9.02B | $7.67B | $6.12B | $5.27B | $5.51B | $5.21B | $5.01B | $5.08B | $4.92B | $4.62B | |
| Common Stock | $166.0K | $169.0K | $175.0K | $189.0K | $207.0K | $230.0K | $237.0K | $254.0K | $275.0K | $287.0K | $303.0K | $321.0K | |
| Retained Earnings | $-2.82B | $-3.98B | $-4.42B | $-2.96B | $-1.33B | $-420M | $-1.45B | $-1.31B | $-1.21B | $-1.64B | $-1.60B | $-1.42B | |
| Treasury Stock | $1.56B | $997M | $1.58B | $2.68B | $3.26B | $2.54B | $356M | $1.40B | $1.23B | $618M | $933M | $972M | |
| AOCI | $-159M | $-285M | $-362M | $-191M | $-301M | $-308M | $-354M | $-269M | $-236M | $-255M | $-308M | $-250M | |
| Stockholders' Equity | $-2.50B | $-3.41B | $-4.75B | $-4.35B | $-3.54B | $-1.80B | $-878M | $-1.71B | $-1.52B | $-1.43B | $-1.79B | $-1.70B | |
| Liabilities + Equity | $21.63B | $19.36B | $17.18B | $15.99B | $15.28B | $14.52B | $14.42B | $9.90B | $9.35B | $9.26B | $8.60B | $8.10B | |
| Shares Outstanding | 16,173,000 | 16,665,000 | 16,926,000 | 17,857,000 | 19,126,000 | 21,138,000 | 23,376,000 | 24,038,000 | 25,742,000 | 27,833,000 | 29,118,000 | 30,659,000 |
Nakit Akışı
| Metrik | Eğilim | 2026 | 2025 | 2024 | 2023 | 2022 | 2021 | 2020 | 2019 | 2018 | 2017 | 2016 | 2015 |
|---|---|---|---|---|---|---|---|---|---|---|---|---|---|
| D&A | $684M | $613M | $550M | $498M | $442M | $408M | $397M | $370M | $345M | $323M | $297M | $270M | |
| Deferred Tax | $-188M | $115M | $-254M | $-26M | $186M | $-34M | $51M | $35M | $-124M | $75M | $45M | $36M | |
| Amort. of Intangibles | · | · | · | · | · | · | $4M | $4M | $5M | $8M | $9M | $9M | |
| Other Non-cash | $180M | $-109M | $46M | $-60M | $154M | $975M | $539M | $106M | $522M | $-108M | $-6M | $59M | |
| Operating Cash Flow | $3.25B | $3.12B | $3.00B | $2.94B | $3.21B | $3.52B | $2.72B | $2.13B | $2.08B | $1.57B | $1.64B | $1.57B | |
| CapEx | $1.43B | $1.33B | $1.07B | $797M | $672M | $622M | $458M | $496M | $522M | $554M | $489M | $481M | |
| Investing Cash Flow | $-1.44B | $-1.40B | $-1.29B | $-876M | $-648M | $-602M | $-498M | $-492M | $-522M | $-554M | $-506M | · | |
| Net Debt Issued | · | $-900M | $-300M | $-800M | $-500M | $-250M | $-500M | $-250M | $-250M | $-400M | $-500M | $-500M | |
| Stock Repurchased | $2.01B | $1.58B | $3.14B | $3.70B | $4.36B | $3.38B | $931M | $2.00B | $1.59B | $1.07B | $1.45B | $1.27B | |
| Net Stock Activity | $-2.01B | $-1.58B | $-3.14B | $-3.70B | $-4.36B | $-3.38B | $-931M | $-2.00B | $-1.59B | $-1.07B | $-1.45B | $-1.27B | |
| Financing Cash Flow | $-1.77B | $-1.75B | $-1.68B | $-2.06B | $-3.47B | $-3.50B | $-644M | $-1.67B | $-1.63B | $-914M | $-1.12B | · | |
| Net Change in Cash | $54M | $-26M | $21M | $13M | $-907M | $-579M | $1.57B | $-42M | $-75M | $104M | $14M | $51M | |
| Taxes Paid | $312M | $313M | $438M | $570M | $461M | $575M | $339M | $384M | $427M | $580M | $582M | · | |
| Free Cash Flow | $1.82B | $1.79B | $1.93B | $2.14B | $2.54B | $2.90B | $2.26B | $1.63B | $1.56B | $1.02B | $1.09B | $1.04B | |
| Levered FCF | · | · | · | $1.89B | $2.38B | $2.74B | $2.10B | $1.48B | $1.41B | $911M | $991M | $946M |
Kârlılık
| Metrik | Eğilim | 2026 | 2025 | 2024 | 2023 | 2022 | 2021 | 2020 | 2019 | 2018 | 2017 | 2016 | 2015 |
|---|---|---|---|---|---|---|---|---|---|---|---|---|---|
| Gross Margin | 52.3% | 52.6% | 53.1% | 52.0% | 52.1% | 52.8% | 53.6% | 53.6% | 53.2% | 52.7% | 52.7% | 52.3% | |
| Operating Margin | 18.3% | 19.1% | 20.5% | 19.9% | 20.1% | 20.1% | 19.1% | 18.7% | 16.1% | 19.1% | 19.4% | 19.2% | |
| Net Margin | 12.7% | 13.2% | 14.4% | 14.5% | 14.9% | 14.8% | 13.7% | 13.6% | 11.9% | 11.8% | 11.7% | 11.4% | |
| Pretax Margin | 16.0% | 16.6% | 18.1% | 18.1% | 18.9% | 18.8% | 17.5% | 17.1% | 14.6% | 17.7% | 18.0% | 17.7% | |
| EBITDA Margin | 21.7% | 22.3% | 23.5% | 22.8% | 22.9% | 22.9% | 22.3% | 21.8% | 19.2% | 22.1% | 22.2% | 21.8% | |
| ROA | 12.6% | 13.7% | 16.1% | 16.2% | 16.3% | 15.0% | 14.2% | 16.8% | 14.4% | 14.3% | 14.9% | 14.9% | |
| ROE | -95.1% | -63.5% | -55.5% | -58.5% | -70.2% | -121.9% | -138.1% | -97.9% | -92.8% | -79.7% | -71.1% | -69.8% | |
| ROIC | 44.8% | 53.4% | 70.7% | 83.6% | 99.9% | 66.9% | 40.8% | 50.5% | 42.5% | 37.9% | 42.6% | 43.0% |
Likidite ve Solventlik
| Metrik | Eğilim | 2026 | 2025 | 2024 | 2023 | 2022 | 2021 | 2020 | 2019 | 2018 | 2017 | 2016 | 2015 |
|---|---|---|---|---|---|---|---|---|---|---|---|---|---|
| Current Ratio | 0.9 | 0.9 | 0.8 | 0.8 | 0.8 | 0.9 | 1.1 | 0.9 | 0.9 | 1.0 | 0.9 | 0.8 | |
| Quick Ratio | 0.1 | 0.1 | 0.1 | 0.1 | 0.1 | 0.2 | 0.3 | 0.1 | 0.1 | 0.1 | 0.1 | 0.1 | |
| Debt / Equity | -3.6 | -2.6 | -1.9 | -1.8 | -1.7 | -2.9 | -6.3 | -3.0 | -3.3 | -3.6 | -2.8 | -2.7 | |
| LT Debt / Equity | -3.6 | -2.6 | -1.9 | -1.8 | -1.7 | -2.9 | -6.3 | -3.0 | -3.3 | -3.6 | -2.8 | -2.7 | |
| Interest Coverage | · | · | · | 10.9 | 16.4 | 14.6 | 11.6 | 11.4 | 10.0 | 13.1 | 13.6 | 12.8 |
Verimlilik
| Metrik | Eğilim | 2026 | 2025 | 2024 | 2023 | 2022 | 2021 | 2020 | 2019 | 2018 | 2017 | 2016 | 2015 |
|---|---|---|---|---|---|---|---|---|---|---|---|---|---|
| Asset Turnover | 1.0 | 1.0 | 1.1 | 1.1 | 1.1 | 1.0 | 1.0 | 1.2 | 1.2 | 1.2 | 1.3 | 1.3 | |
| Receivables Turnover | 28.5 | 31.2 | 34.7 | 34.1 | 36.8 | 39.4 | 37.5 | 41.8 | 41.6 | 38.3 | 39.7 | 45.4 |
Hisse Başına
| Metrik | Eğilim | 2026 | 2025 | 2024 | 2023 | 2022 | 2021 | 2020 | 2019 | 2018 | 2017 | 2016 | 2015 |
|---|---|---|---|---|---|---|---|---|---|---|---|---|---|
| Book Value / Share | $-154.73 | $-204.88 | $-280.61 | $-243.60 | $-185.03 | $-85.04 | $-37.56 | $-71.30 | $-59.06 | $-51.32 | $-61.39 | $-55.49 | |
| Revenue / Share | $1205.96 | $1098.21 | $1038.60 | $913.85 | $783.88 | $641.68 | $524.30 | $465.28 | $409.17 | $374.63 | $348.85 | $316.32 | |
| Cash Flow / Share | $192.65 | $180.77 | $168.74 | $153.94 | $154.88 | $154.33 | $112.90 | $83.48 | $75.86 | $54.04 | $51.74 | $47.36 | |
| Cash / Share | $20.16 | $16.31 | $17.62 | $15.52 | $13.82 | $55.41 | $74.90 | $7.33 | $8.46 | $10.54 | $6.52 | $5.72 | |
| EPS (TTM) | $152.55 | $144.87 | $149.55 | $132.36 | $117.19 | $95.19 | $71.93 | $63.43 | $48.77 | $44.07 | $40.70 | $36.03 |
Büyüme Oranları
| Metrik | Eğilim | 2026 | 2025 | 2024 | 2023 | 2022 | 2021 | 2020 | 2019 | 2018 | 2017 | 2016 | 2015 |
|---|---|---|---|---|---|---|---|---|---|---|---|---|---|
| Revenue YoY | 7.4% | 2.4% | 5.9% | 7.4% | 11.1% | 15.8% | · | · | · | · | · | · | |
| Revenue CAGR 3Y | 5.2% | 5.2% | 8.1% | 11.4% | · | · | · | · | · | · | · | · | |
| Revenue CAGR 5Y | 6.8% | 8.4% | · | · | · | · | · | · | · | · | · | · | |
| EPS YoY | 5.3% | -3.1% | 13.0% | 12.9% | 23.1% | 32.3% | · | · | · | · | · | · | |
| EPS CAGR 3Y | 4.9% | 7.3% | 16.2% | 22.5% | · | · | · | · | · | · | · | · | |
| EPS CAGR 5Y | 9.9% | 15.0% | · | · | · | · | · | · | · | · | · | · | |
| Net Income YoY | 3.0% | -6.2% | 5.3% | 4.1% | 11.9% | 25.2% | · | · | · | · | · | · | |
| Net Income CAGR 3Y | 0.58% | 0.93% | 7.0% | 13.4% | · | · | · | · | · | · | · | · | |
| Net Income CAGR 5Y | 3.5% | 7.6% | · | · | · | · | · | · | · | · | · | · |
Değerleme (TTM)
| Metrik | Eğilim | 2026 | 2025 | 2024 | 2023 | 2022 | 2021 | 2020 | 2019 | 2018 | 2017 | 2016 | 2015 |
|---|---|---|---|---|---|---|---|---|---|---|---|---|---|
| Revenue TTM | $20.34B | $18.94B | $18.49B | $17.46B | $16.25B | $14.63B | $12.63B | $11.86B | $11.22B | $10.89B | $10.64B | $10.19B | |
| Net Income TTM | $2.57B | $2.50B | $2.66B | $2.53B | $2.43B | $2.17B | $1.73B | $1.62B | $1.34B | $1.28B | $1.24B | $1.16B | |
| Market Cap | $47.90B | $69.97B | $53.85B | $43.81B | $41.37B | $32.73B | $27.80B | $26.48B | $19.83B | $14.72B | $21.94B | $22.27B | |
| Enterprise Value | $56.66B | $78.50B | $62.58B | $51.20B | $47.23B | $36.83B | $31.56B | $31.51B | $24.62B | $19.51B | $26.67B | $26.72B | |
| P/E | 19.4 | 29.0 | 21.3 | 18.5 | 18.5 | 16.3 | 16.5 | 17.4 | 15.8 | 12.0 | 18.5 | 20.2 | |
| P/S | 2.4 | 3.7 | 2.9 | 2.5 | 2.5 | 2.2 | 2.2 | 2.2 | 1.8 | 1.4 | 2.1 | 2.2 | |
| P/B | -19.1 | -20.5 | -11.3 | -10.1 | -11.7 | -18.2 | -31.7 | -15.5 | -13.0 | -10.3 | -12.3 | -13.1 | |
| P / Cash Flow | 14.7 | 22.4 | 17.9 | 14.9 | 12.9 | 9.3 | 10.2 | 12.4 | 9.5 | 9.4 | 13.9 | 14.6 | |
| P / FCF | · | 39.1 | 27.9 | 20.4 | 16.3 | 11.3 | 12.3 | 16.2 | 12.7 | 14.5 | 20.2 | 21.3 | |
| EV / EBITDA | · | 18.6 | 14.4 | 12.9 | 12.7 | 11.0 | 11.2 | 12.2 | 11.4 | 8.1 | 11.3 | 12.0 | |
| EV / FCF | · | 43.9 | 32.4 | 23.9 | 18.6 | 12.7 | 13.9 | 19.3 | 15.8 | 19.2 | 24.5 | 25.6 | |
| EV / Revenue | 2.8 | 4.1 | 3.4 | 2.9 | 2.9 | 2.5 | 2.5 | 2.7 | 2.2 | 1.8 | 2.5 | 2.6 | |
| Earnings Yield | 5.1% | 3.5% | 4.7% | 5.4% | 5.4% | 6.2% | 6.0% | 5.8% | 6.3% | 8.3% | 5.4% | 5.0% |
Gelir Tablosu
| Metrik | Eğilim | Q4 2026 | Q3 2026 | Q2 2026 | Q1 2026 | Q4 2025 | Q3 2025 | Q2 2025 | Q1 2025 | Q4 2024 | Q3 2024 | Q2 2024 | Q1 2024 | Q3 2023 | Q2 2023 | Q1 2023 | Q3 2022 |
|---|---|---|---|---|---|---|---|---|---|---|---|---|---|---|---|---|---|
| Revenue | $6.59B | $4.84B | $4.27B | $4.63B | $6.24B | $4.46B | $3.95B | $4.28B | $6.21B | $4.24B | $3.86B | $4.19B | $4.09B | $3.69B | $3.99B | $3.87B | |
| Cost of Revenue | $3.08B | $2.32B | $2.03B | $2.27B | $3.03B | $2.11B | $1.82B | $2.01B | $2.95B | $1.97B | $1.78B | $1.98B | $1.94B | $1.76B | $1.99B | $1.86B | |
| Gross Profit | $3.52B | $2.52B | $2.24B | $2.36B | $3.22B | $2.35B | $2.13B | $2.27B | $3.26B | $2.27B | $2.08B | $2.21B | $2.15B | $1.93B | $1.99B | $2.01B | |
| SG&A Expense | $2.20B | $1.60B | $1.54B | $1.58B | $2.02B | $1.49B | $1.42B | $1.43B | $1.96B | $1.37B | $1.34B | $1.37B | $1.29B | $1.26B | $1.27B | $1.22B | |
| Operating Income | $1.32B | $924M | $698M | $784M | $1.20B | $866M | $707M | $841M | $1.30B | $900M | $743M | $849M | $858M | $670M | $723M | $786M | |
| Pretax Income | $1.17B | $813M | $591M | $678M | $1.05B | $755M | $598M | $734M | $1.14B | $796M | $641M | $757M | $784M | $604M | $665M | $744M | |
| Income Tax | $237M | $172M | $122M | $147M | $211M | $146M | $110M | $169M | $241M | $144M | $126M | $164M | $136M | $128M | $126M | $151M | |
| Net Income | $932M | $641M | $469M | $531M | $837M | $608M | $488M | $565M | $902M | $652M | $515M | $593M | $648M | $477M | $539M | $593M | |
| EPS (Basic) | $56.99 | $38.95 | $28.29 | $31.88 | $50.01 | $36.33 | $29.06 | $33.40 | $52.84 | $37.73 | $29.74 | $33.51 | $35.22 | $25.48 | $28.37 | $29.93 | |
| EPS (Diluted) | $55.81 | $38.07 | $27.63 | $31.04 | $48.70 | $35.36 | $28.29 | $32.52 | $51.42 | $36.69 | $28.89 | $32.55 | $34.12 | $24.64 | $27.45 | $29.03 | |
| Shares (Basic) | · | 16,468,000 | 16,573,000 | 16,652,000 | · | 16,746,000 | 16,788,000 | 16,913,000 | · | 17,273,000 | 17,319,000 | 17,709,000 | 18,389,000 | 18,705,000 | 19,007,000 | 19,798,000 | |
| Shares (Diluted) | · | 16,852,000 | 16,969,000 | 17,102,000 | · | 17,207,000 | 17,245,000 | 17,370,000 | · | 17,761,000 | 17,828,000 | 18,234,000 | 18,983,000 | 19,337,000 | 19,645,000 | 20,414,000 | |
| EBITDA | · | $924M | $698M | $932M | · | $866M | $707M | $974M | · | $900M | $743M | $969M | $858M | $670M | $832M | $786M |
Bilanço
| Metrik | Eğilim | Q4 2026 | Q3 2026 | Q2 2026 | Q1 2026 | Q4 2025 | Q3 2025 | Q2 2025 | Q1 2025 | Q4 2024 | Q3 2024 | Q2 2024 | Q1 2024 | Q3 2023 | Q2 2023 | Q1 2023 | Q3 2022 |
|---|---|---|---|---|---|---|---|---|---|---|---|---|---|---|---|---|---|
| Cash & Equivalents | $326M | $254M | $285M | $288M | $272M | $269M | $301M | $304M | $298M | $275M | $304M | $283M | $275M | $301M | $270M | $263M | |
| Receivables | $755M | $765M | $698M | $638M | $670M | $589M | $597M | $533M | $546M | $587M | $501M | $512M | $471M | $485M | $502M | $440M | |
| Other Current Assets | $289M | $357M | $364M | $373M | $374M | $306M | $316M | $309M | $308M | $272M | $382M | $387M | $259M | $277M | $254M | $239M | |
| Current Assets | $9.11B | $8.93B | $8.83B | $8.44B | $8.34B | $7.99B | $7.80B | $7.42B | $7.31B | $7.29B | $7.16B | $6.96B | $6.71B | $6.79B | $6.63B | $6.25B | |
| PP&E (Net) | $8.06B | $7.80B | $7.55B | $7.24B | $7.06B | $6.73B | $6.45B | $6.28B | $6.18B | $6.05B | $5.91B | $5.71B | $5.33B | $5.24B | $5.19B | $4.97B | |
| PP&E (Gross) | $14.17B | $13.74B | $13.37B | $12.87B | $12.55B | $12.13B | $11.76B | $11.49B | $11.31B | $11.08B | $10.85B | $10.55B | $9.94B | $9.72B | $9.57B | $9.14B | |
| Accum. Depreciation | $6.12B | $5.95B | $5.81B | $5.63B | $5.49B | $5.40B | $5.31B | $5.21B | $5.12B | $5.03B | $4.94B | $4.84B | $4.60B | $4.49B | $4.38B | $4.17B | |
| Goodwill | $303M | $303M | $303M | $303M | $303M | $303M | $303M | $303M | $303M | $303M | $303M | $303M | $303M | $303M | $303M | $303M | |
| Other Non-current Assets | $515M | $336M | $318M | $313M | $336M | $360M | $344M | $295M | $242M | $285M | $266M | $237M | $231M | $208M | $210M | $186M | |
| Total Assets | $21.63B | $20.92B | $20.44B | $19.67B | $19.36B | $18.62B | $18.12B | $17.47B | $17.18B | $17.11B | $16.72B | $16.29B | $15.60B | $15.55B | $15.32B | $14.52B | |
| Accounts Payable | $8.60B | $8.40B | $8.30B | $8.26B | $8.03B | $7.89B | $7.78B | $7.50B | $7.36B | $7.37B | $7.15B | $7.18B | $7.22B | $7.32B | $7.35B | $6.79B | |
| Accrued Liabilities | $1.16B | $1.23B | $1.22B | $1.21B | $1.15B | $1.10B | $1.02B | $1.03B | $1.06B | $989M | $1.21B | $1.20B | $906M | $934M | $983M | $925M | |
| Current Liabilities | $10.11B | $10.04B | $9.92B | $9.81B | $9.52B | $9.47B | $9.27B | $8.89B | $8.71B | $9.19B | $8.77B | $8.79B | $8.46B | $8.61B | $8.71B | $8.06B | |
| Capital Leases | $3.37B | $3.28B | $3.18B | $3.14B | $3.09B | $3.02B | $3.01B | $2.98B | $2.96B | $2.96B | $2.90B | $2.91B | $2.86B | $2.85B | $2.84B | $2.66B | |
| Deferred Tax | $727M | $484M | $504M | $532M | $521M | $412M | $475M | $496M | $447M | $543M | $540M | $534M | $538M | $536M | $549M | $419M | |
| Other Non-current Liabilities | $852M | $887M | $840M | $786M | $836M | $845M | $772M | $759M | $780M | $752M | $710M | $692M | $694M | $682M | $729M | $708M | |
| Long-term Debt | · | · | · | · | · | · | · | · | · | $9.00B | · | · | · | · | · | · | |
| Total Debt | · | $9.02B | $8.91B | $8.62B | · | $8.85B | $9.05B | $9.01B | · | $9.00B | $8.63B | $8.58B | $7.34B | $7.04B | $6.33B | $6.06B | |
| Common Stock | $166.0K | $166.0K | $166.0K | $170.0K | $169.0K | $169.0K | $168.0K | $175.0K | $175.0K | $174.0K | $174.0K | $190.0K | $189.0K | $188.0K | $208.0K | $207.0K | |
| Retained Earnings | $-2.82B | $-3.75B | $-4.39B | $-3.45B | $-3.98B | $-4.81B | $-5.42B | $-3.86B | $-4.42B | $-5.33B | $-5.98B | $-2.37B | $-3.82B | $-4.47B | $-791M | $-2.14B | |
| Treasury Stock | $1.56B | $865M | $279M | $1.43B | $997M | $551M | $300M | $2.09B | $1.58B | $874M | $139M | $4.19B | $1.68B | $767M | $4.16B | $2.26B | |
| AOCI | $-159M | $-137M | $-158M | $-263M | $-285M | $-357M | $-408M | $-407M | $-362M | $-203M | $-205M | $-210M | $-227M | $-269M | $-297M | $-302M | |
| Stockholders' Equity | $-2.50B | $-2.78B | $-2.91B | $-3.23B | $-3.41B | $-3.97B | $-4.46B | $-4.67B | $-4.75B | $-4.84B | $-4.84B | $-5.21B | $-4.30B | $-4.18B | $-3.84B | $-3.39B | |
| Liabilities + Equity | $21.63B | $20.92B | $20.44B | $19.67B | $19.36B | $18.62B | $18.12B | $17.47B | $17.18B | $17.11B | $16.72B | $16.29B | $15.60B | $15.55B | $15.32B | $14.52B | |
| Shares Outstanding | 16,173,000 | 16,369,000 | 16,519,000 | 16,585,000 | 16,665,000 | 16,724,000 | 16,747,000 | 16,810,000 | 16,926,000 | 17,144,000 | 17,312,000 | 17,326,000 | 18,225,000 | 18,467,000 | 18,797,000 | 19,576,000 |
Nakit Akışı
| Metrik | Eğilim | Q4 2026 | Q3 2026 | Q2 2026 | Q1 2026 | Q4 2025 | Q3 2025 | Q2 2025 | Q1 2025 | Q4 2024 | Q3 2024 | Q2 2024 | Q1 2024 | Q3 2023 | Q2 2023 | Q1 2023 | Q3 2022 |
|---|---|---|---|---|---|---|---|---|---|---|---|---|---|---|---|---|---|
| D&A | · | · | · | $148M | · | · | · | $133M | · | · | · | $120M | · | · | $109M | · | |
| Deferred Tax | · | · | · | $-42M | · | · | · | $-5M | · | · | · | $882.0K | · | · | $14M | · | |
| Other Non-cash | · | · | · | $307M | · | · | · | $119M | · | · | · | $116M | · | · | $131M | · | |
| Operating Cash Flow | · | · | · | $944M | · | · | · | $812M | · | · | · | $830M | · | · | $794M | · | |
| CapEx | · | · | · | $314M | · | · | · | $247M | · | · | · | $235M | · | · | $114M | · | |
| Investing Cash Flow | · | · | · | $-327M | · | · | · | $-266M | · | · | · | $-271M | · | · | $-114M | · | |
| Stock Repurchased | · | · | · | $427M | · | · | · | $540M | · | · | · | $1.49B | · | · | $900M | · | |
| Net Stock Activity | · | · | · | $-427M | · | · | · | $-540M | · | · | · | $-1.49B | · | · | $-900M | · | |
| Financing Cash Flow | · | · | · | $-603M | · | · | · | $-538M | · | · | · | $-552M | · | · | $-676M | · | |
| Net Change in Cash | · | · | · | $16M | · | · | · | $6M | · | · | · | $6M | · | · | $5M | · | |
| Free Cash Flow | · | · | · | $630M | · | · | · | $565M | · | · | · | $595M | · | · | $679M | · |
Kârlılık
| Metrik | Eğilim | Q4 2026 | Q3 2026 | Q2 2026 | Q1 2026 | Q4 2025 | Q3 2025 | Q2 2025 | Q1 2025 | Q4 2024 | Q3 2024 | Q2 2024 | Q1 2024 | Q3 2023 | Q2 2023 | Q1 2023 | Q3 2022 |
|---|---|---|---|---|---|---|---|---|---|---|---|---|---|---|---|---|---|
| Gross Margin | · | 52.1% | 52.5% | 51.0% | · | 52.7% | 53.9% | 53.0% | · | 53.5% | 53.9% | 52.8% | 52.5% | 52.3% | 50.0% | 51.9% | |
| Operating Margin | · | 19.1% | 16.3% | 16.9% | · | 19.4% | 17.9% | 19.7% | · | 21.2% | 19.3% | 20.2% | 21.0% | 18.1% | 18.1% | 20.3% | |
| Net Margin | · | 13.2% | 11.0% | 11.5% | · | 13.6% | 12.3% | 13.2% | · | 15.4% | 13.4% | 14.2% | 15.8% | 12.9% | 13.5% | 15.3% | |
| Pretax Margin | · | 16.8% | 13.8% | 14.6% | · | 16.9% | 15.1% | 17.1% | · | 18.8% | 16.6% | 18.1% | 19.2% | 16.4% | 16.7% | 19.2% | |
| EBITDA Margin | · | 19.1% | 16.3% | 20.1% | · | 19.4% | 17.9% | 22.8% | · | 21.2% | 19.3% | 23.1% | 21.0% | 18.1% | 20.9% | 20.3% | |
| ROA | · | 3.2% | 2.4% | 2.9% | · | 3.4% | 2.8% | 3.4% | · | 4.0% | 3.2% | 3.8% | 4.3% | 3.2% | 3.6% | 4.1% | |
| ROE | · | -19.0% | -12.7% | -13.4% | · | -13.8% | -10.5% | -11.4% | · | -14.3% | -11.4% | -13.1% | -16.9% | -13.0% | -18.1% | -23.0% | |
| ROIC | · | 11.7% | 9.2% | 11.4% | · | 14.3% | 12.6% | 14.9% | · | 17.7% | 15.8% | 19.7% | 23.3% | 18.5% | 23.5% | 23.4% |
Likidite ve Solventlik
| Metrik | Eğilim | Q4 2026 | Q3 2026 | Q2 2026 | Q1 2026 | Q4 2025 | Q3 2025 | Q2 2025 | Q1 2025 | Q4 2024 | Q3 2024 | Q2 2024 | Q1 2024 | Q3 2023 | Q2 2023 | Q1 2023 | Q3 2022 |
|---|---|---|---|---|---|---|---|---|---|---|---|---|---|---|---|---|---|
| Current Ratio | · | 0.9 | 0.9 | 0.9 | · | 0.8 | 0.8 | 0.8 | · | 0.8 | 0.8 | 0.8 | 0.8 | 0.8 | 0.8 | 0.8 | |
| Quick Ratio | · | 0.1 | 0.1 | 0.1 | · | 0.1 | 0.1 | 0.1 | · | 0.1 | 0.1 | 0.1 | 0.1 | 0.1 | 0.1 | 0.1 | |
| Debt / Equity | · | -3.2 | -3.1 | -2.7 | · | -2.2 | -2.0 | -1.9 | · | -1.9 | -1.8 | -1.6 | -1.7 | -1.7 | -1.6 | -1.8 | |
| LT Debt / Equity | · | -3.2 | -3.1 | -2.7 | · | -2.2 | -2.0 | -1.9 | · | -1.8 | -1.8 | -1.6 | -1.7 | -1.7 | -1.6 | -1.8 |
Verimlilik
| Metrik | Eğilim | Q4 2026 | Q3 2026 | Q2 2026 | Q1 2026 | Q4 2025 | Q3 2025 | Q2 2025 | Q1 2025 | Q4 2024 | Q3 2024 | Q2 2024 | Q1 2024 | Q3 2023 | Q2 2023 | Q1 2023 | Q3 2022 |
|---|---|---|---|---|---|---|---|---|---|---|---|---|---|---|---|---|---|
| Asset Turnover | · | 0.2 | 0.2 | 0.2 | · | 0.2 | 0.2 | 0.3 | · | 0.3 | 0.2 | 0.3 | 0.3 | 0.2 | 0.3 | 0.3 | |
| Receivables Turnover | · | 7.2 | 6.6 | 7.9 | · | 7.6 | 7.2 | 8.2 | · | 8.0 | 7.8 | 8.3 | 9.0 | 8.3 | 9.0 | 9.7 |
Hisse Başına
| Metrik | Eğilim | Q4 2026 | Q3 2026 | Q2 2026 | Q1 2026 | Q4 2025 | Q3 2025 | Q2 2025 | Q1 2025 | Q4 2024 | Q3 2024 | Q2 2024 | Q1 2024 | Q3 2023 | Q2 2023 | Q1 2023 | Q3 2022 |
|---|---|---|---|---|---|---|---|---|---|---|---|---|---|---|---|---|---|
| Book Value / Share | · | $-170.11 | $-176.09 | $-194.67 | · | $-237.65 | $-266.18 | $-277.98 | · | $-282.21 | $-279.42 | $-300.92 | $-236.03 | $-226.58 | $-204.18 | $-173.03 | |
| Revenue / Share | · | $287.26 | $251.88 | $270.65 | · | $259.45 | $229.17 | $246.38 | · | $238.47 | $216.46 | $229.81 | $215.48 | $190.88 | $202.85 | $189.34 | |
| Cash Flow / Share | · | · | · | $55.21 | · | · | · | $46.74 | · | · | · | $45.53 | · | · | $40.40 | · | |
| Cash / Share | · | $15.50 | $17.28 | $17.34 | · | $16.06 | $17.97 | $18.09 | · | $16.06 | $17.57 | $16.33 | $15.08 | $16.31 | $14.35 | $13.44 | |
| EPS (TTM) | · | $145.44 | $142.73 | $143.39 | · | $147.59 | $148.92 | $149.52 | · | $144.28 | $141.71 | $137.46 | $126.38 | $121.29 | $118.95 | $112.19 |
Değerleme (TTM)
| Metrik | Eğilim | Q4 2026 | Q3 2026 | Q2 2026 | Q1 2026 | Q4 2025 | Q3 2025 | Q2 2025 | Q1 2025 | Q4 2024 | Q3 2024 | Q2 2024 | Q1 2024 | Q3 2023 | Q2 2023 | Q1 2023 | Q3 2022 |
|---|---|---|---|---|---|---|---|---|---|---|---|---|---|---|---|---|---|
| Revenue TTM | · | $19.99B | $19.61B | $19.29B | · | $18.90B | $18.67B | $18.58B | · | $17.98B | $17.83B | $17.66B | $17.11B | $16.89B | $16.57B | $15.82B | |
| Net Income TTM | · | $2.48B | $2.45B | $2.46B | · | $2.56B | $2.61B | $2.63B | · | $2.63B | $2.62B | $2.58B | $2.47B | $2.42B | $2.41B | $2.41B | |
| Market Cap | · | $57.23B | $63.73B | $64.65B | · | $61.27B | $57.92B | $52.10B | · | $50.61B | $46.40B | $45.52B | $49.05B | $46.42B | $46.26B | $39.15B | |
| Enterprise Value | · | $65.99B | $72.35B | $72.98B | · | $69.86B | $66.67B | $60.81B | · | $59.33B | $54.72B | $53.82B | $56.12B | $53.16B | $52.31B | $44.95B | |
| P/E | · | 24.0 | 27.0 | 27.2 | · | 24.8 | 23.2 | 20.7 | · | 20.5 | 18.9 | 19.1 | 21.3 | 20.7 | 20.7 | 17.8 | |
| P/S | · | 2.9 | 3.3 | 3.4 | · | 3.2 | 3.1 | 2.8 | · | 2.8 | 2.6 | 2.6 | 2.9 | 2.7 | 2.8 | 2.5 | |
| P/B | · | -20.6 | -21.9 | -20.0 | · | -15.4 | -13.0 | -11.1 | · | -10.5 | -9.6 | -8.7 | -11.4 | -11.1 | -12.1 | -11.6 | |
| P / Cash Flow | · | · | · | 68.5 | · | · | · | 64.2 | · | · | · | 54.8 | · | · | 58.3 | · | |
| EV / Revenue | · | 3.3 | 3.7 | 3.8 | · | 3.7 | 3.6 | 3.3 | · | 3.3 | 3.1 | 3.0 | 3.3 | 3.1 | 3.2 | 2.8 | |
| Earnings Yield | · | 4.2% | 3.7% | 3.7% | · | 4.0% | 4.3% | 4.8% | · | 4.9% | 5.3% | 5.2% | 4.7% | 4.8% | 4.8% | 5.6% |
En son dönem solda · null değerler · olarak gösterilir
Finansal Tablolar Gelir tablosu, bilanço, nakit akışı — yıllık, son 5 yıl
| Metrik | 2026-08-29 | 2025-08-30 | 2024-08-31 | 2023-08-26 | 2022-08-27 |
|---|---|---|---|---|---|
| Gelir | $20.34B | $18.94B | $18.49B | $17.46B | $16.25B |
| Brüt Kâr Marjı % | 52.3% | 52.6% | 53.1% | 52.0% | 52.1% |
| Faaliyet Kâr Marjı % | 18.3% | 19.1% | 20.5% | 19.9% | 20.1% |
| Net Gelir | $2.57B | $2.50B | $2.66B | $2.53B | $2.43B |
| Seyreltilmiş Hisse Başı Kâr | $152.55 | $144.87 | $149.55 | $132.36 | $117.19 |
| Metrik | 2026-08-29 | 2025-08-30 | 2024-08-31 | 2023-08-26 | 2022-08-27 |
|---|---|---|---|---|---|
| Borç / Öz Sermaye | -3.6 | -2.6 | -1.9 | -1.8 | -1.7 |
| Cari Oran | 0.9 | 0.9 | 0.8 | 0.8 | 0.8 |
| Cari Oran | 0.1 | 0.1 | 0.1 | 0.1 | 0.1 |
| Metrik | 2026-08-29 | 2025-08-30 | 2024-08-31 | 2023-08-26 | 2022-08-27 |
|---|---|---|---|---|---|
| Serbest Nakit Akışı | $1.82B | $1.79B | $1.93B | $2.14B | $2.54B |
Kurumsal Sahipler (13F) 1.364 dosya · $55.8B toplam · Tarih itibarıyla 30 Eylül 2026
Çeyreklik SEC Form 13F'lerinde bu hisse senedini tuttuklarını bildiren kurumlar. Yalnızca uzun pozisyonlar; tek bir başvuru sahibi, ayrı opsiyon bacakları için iki kez görünebilir. Büyük dengeleyici alım/satım bacakları genellikle piyasa yapımını veya korunmuş envanteri yansıtır, yönlü bir inancı değil.
| Yeni pozisyonlar | Çıkan pozisyonlar | Artırıldı | Azaldı | Net hisse senedi değişimi |
|---|---|---|---|---|
| 119 (-14 önceki Ç'ye göre) | 122 (-5 önceki Ç'ye göre) | 418 (+23 önceki Ç'ye göre) | 477 (-51 önceki Ç'ye göre) | +954K |
Q1 2026 ile karşılaştırıldı. SEC Form 13F başvuruları, çeyrek sonundan itibaren 45 gün içinde ve geç başvuranlar için kısa bir ek süre içinde tamamlanmalıdır — bu pencere içindeki çeyrekler, en son tam olarak raporlanan çifte tercih edilerek atlanır.
| Kurum | Değer | Hisse senetleri | % izlenen 13F'nin | Tür |
|---|---|---|---|---|
| VANGUARD GROUP INC | $6.090.899.989 | 1.795.931 | 10,91% | Hisse senetleri |
| JPMORGAN CHASE & CO | $3.953.483.903 | 1.253.632 | 7,08% | Hisse senetleri |
| BlackRock, Inc. | $3.938.565.574 | 1.232.366 | 7,06% | Hisse senetleri |
| VANGUARD CAPITAL MANAGEMENT LLC | $3.446.744.587 | 1.078.476 | 6,17% | Hisse senetleri |
| VANGUARD PORTFOLIO MANAGEMENT LLC | $2.446.191.651 | 765.406 | 4,38% | Hisse senetleri |
| STATE STREET CORP | $2.296.899.706 | 718.693 | 4,11% | Hisse senetleri |
| GEODE CAPITAL MANAGEMENT, LLC | $1.335.877.618 | 416.591 | 2,39% | Hisse senetleri |
| MORGAN STANLEY | $1.272.108.072 | 398.036 | 2,28% | Hisse senetleri |
| SUSQUEHANNA INTERNATIONAL GROUP, LLP | $1.003.205.566 | 313.900 | 1,80% | Alım opsiyonu |
| ROYAL BANK OF CANADA | $993.881.000 | 310.982 | 1,78% | Hisse senetleri |
| NORGES BANK | $906.029.814 | 283.494 | 1,62% | Hisse senetleri |
| FIRST MANHATTAN CO. LLC. | $837.786.908 | 262.141 | 1,50% | Hisse senetleri |
| FMR LLC | $785.245.353 | 245.701 | 1,41% | Hisse senetleri |
| SUSQUEHANNA INTERNATIONAL GROUP, LLP | $764.149.254 | 239.100 | 1,37% | Satım opsiyonu |
| Fiera Capital Corp | $710.505.401 | 222.315 | 1,27% | Hisse senetleri |
| PineStone Asset Management Inc. | $671.337.344 | 237.220 | 1,20% | Hisse senetleri |
| ARROWSTREET CAPITAL, LIMITED PARTNERSHIP | $646.724.027 | 202.358 | 1,16% | Hisse senetleri |
| DZ BANK AG Deutsche Zentral Genossenschafts Bank, Frankfurt am Main | $645.006.937 | 201.821 | 1,16% | Hisse senetleri |
| ALLIANCEBERNSTEIN L.P. | $606.544.577 | 179.569 | 1,09% | Hisse senetleri |
| Mitsubishi UFJ Asset Management Co., Ltd. | $572.885.029 | 179.254 | 1,03% | Hisse senetleri |
| NORTHERN TRUST CORP | $521.356.889 | 163.131 | 0,93% | Hisse senetleri |
| BROWN ADVISORY INC | $436.182.796 | 136.481 | 0,78% | Hisse senetleri |
| UBS Group AG | $435.919.824 | 136.398 | 0,78% | Hisse senetleri |
| MARSHFIELD ASSOCIATES | $435.840.725 | 136.373 | 0,78% | Hisse senetleri |
| Boston Partners | $429.669.859 | 134.458 | 0,77% | Hisse senetleri |
| CHARLES SCHWAB INVESTMENT MANAGEMENT INC | $410.745.404 | 128.521 | 0,74% | Hisse senetleri |
| Capital World Investors | $403.720.729 | 126.323 | 0,72% | Hisse senetleri |
| PARNASSUS INVESTMENTS, LLC | $379.098.159 | 133.956 | 0,68% | Hisse senetleri |
| BARCLAYS PLC | $339.249.032 | 106.150 | 0,61% | Hisse senetleri |
| Bank of New York Mellon Corp | $335.157.052 | 104.870 | 0,60% | Hisse senetleri |
| BAILLIE GIFFORD & CO | $324.141.823 | 101.423 | 0,58% | Hisse senetleri |
| SCHRODER INVESTMENT MANAGEMENT GROUP | $323.110.445 | 102.457 | 0,58% | Hisse senetleri |
| Legal & General Group Plc | $319.156.152 | 99.863 | 0,57% | Hisse senetleri |
| GOLDMAN SACHS GROUP INC | $316.051.713 | 98.892 | 0,57% | Hisse senetleri |
| Invesco Ltd. | $306.026.915 | 95.755 | 0,55% | Hisse senetleri |
| VICTORY CAPITAL MANAGEMENT INC | $305.656.505 | 95.639 | 0,55% | Hisse senetleri |
| VANGUARD FIDUCIARY TRUST CO | $296.663.131 | 92.825 | 0,53% | Hisse senetleri |
| Allspring Global Investments Holdings, LLC | $291.850.806 | 90.689 | 0,52% | Hisse senetleri |
| Amundi | $276.576.648 | 86.540 | 0,50% | Hisse senetleri |
| RENAISSANCE TECHNOLOGIES LLC | $269.289.904 | 84.260 | 0,48% | Hisse senetleri |
| BLS Capital Fondsmaeglerselskab A/S | $259.992.915 | 81.351 | 0,47% | Hisse senetleri |
| BANK OF MONTREAL /CAN/ | $257.663.074 | 80.622 | 0,46% | Hisse senetleri |
| BANK OF AMERICA CORP /DE/ | $233.576.350 | 73.085 | 0,42% | Hisse senetleri |
| DEUTSCHE BANK AG\ | $218.835.599 | 68.473 | 0,39% | Hisse senetleri |
| Holocene Advisors, LP | $218.544.769 | 68.382 | 0,39% | Hisse senetleri |
| Nuveen, LLC | $213.920.245 | 66.935 | 0,38% | Hisse senetleri |
| ENVESTNET ASSET MANAGEMENT INC | $202.181.684 | 63.262 | 0,36% | Hisse senetleri |
| WELLINGTON MANAGEMENT GROUP LLP | $201.027.821 | 62.901 | 0,36% | Hisse senetleri |
| Russell Investments Group, Ltd. | $194.976.877 | 61.007 | 0,35% | Hisse senetleri |
| RAYMOND JAMES FINANCIAL INC | $188.067.025 | 58.845 | 0,34% | Hisse senetleri |
Aktivistler ve %5+ sahipler 17 pozisyon
SEC Çizelge 13D dosyalayan yatırımcılar — ihraççı üzerinde nüfuz etme niyetiyle %5'in üzerinde faydalı sahiplik (aktivist hisseler, yönetim kurulu kampanyaları, M&A). Her satır, o başvuru sahibinin pozisyonunun bilinen en son durumunu gösterir.
| Başvuru sahibi | Dosyalandı | Hisse | Durum | Amaç | Başvuru |
|---|---|---|---|---|---|
| ESL Partners, L.P., ESL Institutional Partners, L.P., RBS Investment Management, L.L.C., Tynan, LLC, RBS Partners, L.P., ESL Investments, Inc., Edward S. Lampert, William C. Crowley ×28 başvurular | 24 Nisan 2012 | · | İlk başvuru | Pasif yatırım | SEC |
| ESL Partners, L.P. (2), ESL Institutional Partners, L.P. (2), RBS Investment Management, L.L.C. (2), Tynan, LLC (2), RBS Partners, L.P. (2), ESL Investments, Inc. (2), Edward S. Lampert (2), William C. Crowley (2) | 12 Nisan 2012 | · | İlk başvuru | Pasif yatırım | SEC |
| Açıklanmayan raporlama kişisi, Açıklanmayan raporlama kişisi, Açıklanmayan raporlama kişisi, Açıklanmayan raporlama kişisi, Açıklanmayan raporlama kişisi, Açıklanmayan raporlama kişisi, Açıklanmayan raporlama kişisi, Açıklanmayan raporlama kişisi, Açıklanmayan raporlama kişisi | 28 Eylül 2006 | · | İlk başvuru | Yönetim kurulu kampanyası | SEC |
| Açıklanmayan raporlama kişisi, Açıklanmayan raporlama kişisi, Açıklanmayan raporlama kişisi, Açıklanmayan raporlama kişisi, Açıklanmayan raporlama kişisi, Açıklanmayan raporlama kişisi, Açıklanmayan raporlama kişisi, Açıklanmayan raporlama kişisi, Açıklanmayan raporlama kişisi | 01 Kasım 2005 | · | İlk başvuru | · | SEC |
| ESL Partners, L.P., a Delaware limited partnership, ESL Institutional Partners, L.P., a Delaware limited partnership, ESL Investors, L.L.C., a Delaware limited liability company, Acres Partners, L.P., a Delaware limited partnership, ESL Investment Management, LLC, a Delaware limited liability company, Edward S. Lampert ×2 başvurular | 01 Ekim 2004 | · | İlk başvuru | · | SEC |
| Açıklanmayan raporlama kişisi, Açıklanmayan raporlama kişisi, Açıklanmayan raporlama kişisi, Açıklanmayan raporlama kişisi, Açıklanmayan raporlama kişisi, Açıklanmayan raporlama kişisi | 05 Ağustos 2004 | · | İlk başvuru | · | SEC |
| Açıklanmayan raporlama kişisi, Açıklanmayan raporlama kişisi, Açıklanmayan raporlama kişisi, Açıklanmayan raporlama kişisi, Açıklanmayan raporlama kişisi, Açıklanmayan raporlama kişisi, Açıklanmayan raporlama kişisi, Açıklanmayan raporlama kişisi, Açıklanmayan raporlama kişisi, Açıklanmayan raporlama kişisi | 03 Kasım 2003 | · | İlk başvuru | Sermaye yapısı | SEC |
| Açıklanmayan raporlama kişisi, Açıklanmayan raporlama kişisi, Açıklanmayan raporlama kişisi, Açıklanmayan raporlama kişisi, Açıklanmayan raporlama kişisi, Açıklanmayan raporlama kişisi, Açıklanmayan raporlama kişisi, Açıklanmayan raporlama kişisi, Açıklanmayan raporlama kişisi, Açıklanmayan raporlama kişisi, Açıklanmayan raporlama kişisi | 03 Temmuz 2003 | · | İlk başvuru | · | SEC |
| Açıklanmayan raporlama kişisi, Açıklanmayan raporlama kişisi, Açıklanmayan raporlama kişisi, Açıklanmayan raporlama kişisi, Açıklanmayan raporlama kişisi, Açıklanmayan raporlama kişisi, Açıklanmayan raporlama kişisi, Açıklanmayan raporlama kişisi, Açıklanmayan raporlama kişisi | 02 Ocak 2003 | · | İlk başvuru | · | SEC |
| Açıklanmayan raporlama kişisi, Açıklanmayan raporlama kişisi, Açıklanmayan raporlama kişisi, Açıklanmayan raporlama kişisi, Açıklanmayan raporlama kişisi, Açıklanmayan raporlama kişisi, Açıklanmayan raporlama kişisi, Açıklanmayan raporlama kişisi | 26 Şubat 2002 | · | İlk başvuru | Pasif yatırım | SEC |
| Açıklanmayan raporlama kişisi, Açıklanmayan raporlama kişisi, Açıklanmayan raporlama kişisi, Açıklanmayan raporlama kişisi, Açıklanmayan raporlama kişisi, Açıklanmayan raporlama kişisi, Açıklanmayan raporlama kişisi, Açıklanmayan raporlama kişisi | 27 Aralık 2001 | · | İlk başvuru | · | SEC |
| Açıklanmayan raporlama kişisi, Açıklanmayan raporlama kişisi, Açıklanmayan raporlama kişisi, Açıklanmayan raporlama kişisi, Açıklanmayan raporlama kişisi, Açıklanmayan raporlama kişisi, Açıklanmayan raporlama kişisi, Açıklanmayan raporlama kişisi | 18 Aralık 2001 | · | İlk başvuru | · | SEC |
| Açıklanmayan raporlama kişisi, Açıklanmayan raporlama kişisi, Açıklanmayan raporlama kişisi, Açıklanmayan raporlama kişisi, Açıklanmayan raporlama kişisi, Açıklanmayan raporlama kişisi, Açıklanmayan raporlama kişisi, Açıklanmayan raporlama kişisi | 06 Aralık 2001 | · | İlk başvuru | Pasif yatırım | SEC |
| Açıklanmayan raporlama kişisi, Açıklanmayan raporlama kişisi, Açıklanmayan raporlama kişisi, Açıklanmayan raporlama kişisi, Açıklanmayan raporlama kişisi, Açıklanmayan raporlama kişisi, Açıklanmayan raporlama kişisi, Açıklanmayan raporlama kişisi | 02 Nisan 2001 | · | İlk başvuru | · | SEC |
| Açıklanmayan raporlama kişisi, Açıklanmayan raporlama kişisi, Açıklanmayan raporlama kişisi, Açıklanmayan raporlama kişisi, Açıklanmayan raporlama kişisi, Açıklanmayan raporlama kişisi, Açıklanmayan raporlama kişisi, Açıklanmayan raporlama kişisi | 28 Mart 2001 | · | İlk başvuru | · | SEC |
| Açıklanmayan raporlama kişisi, Açıklanmayan raporlama kişisi, Açıklanmayan raporlama kişisi, Açıklanmayan raporlama kişisi, Açıklanmayan raporlama kişisi, Açıklanmayan raporlama kişisi, Açıklanmayan raporlama kişisi, Açıklanmayan raporlama kişisi | 14 Mart 2001 | · | İlk başvuru | · | SEC |
| Açıklanmayan raporlama kişisi, Açıklanmayan raporlama kişisi, Açıklanmayan raporlama kişisi, Açıklanmayan raporlama kişisi, Açıklanmayan raporlama kişisi, Açıklanmayan raporlama kişisi, Açıklanmayan raporlama kişisi, Açıklanmayan raporlama kişisi | 29 Ocak 2001 | · | İlk başvuru | · | SEC |
Purpose is an automated classification of the filer's own stated purpose (SEC Item 4) — not investment advice. "—" means no clear purpose was stated or the text could not be classified.
Şirket yöneticileri 75 içeriden öğrenenler · 33 yöneticiler · 11 yönetim kurulu üyeleri
| İçeriden Öğrenen | Rol | Son işlem | Sahip olunan hisse senetleri | Alımlar 12ay | Satışlar 12ay | Net 12ay |
|---|---|---|---|---|---|---|
| Philip B. Daniele | President & CEO | 09 Ekim 2026 A | 336 | 0 | 0 | $0 |
| Stephen A Odland | Chairman, President and CEO | 31 Aralık 2004 A | 79.494 | 0 | 0 | $0 |
| Jamere Jackson | CFO | 09 Ekim 2026 A | 494 | 1 | 0 | $187.742 |
| Michael G Archbold | Executive VP and CFO | 17 Haziran 2005 M | 2.628 | 0 | 0 | $0 |
| Thomas B Newbern | COO | 09 Ekim 2026 A | 1.392 | 0 | 0 | $0 |
| Grace Orians Sharpley | SVP, Finance | 09 Ekim 2026 A | · | 0 | 0 | $0 |
| Mary Denise Mccullough | SVP Supply Chain | 09 Ekim 2026 A | 137 | 0 | 0 | $0 |
| Lucas J. Rauch | SVP, Merchandising & Sourcing | 09 Ekim 2026 A | · | 0 | 0 | $0 |
| Bailey L. Childress | SVP, Merchandising Support | 09 Ekim 2026 A | 50 | 0 | 0 | $0 |
| Lindsay Lehman | SVP, Marketing | 09 Ekim 2026 A | · | 0 | 0 | $0 |
| Jenna M. Bedsole | Sr. Vice President | 09 Ekim 2026 A | 70 | 0 | 0 | $0 |
| John Scott Murphy | Vice President, Controller | 09 Ekim 2026 A | 1.260 | 0 | 0 | $0 |
| Eric Leef | SVP HR | 09 Ekim 2026 A | · | 0 | 0 | $0 |
| Dennis W. Leriche | Sr. Vice President | 09 Ekim 2026 A | 441 | 0 | 1 | $-4.510.500 |
| Michelle K. Borninkhof | Senior Vice President & CIO | 09 Ekim 2026 A | 427 | 0 | 1 | $-1.132.500 |
| Eric S. Gould | Executive Vice President | 09 Ekim 2026 A | 905 | 0 | 0 | $0 |
| Kenneth E Jaycox | SVP Commercial | 09 Ekim 2026 A | 1.703 | 0 | 0 | $0 |
| Domingo Hurtado | Sr. Vice President | 09 Ekim 2026 A | 159 | 0 | 0 | $0 |
| Preston Frazer | Senior Vice President | 31 Ekim 2023 M | 709 | 0 | 0 | $0 |
| Michael A. Womack | Sr. Vice President | 27 Ekim 2015 M | 35 | 0 | 0 | $0 |
| Larry M Roesel | Senior Vice President | 27 Ekim 2015 M | 2.274 | 0 | 0 | $0 |
| GOLDSMITH HARRY L | Exec. VP, Sec. & Gen Cnsl | 31 Aralık 2013 A | 23.526 | 0 | 0 | $0 |
| Lisa R Kranc | Senior Vice President | 01 Ekim 2012 M | 12.748 | 0 | 0 | $0 |
| Robert D Olsen | Corporate Development Officer | 26 Eylül 2012 M | 34.132 | 0 | 0 | $0 |
| Jon A. Bascom | Sr. Vice President & CIO | 20 Nisan 2012 M | 782 | 0 | 0 | $0 |
| Timothy W Briggs | Senior Vice President | 23 Ocak 2012 M | 4.398 | 0 | 0 | $0 |
| SHEA JAMES | Executive Vice President | 29 Eylül 2010 M | 3.735 | 0 | 0 | $0 |
| Bradley W Bacon | Executive Vice President | 18 Ocak 2007 M | 400 | 0 | 0 | $0 |
| Daisy L Vanderlinde | Senior Vice President | 15 Ekim 2005 A | 1.667 | 0 | 0 | $0 |
| Michael E Longo | Executive Vice President | 15 Ekim 2005 A | 3.938 | 0 | 0 | $0 |
| Stephen C Handschuh | Sr. Vice President | 28 Eylül 2004 A | · | 0 | 0 | $0 |
| Bret D Easley | Senior Vice President | 28 Eylül 2004 A | 1.622 | 0 | 0 | $0 |
| Bruce G Clark | Senior Vice President | 25 Eylül 2003 M | 1.000 | 0 | 0 | $0 |
| Brian Hannasch | Yönetim kurulu üyesi | 29 Mayıs 2026 P | 1.219 | 2 | 0 | $991.639 |
| Sue Gove | Yönetim kurulu üyesi | 01 Ocak 2017 A | 3.078 | 0 | 0 | $0 |
| Robert R Grusky | Yönetim kurulu üyesi | 11 Aralık 2012 M | 1.248 | 0 | 0 | $0 |
| William C Crowley | Yönetim kurulu üyesi | 02 Ekim 2012 M | 1.553 | 0 | 0 | $0 |
| Theodore Warren Ullyot | Yönetim kurulu üyesi | 13 Ekim 2011 M | 760 | 0 | 0 | $0 |
| Charles M Elson | Yönetim kurulu üyesi | 01 Aralık 2008 A | 0 | 0 | 0 | $0 |
| Edward S. Lampert | Yönetim kurulu üyesi | 12 Aralık 2006 M | 13.167 | 0 | 0 | $0 |
| James J Postl | Yönetim kurulu üyesi | 01 Haziran 2005 A | · | 0 | 0 | $0 |
| Marsha Johnson Evans | Yönetim kurulu üyesi | 01 Mart 2004 A | · | 0 | 0 | $0 |
| KEEGAN JAMES F | Yönetim kurulu üyesi | 01 Aralık 2003 A | 15.006 | 0 | 0 | $0 |
| ESL INVESTORS LLC | 10% sahip | 01 Ağustos 2007 J | 3.003.476 | 0 | 0 | $0 |
| Earl G Graves JR | · | 10 Nisan 2026 S | 4.837 | 0 | 2 | $-997.686 |
| Richard Craig Smith | · | 23 Ocak 2026 M | 2.627 | 0 | 2 | $-33.032.000 |
| Montesinos Constantino Spas | · | 01 Ocak 2026 A | 132 | 0 | 0 | $0 |
| Claire Mcdonough | · | 01 Ocak 2026 A | 143 | 0 | 0 | $0 |
| Jill A. Soltau | · | 01 Ocak 2026 A | 1.254 | 0 | 0 | $0 |
| Gale V. King | · | 01 Ocak 2026 A | 1.336 | 0 | 0 | $0 |
| Michael A George | · | 01 Ocak 2026 A | 653 | 1 | 0 | $492.729 |
| Linda Goodspeed | · | 01 Ocak 2026 A | 2.987 | 0 | 0 | $0 |
| William C Rhodes III | · | 01 Ocak 2026 A | 10.202 | 0 | 0 | $0 |
| William R. Hackney | · | 30 Eylül 2025 A | 99 | 0 | 0 | $0 |
| George R Mrkonic JR | · | 31 Aralık 2024 S | 3.228 | 0 | 3 | $-1.400.046 |
| Enderson Guimaraes | · | 18 Aralık 2024 F | 2.295 | 0 | 0 | $0 |
| Grant E. Mcgee | · | 16 Ocak 2024 M | 251 | 0 | 0 | $0 |
| Bryan D Jordan | · | 01 Ocak 2024 A | 3.098 | 0 | 0 | $0 |
| Albert Saltiel | · | 31 Aralık 2023 A | 538 | 0 | 0 | $0 |
| Charles Pleas III | · | 06 Aralık 2023 M | 3.416 | 0 | 0 | $0 |
| Kristen C. Wright | · | 31 Aralık 2022 A | 208 | 0 | 0 | $0 |
| Seong K. Ohm | · | 30 Haziran 2022 A | 95 | 0 | 0 | $0 |
| Douglas H Brooks | · | 01 Ocak 2022 A | 2.349 | 0 | 0 | $0 |
| Mark A. Finestone | · | 31 Aralık 2021 A | 227 | 0 | 0 | $0 |
| Ronald B Griffin | · | 30 Eylül 2021 A | 506 | 0 | 0 | $0 |
| Mitchell C. Major | · | 08 Ocak 2021 M | 592 | 0 | 0 | $0 |
| Michael M Calbert | · | 01 Ocak 2021 A | 2.535 | 0 | 0 | $0 |
| William T Giles | · | 31 Aralık 2020 A | 5.512 | 0 | 0 | $0 |
| Luis P Nieto Jr | · | 01 Ocak 2019 A | 2.922 | 0 | 0 | $0 |
| William Andrew Mckenna | · | 01 Ocak 2019 A | 5.554 | 0 | 0 | $0 |
| William W Graves | · | 06 Aralık 2018 G | 3.457 | 0 | 0 | $0 |
| Rodney C. Halsell | · | 02 Kasım 2018 M | 377 | 0 | 0 | $0 |
| James C. Griffith | · | 19 Ocak 2018 M | 103 | 0 | 0 | $0 |
| HYDE JOSEPH R III | · | 01 Ocak 2018 A | 71.930 | 0 | 0 | $0 |
| Gerry N House | · | 11 Aralık 2008 M | 1.113 | 0 | 0 | $0 |
SEC Form 3/4/5 başvurularından yöneticiler; net = yalnızca açık piyasa Alış/Satış
ETF sahipliği 137 ETF'ler tarafından tutuluyor
Ağırlık yalnızca doğrudan öz sermaye varlıklarını (N-PORT) yansıtır; kaldıraçlı veya türev tabanlı fonlar gösterilmeyen ek swap pozisyonlarına sahip olabilir.
| Fon | Ağırlık | Birimler | Tarih itibarıyla | Kaynak |
|---|---|---|---|---|
| RSPD · Invesco Exchange-Traded Fund Trust | 2,32% | 1.898 SH | 23 Ekim 2026 | Günlük |
| SAWG · ETF Series Solutions | 2,20% | 21 NS | 31 Temmuz 2026 | N-PORT |
| POWA · Invesco Exchange-Traded Self-Indexe… | 2,12% | 1.094 SH | 23 Ekim 2026 | Günlük |
| YOKE · EA Series Trust | 1,65% | 1.279 NS | 31 Temmuz 2026 | N-PORT |
| QIDX · Spinnaker ETF Series | 1,23% | 158 NS | 31 Temmuz 2026 | N-PORT |
| RGEF · Tidal Trust III | 1,20% | 3.235 NS | 31 Temmuz 2026 | N-PORT |
| VOT · VANGUARD INDEX FUNDS | 1,15% | 126.198 SH | 19 Ağustos 2026 | Günlük |
| JGLO · J.P. Morgan Exchange-Traded Fund Tr… | 1,12% | 24.639 NS | 31 Temmuz 2026 | N-PORT |
| FMAG · FIDELITY COVINGTON TRUST | 1,08% | 878 NS | 31 Temmuz 2026 | N-PORT |
| RETL · Direxion Shares ETF Trust | 0,93% | 86 NS | 31 Temmuz 2026 | N-PORT |
| IYC · iShares Trust | 0,82% | 3.297 SH | 11 Eylül 2026 | Günlük |
| VCR · VANGUARD WORLD FUND | 0,81% | 17.440 SH | 19 Ağustos 2026 | Günlük |
| FDIS · FIDELITY COVINGTON TRUST | 0,78% | 4.359 NS | 31 Temmuz 2026 | N-PORT |
| RXI · iShares Trust | 0,76% | 652 SH | 11 Eylül 2026 | Günlük |
| ESUM · Strategy Shares | 0,74% | 448 NS | 31 Temmuz 2026 | N-PORT |
| FLRG · FIDELITY COVINGTON TRUST | 0,73% | 703 NS | 31 Temmuz 2026 | N-PORT |
| FQAL · FIDELITY COVINGTON TRUST | 0,71% | 3.347 NS | 31 Temmuz 2026 | N-PORT |
| USMV · iShares Trust | 0,71% | 58.323 SH | 11 Eylül 2026 | Günlük |
| WANT · Direxion Shares ETF Trust | 0,68% | 46 NS | 31 Temmuz 2026 | N-PORT |
| IMCG · iShares Trust | 0,66% | 9.166 SH | 11 Eylül 2026 | Günlük |
| NULG · Nushares ETF Trust | 0,61% | 5.426 NS | 31 Temmuz 2026 | N-PORT |
| VO · VANGUARD INDEX FUNDS | 0,51% | 357.077 SH | 19 Ağustos 2026 | Günlük |
| QLV · FlexShares Trust | 0,46% | 252 NS | 31 Temmuz 2026 | N-PORT |
| FDLO · FIDELITY COVINGTON TRUST | 0,46% | 2.147 NS | 31 Temmuz 2026 | N-PORT |
| JOYT · J.P. Morgan Exchange-Traded Fund Tr… | 0,40% | 130 NS | 31 Temmuz 2026 | N-PORT |
| ACWV · iShares, Inc. | 0,40% | 4.634 SH | 11 Eylül 2026 | Günlük |
| LCOW · Pacer Funds Trust | 0,34% | 29 NS | 31 Temmuz 2026 | N-PORT |
| IMCB · iShares Trust | 0,33% | 1.941 SH | 11 Eylül 2026 | Günlük |
| HELO · J.P. Morgan Exchange-Traded Fund Tr… | 0,33% | 5.061 NS | 31 Temmuz 2026 | N-PORT |
| HUSV · First Trust Exchange-Traded Fund III | 0,30% | 73 NS | 31 Temmuz 2026 | N-PORT |
| GLBL · Pacer Funds Trust | 0,27% | 1 NS | 31 Temmuz 2026 | N-PORT |
| XOEF · iShares Trust | 0,26% | 20 SH | 11 Eylül 2026 | Günlük |
| SNPG · DBX ETF Trust | 0,25% | 12 NS | 31 Ağustos 2026 | N-PORT |
| JPUS · J.P. Morgan Exchange-Traded Fund Tr… | 0,25% | 376 NS | 31 Temmuz 2026 | N-PORT |
| ACVF · ETF Opportunities Trust | 0,23% | 114 NS | 31 Temmuz 2026 | N-PORT |
| RSP · Invesco Exchange-Traded Fund Trust | 0,22% | 67.571 SH | 23 Ekim 2026 | Günlük |
| VFVA · VANGUARD WELLINGTON FUND | 0,22% | 592 SH | 19 Ağustos 2026 | Günlük |
| EUSA · iShares, Inc. | 0,19% | 1.270 SH | 11 Eylül 2026 | Günlük |
| USXF · iShares Trust | 0,19% | 968 SH | 11 Eylül 2026 | Günlük |
| ROUS · Lattice Strategies Trust | 0,19% | 439 NS | 31 Temmuz 2026 | N-PORT |
| FTC · First Trust Exchange-Traded AlphaDE… | 0,18% | 783 NS | 31 Temmuz 2026 | N-PORT |
| PFIG · Invesco Exchange-Traded Fund Trust … | 0,18% | 235.000 | 23 Ekim 2026 | Günlük |
| MNZL · EA Series Trust | 0,17% | 14 NS | 31 Temmuz 2026 | N-PORT |
| SIZE · iShares Trust | 0,16% | 239 SH | 11 Eylül 2026 | Günlük |
| VUG · VANGUARD INDEX FUNDS | 0,16% | 192.961 SH | 19 Ağustos 2026 | Günlük |
| IWX · iShares Trust | 0,15% | 2.053 SH | 11 Eylül 2026 | Günlük |
| ILCG · iShares Trust | 0,15% | 1.611 SH | 11 Eylül 2026 | Günlük |
| BSCT · Invesco Exchange-Traded Self-Indexe… | 0,14% | 4.398.000 | 22 Ekim 2026 | Günlük |
| HQGO · Lattice Strategies Trust | 0,14% | 23 NS | 31 Temmuz 2026 | N-PORT |
| BSCR · Invesco Exchange-Traded Self-Indexe… | 0,14% | 6.253.000 | 23 Ekim 2026 | Günlük |
| SUSL · iShares Trust | 0,14% | 578 SH | 11 Eylül 2026 | Günlük |
| USSG · DBX ETF Trust | 0,14% | 272 NS | 31 Ağustos 2026 | N-PORT |
| BSCU · Invesco Exchange-Traded Self-Indexe… | 0,14% | 3.781.000 | 22 Ekim 2026 | Günlük |
| VONV · VANGUARD SCOTTSDALE FUNDS | 0,13% | 8.589 SH | 19 Ağustos 2026 | Günlük |
| PEVC · Pacer Funds Trust | 0,13% | 1 NS | 31 Temmuz 2026 | N-PORT |
| BSCS · Invesco Exchange-Traded Self-Indexe… | 0,12% | 4.066.000 | 22 Ekim 2026 | Günlük |
| SNPE · DBX ETF Trust | 0,12% | 1.184 NS | 31 Ağustos 2026 | N-PORT |
| DEUS · DBX ETF Trust | 0,12% | 119 NS | 31 Ağustos 2026 | N-PORT |
| HEQQ · J.P. Morgan Exchange-Traded Fund Tr… | 0,11% | 11 NS | 31 Temmuz 2026 | N-PORT |
| IWD · iShares Trust | 0,11% | 31.618 SH | 11 Eylül 2026 | Günlük |
| RWL · Invesco Exchange-Traded Fund Trust … | 0,11% | 3.494 SH | 23 Ekim 2026 | Günlük |
| VOOG · VANGUARD ADMIRAL FUNDS | 0,10% | 7.946 SH | 19 Ağustos 2026 | Günlük |
| TOPC · iShares Trust | 0,10% | 11 SH | 11 Eylül 2026 | Günlük |
| LGDX · Tidal Trust III | 0,09% | 43 NS | 31 Temmuz 2026 | N-PORT |
| ESGV · VANGUARD WORLD FUND | 0,09% | 3.721 SH | 19 Ağustos 2026 | Günlük |
| FAD · First Trust Exchange-Traded AlphaDE… | 0,09% | 171 NS | 31 Temmuz 2026 | N-PORT |
| PBUS · Invesco Exchange-Traded Fund Trust … | 0,09% | 2.836 SH | 23 Ekim 2026 | Günlük |
| IVW · iShares Trust | 0,09% | 22.833 SH | 11 Eylül 2026 | Günlük |
| IWL · iShares Trust | 0,08% | 645 SH | 11 Eylül 2026 | Günlük |
| SPXD · DBX ETF Trust | 0,08% | 2 NS | 31 Ağustos 2026 | N-PORT |
| GLOF · iShares Trust | 0,08% | 58 SH | 11 Eylül 2026 | Günlük |
| IUSG · iShares Trust | 0,08% | 9.455 SH | 11 Eylül 2026 | Günlük |
| XVV · iShares Trust | 0,08% | 191 SH | 11 Eylül 2026 | Günlük |
| PBP · Invesco Exchange-Traded Fund Trust | 0,08% | 98 SH | 23 Ekim 2026 | Günlük |
| QARP · DBX ETF Trust | 0,08% | 21 NS | 31 Ağustos 2026 | N-PORT |
| VOO · VANGUARD INDEX FUNDS | 0,08% | 429.576 SH | 19 Ağustos 2026 | Günlük |
| VV · VANGUARD INDEX FUNDS | 0,08% | 19.242 SH | 19 Ağustos 2026 | Günlük |
| VONE · VANGUARD SCOTTSDALE FUNDS | 0,08% | 2.711 SH | 19 Ağustos 2026 | Günlük |
| TOV · EA Series Trust | 0,08% | 70 NS | 31 Temmuz 2026 | N-PORT |
| BBUS · J.P. Morgan Exchange-Traded Fund Tr… | 0,08% | 2.299 NS | 31 Temmuz 2026 | N-PORT |
| DFAU · Dimensional ETF Trust | 0,08% | 3.208 NS | 31 Temmuz 2026 | N-PORT |
| PTLC · Pacer Funds Trust | 0,08% | 840 NS | 31 Temmuz 2026 | N-PORT |
| VOTE · TCW ETF Trust | 0,08% | 280 NS | 31 Temmuz 2026 | N-PORT |
| BKLC · BNY Mellon ETF Trust | 0,08% | 1.377 NS | 31 Temmuz 2026 | N-PORT |
| DFSU · Dimensional ETF Trust | 0,08% | 569 NS | 31 Temmuz 2026 | N-PORT |
| IQSU · New York Life Investments ETF Trust | 0,07% | 80 NS | 31 Temmuz 2026 | N-PORT |
| IUS · Invesco Exchange-Traded Self-Indexe… | 0,07% | 225 SH | 23 Ekim 2026 | Günlük |
| IVV · iShares Trust | 0,07% | 207.411 SH | 11 Eylül 2026 | Günlük |
| DFUS · Dimensional ETF Trust | 0,07% | 4.998 NS | 31 Temmuz 2026 | N-PORT |
| ILCB · iShares Trust | 0,07% | 322 SH | 11 Eylül 2026 | Günlük |
| SPUU · Direxion Shares ETF Trust | 0,07% | 62 NS | 31 Temmuz 2026 | N-PORT |
| VTI · VANGUARD INDEX FUNDS | 0,07% | 523.176 SH | 19 Ağustos 2026 | Günlük |
| VTHR · VANGUARD SCOTTSDALE FUNDS | 0,07% | 1.386 SH | 19 Ağustos 2026 | Günlük |
| QDPL · Pacer Funds Trust | 0,07% | 394 NS | 31 Temmuz 2026 | N-PORT |
| EQAL · Invesco Exchange-Traded Fund Trust … | 0,07% | 173 SH | 23 Ekim 2026 | Günlük |
| PHDG · Invesco Actively Managed Exchange-T… | 0,07% | 13 SH | 23 Ekim 2026 | Günlük |
| IYY · iShares Trust | 0,07% | 712 SH | 11 Eylül 2026 | Günlük |
| IWB · iShares Trust | 0,07% | 11.438 SH | 11 Eylül 2026 | Günlük |
| IWV · iShares Trust | 0,06% | 4.522 SH | 11 Eylül 2026 | Günlük |
| ITOT · iShares Trust | 0,06% | 21.359 SH | 11 Eylül 2026 | Günlük |
| HCMT · Direxion Shares ETF Trust | 0,06% | 116 NS | 31 Temmuz 2026 | N-PORT |
| VOOV · VANGUARD ADMIRAL FUNDS | 0,06% | 1.323 SH | 19 Ağustos 2026 | Günlük |
| KOKU · DBX ETF Trust | 0,06% | 157 NS | 31 Ağustos 2026 | N-PORT |
| SPXL · Direxion Shares ETF Trust | 0,06% | 1.285 NS | 31 Temmuz 2026 | N-PORT |
| IVE · iShares Trust | 0,06% | 9.609 SH | 11 Eylül 2026 | Günlük |
| TOK · iShares Trust | 0,06% | 46 SH | 11 Eylül 2026 | Günlük |
| URTH · iShares, Inc. | 0,05% | 1.525 SH | 11 Eylül 2026 | Günlük |
| IUSV · iShares Trust | 0,05% | 5.081 SH | 11 Eylül 2026 | Günlük |
| TILT · FlexShares Trust | 0,05% | 384 NS | 31 Temmuz 2026 | N-PORT |
| DFAC · Dimensional ETF Trust | 0,05% | 8.124 NS | 31 Temmuz 2026 | N-PORT |
| VT · VANGUARD INTERNATIONAL EQUITY INDEX… | 0,05% | 13.933 SH | 19 Ağustos 2026 | Günlük |
| DCOR · Dimensional ETF Trust | 0,05% | 520 NS | 31 Temmuz 2026 | N-PORT |
| ACWI · iShares Trust | 0,05% | 5.335 SH | 11 Eylül 2026 | Günlük |
| OMFL · Invesco Exchange-Traded Self-Indexe… | 0,03% | 439 SH | 23 Ekim 2026 | Günlük |
| NULC · Nushares ETF Trust | 0,03% | 6 NS | 31 Temmuz 2026 | N-PORT |
| PRF · Invesco Exchange-Traded Fund Trust | 0,02% | 728 SH | 23 Ekim 2026 | Günlük |
| IWY · iShares Trust | 0,02% | 1.235 SH | 11 Eylül 2026 | Günlük |
| LRGF · iShares Trust | 0,02% | 261 SH | 11 Eylül 2026 | Günlük |
| VONG · VANGUARD SCOTTSDALE FUNDS | 0,02% | 3.527 SH | 19 Ağustos 2026 | Günlük |
| IWF · iShares Trust | 0,02% | 8.524 SH | 10 Eylül 2026 | Günlük |
| DXUV · Dimensional ETF Trust | 0,00% | 9 NS | 31 Temmuz 2026 | N-PORT |
| GTO · Invesco Actively Managed Exchange-T… | 0,00% | 1.000 | 20 Ekim 2026 | Günlük |
| FTLS · First Trust Exchange-Traded Fund III | -0,43% | -3.531 NS | 31 Temmuz 2026 | N-PORT |
| CLSE · Trust for Professional Managers | -0,46% | -1.379 NS | 31 Ağustos 2026 | N-PORT |
| LSEQ · Harbor ETF Trust | -1,48% | -75 NS | 31 Temmuz 2026 | N-PORT |
| BIV · VANGUARD BOND INDEX FUNDS | · | · | 15 Temmuz 2026 | Günlük |
| BSV · VANGUARD BOND INDEX FUNDS | · | · | 15 Temmuz 2026 | Günlük |
| BND · VANGUARD BOND INDEX FUNDS | · | · | 15 Temmuz 2026 | Günlük |
| VUSB · VANGUARD BOND INDEX FUNDS | · | · | 15 Temmuz 2026 | Günlük |
| VCRB · VANGUARD MALVERN FUNDS | · | · | 15 Temmuz 2026 | Günlük |
| VPLS · VANGUARD MALVERN FUNDS | · | · | 15 Temmuz 2026 | Günlük |
| VSDB · VANGUARD MALVERN FUNDS | · | · | 15 Temmuz 2026 | Günlük |
| VCSH · VANGUARD SCOTTSDALE FUNDS | · | · | 15 Temmuz 2026 | Günlük |
| VCIT · VANGUARD SCOTTSDALE FUNDS | · | · | 15 Temmuz 2026 | Günlük |
| VTC · VANGUARD SCOTTSDALE FUNDS | · | · | 30 Temmuz 2026 | Günlük |
| BNDW · VANGUARD SCOTTSDALE FUNDS | · | · | 30 Temmuz 2026 | Günlük |
| VCEB · VANGUARD WORLD FUND | · | · | 30 Temmuz 2026 | Günlük |
AZO Analist Uzlaşması Boğa ve ayı analist görüşleri, 12 aylık fiyat hedefi, yukarı yönlü potansiyel
12 Aylık Fiyat Hedefi
23 analist · 2026-10-27Ortalama hedef $3665.61 +16,5%
Akran karşılaştırması (GICS alt sektörü) Anahtar metrikler sektördeki benzerlerine karşı
Mali yıl bazında, fiyatlar her şirketin son mali yıl kapanışına göredir.
| Hisse Sembolü | Piyasa Değeri | P/E | Gelir YoY | Net Kar Marjı | ROE | Brüt Kar Marjı |
|---|---|---|---|---|---|---|
| AZO | $47.90B | 19.4 | 7.4% | 12.7% | -95.1% | 52.3% |
| ORLY | $76.79B | 30.7 | 6.4% | 14.3% | -254.4% | 51.6% |
| CVNA | · | 49.9 | 48.6% | 6.9% | 59.9% | 20.6% |
| PAG | $10.41B | 11.2 | -0.18% | 2.9% | 17.1% | 16.4% |
| MUSA | · | 16.7 | -4.2% | 2.4% | 74.1% | · |
| KMX | $6.12B | 25.7 | -1.8% | 0.96% | 4.1% | 10.8% |
| LAD | $7.81B | 10.3 | 4.0% | 2.2% | 12.4% | 15.2% |
| AN | $7.27B | 12.1 | 3.2% | 2.4% | 27.0% | 17.9% |
| VVV | $4.56B | 21.9 | 5.6% | 12.3% | 71.8% | 38.5% |
| ABG | · | 9.3 | 4.7% | 2.7% | 12.8% | 17.1% |
| GPI | $9.81B | 15.6 | 13.2% | 1.4% | 11.0% | 16.1% |
Son Haberler Bu şirketten bahseden son manşetler
Metriklerim Kişisel izleme listeniz — Tam Temeller'den seçilen satırlar
Sizin için önemli olan metrikleri seçin — Yukarıdaki Tam Temeller bölümündeki herhangi bir satırın yanındaki + işaretine tıklayın.
Seçiminiz kaydedildi ve tüm hisse senetlerinde sizinle birlikte gelir.