
VMRK Vivmark Residential Common Shares of Beneficial Interest
NYSE · SEC EDGAR'da Görüntüle ↗ 10-K/10-Q Nis 30, 2025VMRK Hisse Senedi Özeti Fiyat, piyasa değeri, P/E, EPS, ROE, borç/öz sermaye, 52 haftalık aralık
VMRK Hisse Senedi Fiyat Grafiği Teknik göstergeler ile günlük OHLCV — kaydır, yakınlaştır ve görünümünüzü özelleştirin
Çubuk çözünürlüğü seçilen döneme uyum sağlar — bir çubuk için açılış/yüksek/düşük/kapanış değerlerini görmek için grafiğin üzerine gelin.
| Ex-tarihi | Bölünme | Tür |
|---|---|---|
| 12 Ekim 2001 | 2-for-1 | İleri |
Vivmark Residential Common Shares of Beneficial Interest Hakkında Wikipedia'dan şirket genel bakışı
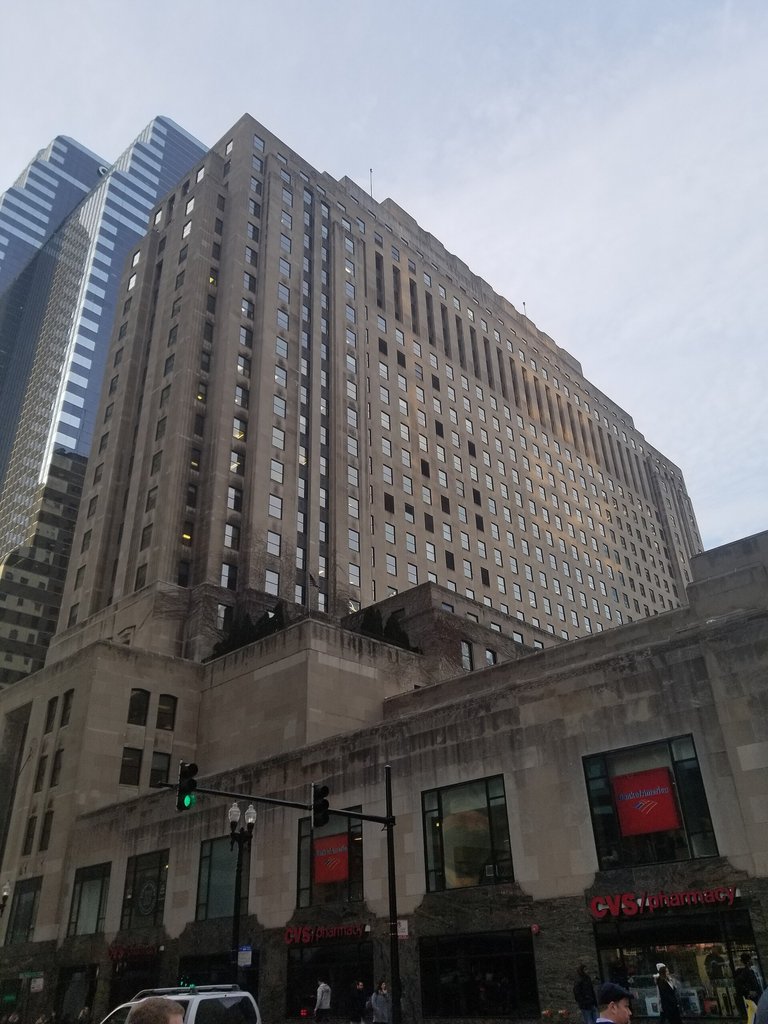
Vivmark Residential (formerly Equity Residential), based in Arlington, Virginia, and Chicago, Illinois, is a real estate investment trust that invests in apartments. As of August 2026, the company owned or had investments in 184,000 rental apartments and had over 11,100 apartments under construction.
It is the largest owner of apartments in the United States and the 18th largest apartment property manager in the United States.
History
The company had its origins in Equity Finance and Management Company, founded in 1969 by Sam Zell. In 1993, the company acquired a large portfolio of properties from Starwood Capital Group, owned by Barry Sternlicht and Bob Faith, in exchange for a 20% stake in the company. Starwood had acquired the properties via government auctions after the savings and loan crisis. In August 1993, the company became a public company via an initial public offering. At that time, the company owned 22,000 apartments.
In 1997, the company acquired Wellsford Residential Property Trust for $620 million in stock and the assumption of $346 million of debt. It also acquired Evans Withycombe Residential for $625 million in stock and the assumption of $432 million in debt.
In 1998, the company acquired a portfolio of 5,774 apartments from Lincoln Property Company for $465 million. It also acquired Merry Land, which owned 34,990 units in the southeast United States, for $1.17 billion in stock as well as $656 million in debt and $270 million in preferred stock.
In 1999, the company acquired Lexford Residential Trust for $203 million in stock and the assumption of $530 million of debt. Lexford owned mainly one-story affordable housing units, rented to households with incomes between $25,000 and $35,000.
In January 2003, CEO Douglas Crocker retired. During his tenure, the company increased its ownership from 22,000 apartments to 227,000 apartments. In 2006, the company sold its Lexford affordable housing division, which included 27,115 apartment units, for $1.09 billion.
In February 2013, the company and AvalonBay Communities closed a $9 billion deal to acquire Archstone from Lehman Brothers. In 2013, the company sold 8,010 apartment units to a joint venture of Goldman Sachs and Greystar Real Estate Partners for $1.5 billion. In 2016, the company sold 23,262 apartments to Starwood Capital Group for $5.365 billion.
In August 2026, the company acquired AvalonBay Communities and changed its name to Vivmark Residential.
Legal issues
In 2022, the company agreed to pay approximately $2 million to settle a lawsuit filed by Attorney General for the District of Columbia Karl Racine alleging that the company offered misleading rent discounts on a rent-controlled building in Washington, D.C.
The company was sued in a class action due to allegations that the late payment fees that it charged, including a $50 minimum fee even if rent was just one day late, and compounding fees and penalties, were in violation of California law. In a settlement finalized in 2026, the company agreed to pay $43 million to over 200,000 tenants in California as reimbursement of excessive fees.
In a multi-district class action lawsuit, the company and 10 other large landlords were accused of engaging in an unlawful conspiracy to use RealPage's revenue management software to share competitively sensitive data and coordinate rent increases. In 2026, as part of a settlement with all of the defendants, the company agreed to pay $56 million to settle the allegations.
Kaynak: Wikipedia (İngilizce), CC BY-SA 4.0 · Wikipedia'da Görüntüle ↗
10 Yıllık Performans Gelir, net kar, marjlar ve EPS trendleri
Değerleme P/E, P/S, P/B, EV/EBITDA oranları — hisse senedi pahalı mı ucuz mu?
Bu oran grubunu hesaplamak için henüz yeterli temel veriye sahip değil.
Kârlılık Brüt, faaliyet ve net kâr marjları; ROE, ROA, ROIC
Bu oran grubunu hesaplamak için henüz yeterli temel veriye sahip değil.
Finansal Sağlık Borç, likidite, solventlik — bilanço gücü
Bu oran grubunu hesaplamak için henüz yeterli temel veriye sahip değil.
Büyüme Gelir, EPS ve net gelir büyümesi: YOY, 3 Yıllık CAGR, 5 Yıllık CAGR
Bu oran grubunu hesaplamak için henüz yeterli temel veriye sahip değil.
Sermaye Verimliliği Aktif devir hızı, stok devir hızı, alacak devir hızı
Bu oran grubunu hesaplamak için henüz yeterli temel veriye sahip değil.
değer · ≈ 5Y ort. · sektör ortalaması · ortalamaya göre değerlendirme
Temettüler Temettü verimi, ödeme oranı, temettü geçmişi, 5 Yıllık CAGR
| Ex-tarihi | Miktar | Para Birimi | Temettü Verimi |
|---|---|---|---|
| Eki 5, 2026 | $0,70 | USD | ≈4.7% |
| Haz 29, 2026 | $0,70 | USD | ≈4.1% |
| Mar 30, 2026 | $0,70 | USD | ≈4.7% |
| Oca 2, 2026 | $0,69 | USD | ≈4.5% |
| Eyl 25, 2025 | $0,69 | USD | ≈4.3% |
| Haz 24, 2025 | $0,69 | USD | ≈4.1% |
| Mar 31, 2025 | $0,69 | USD | ≈3.8% |
| Oca 2, 2025 | $0,68 | USD | ≈3.9% |
| Eyl 24, 2024 | $0,68 | USD | ≈3.6% |
| Tem 1, 2024 | $0,68 | USD | ≈3.9% |
| Mar 22, 2024 | $0,68 | USD | ≈4.3% |
| Ara 29, 2023 | $0,66 | USD | ≈4.3% |
| Eyl 25, 2023 | $0,66 | USD | ≈4.4% |
| Haz 23, 2023 | $0,66 | USD | ≈4.1% |
| Mar 24, 2023 | $0,66 | USD | ≈4.5% |
| Ara 30, 2022 | $0,63 | USD | ≈4.2% |
| Eyl 23, 2022 | $0,63 | USD | ≈3.6% |
| Haz 24, 2022 | $0,63 | USD | ≈3.4% |
| Mar 25, 2022 | $0,63 | USD | ≈2.7% |
| Ara 31, 2021 | $0,60 | USD | ≈2.7% |
Kazanç Geçmişi EPS gerçekleşen vs tahmin, sürpriz %, kazanma oranı, bir sonraki kazanç tarihi
| Dönem | Rapor | EPS Gerçek | EPS Tahmin | Sürpriz |
|---|---|---|---|---|
| 30 Haziran 2026 | $0.31 | $0.44 | -29.7% | |
| 31 Mart 2026 | $0.24 | $0.32 | -24.7% | |
| 31 Aralık 2025 | $1.00 | $0.40 | 153.2% | |
| 30 Eylül 2025 | $0.76 | $0.45 | 70.1% |
Tüm Temeller Tüm metrikler yıla göre — gelir tablosu, bilanço, nakit akışı
Bu hisse senedi için henüz SEC dosyası bulunmuyor.
Hisse Başına
| Metrik | Eğilim | Q4 2025 |
|---|---|---|
| EPS (TTM) | $2.29 |
Değerleme (TTM)
| Metrik | Eğilim | Q4 2025 |
|---|---|---|
| Revenue TTM | $2.70B | |
| Net Income TTM | $873M |
En son dönem solda · null değerler · olarak gösterilir
Şirket yöneticileri 31 içeriden öğrenenler · 15 yöneticiler · 17 yönetim kurulu üyeleri
| İçeriden Öğrenen | Rol | Son işlem | Sahip olunan hisse senetleri | Alımlar 12ay | Satışlar 12ay | Net 12ay |
|---|---|---|---|---|---|---|
| Benjamin Schall | President & CEO | 17 Ağustos 2026 A | · | 0 | 0 | $0 |
| Kevin P. O'Shea | Executive Vice President & CFO | 17 Ağustos 2026 A | · | 0 | 0 | $0 |
| Michael L Manelis | Executive Vice President & COO | 17 Ağustos 2026 A | 44.713 | 0 | 1 | $-503.226 |
| Sean Thomas Willson | Senior Vice President & CAO | 21 Ağustos 2026 S | 17.988 | 0 | 2 | $-35.973 |
| Matthew H. Birenbaum | Executive Vice President & CDO | 20 Ağustos 2026 G | 272.749 | 0 | 0 | $0 |
| Pamela Rogers Thomas | EVP, Portfolio & Asset Mgmt | 17 Ağustos 2026 A | 85.543 | 0 | 0 | $0 |
| Alaine Susan Walsh | EVP, Human Capital & Admin | 17 Ağustos 2026 A | · | 0 | 0 | $0 |
| Scott Fenster | EVP & General Counsel | 17 Ağustos 2026 A | · | 0 | 0 | $0 |
| Sean J. Breslin | EVP & CI & GO | 17 Ağustos 2026 A | · | 0 | 0 | $0 |
| Edward M Schulman | EVP, Legal Affairs | 17 Ağustos 2026 A | 48.776 | 0 | 1 | $-1.066.893 |
| Ian Kaufman | Chief Accounting Officer | 14 Ağustos 2026 A | 29.657 | 0 | 0 | $0 |
| Christa L Sorenson | Executive Vice President | 10 Şubat 2020 S | 3.939 | 0 | 0 | $0 |
| Bruce C Strohm | EVP & General Counsel | 22 Aralık 2014 M | 2.179 | 0 | 0 | $0 |
| Gregory H Smith | Executive Vice President | 08 Şubat 2006 S | 46.064 | 0 | 0 | $0 |
| Edward J Geraghty | Executive Vice President | 19 Ağustos 2003 S | 78.797 | 0 | 0 | $0 |
| Ann Hoff | Yönetim kurulu üyesi | 17 Ağustos 2026 A | 6.330 | 0 | 0 | $0 |
| Nina P Jones | Yönetim kurulu üyesi | 17 Ağustos 2026 A | 3.404 | 0 | 0 | $0 |
| Christopher B. Howard | Yönetim kurulu üyesi | 17 Ağustos 2026 A | 12.730 | 0 | 1 | $-543.104 |
| Chris Carr | Yönetim kurulu üyesi | 17 Ağustos 2026 A | 5.591 | 0 | 0 | $0 |
| Susan Swanezy | Yönetim kurulu üyesi | 17 Ağustos 2026 A | 28.934 | 0 | 1 | $-1.001.660 |
| Terry S. Brown | Yönetim kurulu üyesi | 17 Ağustos 2026 A | · | 0 | 0 | $0 |
| Conor C Flynn | Yönetim kurulu üyesi | 17 Ağustos 2026 A | · | 0 | 0 | $0 |
| Angela M Aman | Yönetim kurulu üyesi | 17 Ağustos 2026 A | · | 0 | 0 | $0 |
| Stephen E Sterrett | Yönetim kurulu üyesi | 17 Ağustos 2026 A | 20.773 | 0 | 0 | $0 |
| David J Neithercut | Yönetim kurulu üyesi | 17 Ağustos 2026 A | · | 0 | 0 | $0 |
| Timothy J Naughton | Yönetim kurulu üyesi | 17 Ağustos 2026 A | 314.301 | 0 | 0 | $0 |
| Charles E Mueller JR | Yönetim kurulu üyesi | 17 Ağustos 2026 A | 16.084 | 0 | 1 | $-511.200 |
| Mary Kay Haben | Yönetim kurulu üyesi | 17 Ağustos 2026 A | 9.477 | 0 | 0 | $0 |
| Gerald A Spector | Yönetim kurulu üyesi | 28 Şubat 2013 A | 282.191 | 0 | 0 | $0 |
| Stephen O Evans | Yönetim kurulu üyesi | 28 Şubat 2006 A | 7.644 | 0 | 0 | $0 |
| Michael N Thompson | Yönetim kurulu üyesi | 27 Şubat 2004 A | 12.777 | 0 | 0 | $0 |
SEC Form 3/4/5 başvurularından yöneticiler; net = yalnızca açık piyasa Alış/Satış
ETF sahipliği 59 ETF'ler tarafından tutuluyor
Ağırlık yalnızca doğrudan öz sermaye varlıklarını (N-PORT) yansıtır; kaldıraçlı veya türev tabanlı fonlar gösterilmeyen ek swap pozisyonlarına sahip olabilir.
| Fon | Ağırlık | Birimler | Tarih itibarıyla | Kaynak |
|---|---|---|---|---|
| REZ · iShares Trust | 8,65% | 1.095.687 SH | 11 Eylül 2026 | Günlük |
| ICF · iShares Trust | 4,77% | 1.448.479 SH | 11 Eylül 2026 | Günlük |
| USRT · iShares Trust | 4,28% | 2.912.473 SH | 11 Eylül 2026 | Günlük |
| IYR · iShares Trust | 3,59% | 2.258.051 SH | 11 Eylül 2026 | Günlük |
| RSPR · Invesco Exchange-Traded Fund Trust | 3,27% | 43.465 | 28 Ekim 2026 | Günlük |
| REET · iShares Trust | 2,78% | 2.075.131 SH | 11 Eylül 2026 | Günlük |
| ERET · iShares Trust | 2,73% | 5.650 SH | 11 Eylül 2026 | Günlük |
| SPHD · Invesco Exchange-Traded Fund Trust … | 1,75% | 936.925 | 28 Ekim 2026 | Günlük |
| PABU · iShares Trust | 1,44% | 554.426 SH | 11 Eylül 2026 | Günlük |
| IIGD · Invesco Exchange-Traded Self-Indexe… | 1,27% | 326.000 | 28 Ekim 2026 | Günlük |
| SPLV · Invesco Exchange-Traded Fund Trust … | 0,97% | 1.140.817 | 28 Ekim 2026 | Günlük |
| RDIV · Invesco Exchange-Traded Fund Trust … | 0,57% | 131.054 | 28 Ekim 2026 | Günlük |
| IWS · iShares Trust | 0,49% | 1.136.811 SH | 11 Eylül 2026 | Günlük |
| IMCV · iShares Trust | 0,40% | 70.805 SH | 11 Eylül 2026 | Günlük |
| SIZE · iShares Trust | 0,38% | 24.910 SH | 11 Eylül 2026 | Günlük |
| IWR · iShares Trust | 0,36% | 3.117.549 SH | 11 Eylül 2026 | Günlük |
| IMCB · iShares Trust | 0,33% | 85.059 SH | 11 Eylül 2026 | Günlük |
| QUAL · iShares Trust | 0,29% | 2.111.212 SH | 11 Eylül 2026 | Günlük |
| IMCG · iShares Trust | 0,27% | 163.022 SH | 11 Eylül 2026 | Günlük |
| XOEF · iShares Trust | 0,27% | 910 SH | 11 Eylül 2026 | Günlük |
| BSCQ · Invesco Exchange-Traded Self-Indexe… | 0,26% | 7.556.000 | 28 Ekim 2026 | Günlük |
| EUSA · iShares, Inc. | 0,21% | 60.634 SH | 11 Eylül 2026 | Günlük |
| LRGF · iShares Trust | 0,20% | 110.832 SH | 11 Eylül 2026 | Günlük |
| RSP · Invesco Exchange-Traded Fund Trust | 0,19% | 3,023,753,00 | 28 Ekim 2026 | Günlük |
| USXF · iShares Trust | 0,19% | 42.519 SH | 11 Eylül 2026 | Günlük |
| IVE · iShares Trust | 0,16% | 1.209.462 SH | 11 Eylül 2026 | Günlük |
| IUSV · iShares Trust | 0,15% | 640.730 SH | 11 Eylül 2026 | Günlük |
| EQAL · Invesco Exchange-Traded Fund Trust … | 0,14% | 18.869 | 28 Ekim 2026 | Günlük |
| BSCT · Invesco Exchange-Traded Self-Indexe… | 0,14% | 4.374.000 | 28 Ekim 2026 | Günlük |
| PFIG · Invesco Exchange-Traded Fund Trust … | 0,13% | 195.000 | 26 Ekim 2026 | Günlük |
| IWD · iShares Trust | 0,13% | 1.691.737 SH | 11 Eylül 2026 | Günlük |
| DSI · iShares Trust | 0,13% | 109.394 SH | 11 Eylül 2026 | Günlük |
| BSCS · Invesco Exchange-Traded Self-Indexe… | 0,11% | 4.062.000 | 28 Ekim 2026 | Günlük |
| PRF · Invesco Exchange-Traded Fund Trust | 0,11% | 171.298 | 28 Ekim 2026 | Günlük |
| TOPC · iShares Trust | 0,09% | 443 SH | 11 Eylül 2026 | Günlük |
| DIVB · iShares Trust | 0,08% | 26.534 SH | 11 Eylül 2026 | Günlük |
| VLUE · iShares Trust | 0,08% | 124.640 SH | 11 Eylül 2026 | Günlük |
| ILCV · iShares Trust | 0,08% | 16.911 SH | 11 Eylül 2026 | Günlük |
| XVV · iShares Trust | 0,08% | 8.404 SH | 11 Eylül 2026 | Günlük |
| USCL · iShares Trust | 0,08% | 33.766 SH | 11 Eylül 2026 | Günlük |
| IVV · iShares Trust | 0,07% | 9.188.154 SH | 11 Eylül 2026 | Günlük |
| ILCB · iShares Trust | 0,07% | 13.952 SH | 11 Eylül 2026 | Günlük |
| IWB · iShares Trust | 0,07% | 525.058 SH | 11 Eylül 2026 | Günlük |
| QVML · Invesco Exchange-Traded Fund Trust … | 0,07% | 19.212 | 28 Ekim 2026 | Günlük |
| IWV · iShares Trust | 0,07% | 213.841 SH | 11 Eylül 2026 | Günlük |
| PBP · Invesco Exchange-Traded Fund Trust | 0,07% | 4.315 | 28 Ekim 2026 | Günlük |
| PBUS · Invesco Exchange-Traded Fund Trust … | 0,07% | 115.308 | 28 Ekim 2026 | Günlük |
| IYY · iShares Trust | 0,07% | 30.956 SH | 11 Eylül 2026 | Günlük |
| ITOT · iShares Trust | 0,06% | 953.021 SH | 11 Eylül 2026 | Günlük |
| ILCG · iShares Trust | 0,06% | 28.911 SH | 11 Eylül 2026 | Günlük |
| TOK · iShares Trust | 0,06% | 2.101 SH | 11 Eylül 2026 | Günlük |
| PHDG · Invesco Actively Managed Exchange-T… | 0,06% | 567 | 28 Ekim 2026 | Günlük |
| CRBN · iShares Trust | 0,06% | 10.037 SH | 11 Eylül 2026 | Günlük |
| URTH · iShares, Inc. | 0,05% | 65.129 SH | 11 Eylül 2026 | Günlük |
| OMFL · Invesco Exchange-Traded Self-Indexe… | 0,05% | 38.095 | 28 Ekim 2026 | Günlük |
| ACWI · iShares Trust | 0,05% | 232.770 SH | 11 Eylül 2026 | Günlük |
| RWL · Invesco Exchange-Traded Fund Trust … | 0,01% | 24.358 | 27 Ekim 2026 | Günlük |
| GLOF · iShares Trust | 0,01% | 309 SH | 10 Eylül 2026 | Günlük |
| GTO · Invesco Actively Managed Exchange-T… | 0,00% | 7.000 | 27 Ekim 2026 | Günlük |
VMRK Analist Uzlaşması Boğa ve ayı analist görüşleri, 12 aylık fiyat hedefi, yukarı yönlü potansiyel
12 Aylık Fiyat Hedefi
20 analist · 2026-10-29Ortalama hedef $71.62 +17,6%
Akran karşılaştırması (GICS alt sektörü) Anahtar metrikler sektördeki benzerlerine karşı
Mali yıl bazında, fiyatlar her şirketin son mali yıl kapanışına göredir.
| Hisse Sembolü | Piyasa Değeri | P/E | Gelir YoY | Net Kar Marjı | ROE | Brüt Kar Marjı |
|---|---|---|---|---|---|---|
| VMRK | · | · | · | · | · | · |
| ESS | $16.86B | 25.2 | 6.4% | 37.2% | 12.7% | 69.9% |
| MAA | $16.24B | 36.7 | 0.83% | 20.2% | 7.7% | · |
| CPT | $11.48B | 31.1 | 81.7% | 2964.9% | 8.5% | · |
| UDR | $12.04B | 32.5 | 2.4% | 22.1% | 11.2% | · |
| IRT | $4.15B | 72.8 | 2.8% | 8.6% | 1.6% | · |
| CSR | $1.12B | 65.4 | 4.9% | 6.2% | 2.3% | · |
| NXRT | $763M | -23.9 | -3.2% | -12.8% | -9.1% | · |
Metriklerim Kişisel izleme listeniz — Tam Temeller'den seçilen satırlar
Sizin için önemli olan metrikleri seçin — Yukarıdaki Tam Temeller bölümündeki herhangi bir satırın yanındaki + işaretine tıklayın.
Seçiminiz kaydedildi ve tüm hisse senetlerinde sizinle birlikte gelir.