
FCX Freeport-McMoRan, Inc. Common Stock
NYSE · Metals & Mining · Переглянути на SEC EDGAR ↗ закриття Жов 2, 2026 10-K/10-Q Сер 6, 2026FCX Знімок акцій Ціна, ринкова капіталізація, P/E, EPS, ROE, борг/власний капітал, діапазон 52 тижнів
FCX Графік ціни акцій Денні OHLCV з технічними індикаторами — панування, масштабування та налаштування вашого представлення
Гранулярність стовпчиків адаптується до вибраного періоду — наведіть курсор на графік, щоб побачити відкриття/максимум/мінімум/закриття для стовпчика.
| Дата екс-дивіденду | Спліт | Тип |
|---|---|---|
| 02 лютого 2011 р. | 2-for-1 | Прямий |
Про Freeport-McMoRan, Inc. Common Stock Огляд компанії з Wikipedia
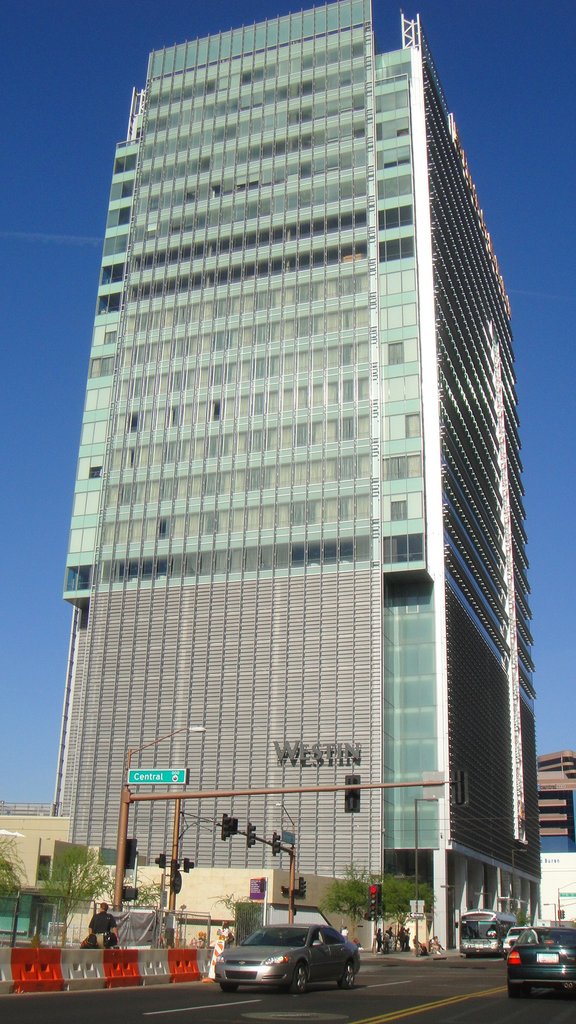
Freeport-McMoRan Inc., often called Freeport, is an American mining company based in the Freeport-McMoRan Center, in Phoenix, Arizona. The company is the world's largest producer of molybdenum, a major copper producer and operates the world's largest gold mine, the Grasberg mine in Papua, Indonesia.
It was founded 1912 by the son of a Swedish banker to develop sulfur mining along the U.S. Gulf Coast concurrently with Freeport, Texas. In 1913, it incorporated as a vertically integrated holding company including numerous subsidiaries like gas and light, railroad, oil from Tampico, Mexico, and a refinery. After 1930, the company diversified by buying into manganese mines, nickel during World War II, potash and the Cuban American Manganese Corporationin the 1950s. Since 1967, the company has mined the Ertsberg deposit of gold and copper in the Grasberg mine, where since 2017 it has been holding a 49% interest. In the 1990s the Rio Tinto Group invested in Freeport and IMC Group acquired its fertilizer business.
The multinational company which owns subsidiaries in the Americas, Europe, Asia, Africa has caused extensive, long-term and irreversible environmental damage in areas, where it has operated. It has been criticized for violating human rights in Papua. In 2018, Freeport-McMoRan Copper & Gold along with 90 additional Fortune 500 companies paid no federal taxes as a result of the Tax Cuts and Jobs Act of 2017.
In July 2026, Freeport-McMoRan projected long-term growth driven by a forecasted 50% increase in global copper demand by 2040, supporting electric vehicle and clean energy technologies.
History
The Freeport Sulphur Company was founded July 12, 1912, by the eldest son of Swante M. Swenson, banker Eric Pierson Swenson, with a group of investors, to develop sulfur mining at Bryan Mound salt dome, along the U.S. Gulf Coast. Freeport, Texas was also established in Nov. 1912 to house workers, and serve as a port for Houston, rivaling Galveston and Corpus Christi.
Freeport mined sulfur along the Gulf Coast using the Frasch process, the patents for which had expired in 1908, a disruptive innovation for the automated mining of previously inaccessible sulphur deposits at a cost lower than that of established mines, where manual labor gained the mineral under the most appalling conditions. Previously, Union Sulphur Company founder and patent-holder Herman Frasch had enjoyed a monopoly on the process. The Bryan Mound salt dome just south of Freeport became the second Frasch sulphur mine in the world in 1912.
Freeport Texas Company
Enterprise to support Freeport Sulphur's business and the new town's infrastructure led to the incorporation of a holding company on September 30, 1913, to join the newer assets with Freeport Sulphur and create a vertically integrated mining company around, at first, a single sulphur mine. Officers of the new holding company, Freeport Texas Company, were:
Eric. P. Swenson, President and Director (Freeport Sulphur founder, son of Swante M. Swenson)
Edward E. Dickinson, vice-president and Director
F.M. Altz, Secretary
Swante M. Swenson, Treasurer (son of Eric P. Swenson)
Charles H. Findlay, Auditor (son of Hugh Findlay and his third wife, Mary Ellen Smith)
Directors
Eric P. Swenson
Edward E. Dickinson
Richard H. Williams (son of Richard H. Williams)
Harry K. Knapp
Samuel McRoberts
Charles P. Northrop
Charles A. Stone
Frank A. Vanderlip
Sidell Tilghman (son of General Lloyd Tilghman)
Eppa Hunton Jr. (son of late Virginia Senator, Brig. Gen. Eppa Hunton)
Charles E. Herrmann
On May 7, 1917, all 35,000 outstanding shares were exchanged for 500,000 new shares of no par value (at a rate of 14+2⁄7:1). The stock was listed on the NYSE since 1919. Freeport raised an additional $4 million with an April 1, 1922 issue of convertible bonds, almost all of which were converted to common stock right away. Of the new total of 732,000 authorized shares 729,844 were then outstanding. In 1933, the no par common stock was exchanged for $10 par common and $2,500,000 convertible preferred were issued to finance the development of Grande Ecaille, about half of which was converted, the remainder called for redemption in 1938 at the end of which 796,380 common shares were outstanding. To raise general working capital Freeport Sulphur in 1939 sold $3,000,000 in 3% 20-year private debentures to Metropolitan Life Insurance Co. and Sun Life Insurance Co. of Canada. On September 1, 1951, the 99th consecutive quarterly dividend was paid. Effective September 21, 1951 the 800,000 outstanding common shares were split 3-for-1 and the authorized capital was increased from 850,000 to 3,000,000 shares. On March 2, 1959, the 129th consecutive quarterly dividend was paid and effective May 5, 1959 the 2,504,850 outstanding shares were once again split 3-for-1 and the authorized capital was increased from 3,000,000 to 10,000,000 shares.
Freeport Sulphur was on the Fortune 500 in 1955, 1956, 1957, 1967, 1968, 1969, 1970.
In 1919, minority stockholders John R. Williams & Sons, First National Bank of Richmond, Virginia vice-president, W. M. Addison, Benjamin P Alsopp, E. L. Norton, and Samuel W. Travers solicited proxies to use at the April 5th annual stockholders' meeting, claiming, according to reports, that "management has refused them adequate information regarding the property. President E.P. Swenson denies that information has been thus withheld and states that the board, which represents the dominant interests, has no vacancies at the present time."
1928–1931 shareholder proxy fight
In 1928, shareholder and scion of one of the founding investment firms, John Langbourne Williams & Sons, Langbourne Meade Williams, Jr. launched a proxy fight for control of the company. In 1929, he then sought help from his former supervisor at Lee, Higginson & Co., J.T. Claiborne, who then enlisted clerk John Hay Whitney – who had become one of the wealthiest men in America following the 1927 death of his father, Payne Whitney. Williams eventually gained control of the company from founder Swenson, becoming its president in 1931, with Claiborne as a vice-president, and Whitney as chairman. Williams also served as chairman during 1958–1967.
1930s
Williams led the company's diversification, beginning with the purchase of manganese deposits in Oriente Province, Cuba.
The company announced on February 19, 1931, the acquisition of a controlling interest in the Cuban American Manganese Corporation. Most of the metal was gained by concentration of low grade ore. The company benefited from (was subsidized by) zero import duty at a time when duties were high despite the United States reliance on imports for most of its supply of manganese. The deposit was depleted and the company dissolved in 1947.
In 1932, Freeport Sulphur Company acquired the sulfur rights for Lake Grande Ecaille and vicinity in Plaquemines Parish, Louisiana, and escalated the development of sulfur deposits in the Grand Ecaille dome in 1933, still using the Frasch Process developed by Dr. Herman Frasch, who had, in 1895, enjoined the American Sulphur Company into a partnership, forming the Union Sulphur Company, to initiate the first successful sulfur mining at Grand Ecaille, with which Freeport, like other competitors, would compete upon expiry of the Frasch patents in 1908. From its earliest inception, sulfur mining was the catalyst that developed Port Sulphur, Louisiana.
Effective January 1, 1937 the Freeport Texas Company changed its name to Freeport Sulphur Company (the old one was dissolved) and its character from a holding company to an operating company, likely as a response to the Revenue Act of 1936 to avoid double taxation. On this occasion all active subsidiaries except the Cuban-American Manganese Corp were liquidated.
1950s
Freeport announced on March 7, 1952, the development of 3 new sulphur mines at an estimated cost of $20 million, to be financed from accrued cash reserves, as part of the national defense industrial mobilization program (Korea War). The effort grew into a $25 million program covering 4 new mines, one major (Garden Isle Bay) and 3 minor (Bay Ste. Elaine, Nash, Chacahoula) with a combined new capacity of 750,000 long tons per year, in addition to the existing Hoskins Mound (closed in 1955) and Grand Ecaille mines.
The company produced nickel during World War II and potash in the 1950s. In 1955, Freeport Nickel invested $119 million, of which $100 million came from the U.S. government, into construction of a nickel-cobalt mine at Moa Bay, Cuba, and a refinery at Port Nickel, Louisiana. On March 11, 1957, the U.S. government announced a contract to buy nickel and cobalt from the company.
In 1956, the company formed the Freeport Oil Company. In 1958, the company sold an oil discovery near Lake Washington in Louisiana for approximately $100 million to Magnolia Petroleum Company.
In 1959, Freeport geologists confirmed the 1936 Dutch discovery of the rich Ertsberg copper and gold deposits, now known as the Grasberg mine, in extremely rugged, remote country in the Jayawijaya Mountains in what was then called the Netherlands New Guinea.
1960s
In 1960, Fidel Castro implemented a 25% ore tax, effectively nationalizing and seizing Freeport's nickel-mining operations in Cuba.
In 1961, the company entered the kaolin business after purchasing the assets of Southern Clays Inc. In 1964, the company formed Freeport of Australia to pursue mining opportunities there and in the surrounding Pacific Ocean region.
Development of the Ertsberg deposit
In 1967, the company negotiated a contract with the Indonesian government to develop the Ertsberg deposit. In their feasibility study, Freeport geologists estimated that the orebody totaled 33 million tons averaging 2.5% copper, making it the largest above-ground copper deposit ever discovered. Construction of an open pit mine began in May 1970 and in mid-1973 the mine was declared fully operational. Officials at Bechtel, the primary project contractor, called mine development at Ertsberg "the most difficult engineering project they had ever undertaken." The challenges included building a 101-kilometre (63 mi) long access road (a project that required boring kilometer long tunnels through two mountains) and constructing the world's longest single span aerial tramway. The tramways were needed to move people, supplies and ore because a 2,000-foot (610 m) cliff separates the Ertsberg mine (at 12,000 feet (3,700 m) elevation) from the mill (at 10,000 feet). Moving copper concentrate from that mill to the shipping port required installation of a 109-kilometre (68 mi) slurry pipeline – then the world's longest. Mine construction and startup cost about US$200 million. The Ertsberg project was an engineering marvel, but the mine's early financial performance was disappointing. Depressed copper prices and high operating costs kept profits marginal during the 1970s.
In 1967 The McMoRan Oil and Gas Company was founded by three partners, William Kennon McWilliams Jr. ("Mc"), James Robert (Jim Bob) Moffett ("Mo"), who were both petroleum geologists, and Mack Rankin ("Ran"), a specialist in land-leasing and sales operations. In 1981, McMoRan would merge with Freeport Minerals, formerly Freeport Sulphur, to form Freeport-McMoRan.
1970s
In 1971, the company changed its name to Freeport Minerals Company, (not to be confused with Freeport Minerals Corporation, founded in 1834).
1980s
On April 7, 1981, Freeport Minerals Company merged with the McMoRan Oil and Gas Company.
In 1981, the company formed a 70/30 joint venture with an affiliate of FMC Corporation to operate the Jerritt Canyon gold mine near Elko, Nevada. In 1985, the company headquarters moved to New Orleans, Louisiana. The company also sold a 25% interest in oil and gas assets primarily in the western United States to Britoil for $73.5 million.
In 1989, the company sold about $1.5 billion in assets to finance development of the Grasberg mine and the Main Pass offshore sulfur-oil-gas deposit off Louisiana.
1990s
In July 1995, the company completed the corporate spin-off, first announced in May 1994, of its entire interest in Freeport-McMoRan Copper & Gold, which owned the Grasberg mine.
In 1995, RTZ, a predecessor of Rio Tinto Group, made a $450 million investment in the company.
In 1997, IMC Global, a large fertilizer producer, acquired Freeport-McMoRan Inc., the former parent company that now owned the sulfur and fertilizer businesses, in a $750 million transaction. Shareholders of Freeport-McMoRan received shares of IMC Global.
In 1997, the Indonesian government asked Freeport-McMoRan to substantiate the Canadian mining company Bre-X's claims of having found the largest gold mine ever discovered, in Borneo. Freeport announced that its prospective partner Bre-X did not have gold reserves at its Indonesian mine, as it had reported. Bre-X subsequently was exposed as a fraud and went bankrupt.
In 1998, low commodity prices forced the company to suspend its dividend.
2000s
In 2003, the company was subpoenaed as part of an investigation by anti-trust authorities in the United States, Canada, and Europe into price fixing in the copper industry.
On March 19, 2007, the company acquired Phelps Dodge (for $25.9 Billion) and became the largest copper producer of any public company in the world. The corporate headquarters was moved from New Orleans, Louisiana to Phoenix, Arizona.
2010s
In 2012, the company announced agreements to acquire affiliated companies McMoRan Exploration Company and Plains Exploration & Production Company for a total enterprise value of over $20 billion. The transaction added significantly to the company's petroleum assets. The transaction was criticized as a conflict of interest due to the common ownership of the companies. In 2015, the company paid a $137.5 million settlement to resolve claims that executives and directors had conflicts of interest that resulted in the company overpaying in that transaction.
In 2014, the company sold its assets in the Eagle Ford shale to Encana for $3.1 billion. In 2015, the company announced job cuts at its Sierrita Mine in Arizona due to low copper and molybdenum prices.
On December 28, 2015, the company announced that James R. Moffett would resign as chairman of the company and be replaced by Gerald J. Ford. Moffett received $16.1 million in severance pay and cash retirement plans totaling more than $63 million. Moffett continued to consult for the company for annual fees of $1.5 million.
In May 2016, the company sold a 13% interest in its Morenci Mine to Sumitomo Group for $1 billion in cash.
In 2016, Freeport sold its deepwater assets, including the Marlin TLP, and the Holstein and Horn Mountain spars, to Anadarko Petroleum.
In August 2017, the company agreed to give a 51% interest in the Grasberg mine to the Government of Indonesia and build a smelter in exchange for a special permit to operate the mine until 2041.
In 2018, the company ranked at number 176 on the Fortune 500 list. During this year, Indonesian President Joko Widodo also planned to take control of 51% of Freeport Indonesia's equity, effectively handing over Freeport control to the Indonesian government. The Indonesian government planned to settle payments of $3.85 billion during the takeover process and finalized the process on December 21, 2018.
During 2018 Freeport-McMoRan Copper & Gold along with 90 additional Fortune 500 companies "paid an effective federal tax rate of 0% or less" as a result of the Tax Cuts and Jobs Act of 2017.
Operations as of 2019
Freeport is the world's largest producer of molybdenum, and one of the largest producers of copper. In 2019, 79% of its revenues were from the sale of copper, 11% were from the sale of gold, and 8% were from the sale of molybdenum. In 2019, sales to the company's copper refining joint venture in Gresik Regency accounted for 13% of the total revenues of the company.
Some of the company's mining operations have been as follows:
Africa
Freeport Cobalt held a 100% interest in Kisanfu, a copper and cobalt exploration project located near Tenke, Democratic Republic of the Congo. This subsidiary also owns a large cobalt refinery in Kokkola, Finland, along with a related sales and marketing business. FCX has an effective 56% of that enterprise. Negotiations in 2016 to include these cobalt projects in a sale to China Molybdenum of Tenke Fungurume Mine, a cobalt/copper mine in DRC Congo, were not successful. Instead, the Kisanfu mine was sold to China Molybdenum in a separate transaction in 2020.
Europe
In December 2019, Freeport Cobalt (a joint venture between Freeport-McMoRan and Lundin Mining) sold its cobalt refinery in Kokkola, Finland to Umicore. FCX held an effective 56% interest in that enterprise.
North America
Arizona
Bagdad, Arizona – 100% owned (copper, molybdenum)
Miami, Arizona – 100% owned (copper)
Morenci, Arizona – 72% owned (copper)
Safford mine, Safford, Arizona – 100% owned (copper)
Sierrita mine, Arizona (includes Twin Buttes & Esperanza) – 100% owned (copper, molybdenum)
Colorado
Climax mine, Leadville, Colorado – 100% owned (molybdenum)
Henderson molybdenum mine, Empire, Colorado – 100% owned (molybdenum)
New Mexico
Chino mine, Santa Rita, New Mexico – 100% owned (copper, molybdenum)
Tyrone, New Mexico – 100% owned (copper)
South America
El Abra, Chile – 51% owned (copper)
Cerro Verde, Peru – 54% owned (copper, molybdenum)
Europe
Atlantic Copper, Huelva, Spain – 100% owned copper refinery
Indonesia
Grasberg, Central Papua, Indonesia – 49% owned (copper, gold, silver)
Controversies
Safety record
In 2011, Freeport was fined by the U.S. Department of Labor's Mine Safety and Health Administration over the death of a miner. The 67-year-old man had fallen into a hole created by the removal of two steel gratings. It was concluded that Freeport had not done enough to indicate that the hole was there.
Grasberg Mine, human rights and environment
Freeport has had a troubled relationship with the Amungme and Kamoro peoples since it arrived in Papua, Indonesia in 1967 to operate the world's largest and most profitable gold mine, the Grasberg mine. Freeport allegedly damaged 30.000 hectares of the rainforest and two major rivers, on which they depend for their food, water, livelihoods, and traditions. The company is a signatory participant of the Voluntary Principles on Security and Human Rights.
Pressured by cultural and economic deterioration, there were numerous quarrels, between the tribes, Freeport, and the Indonesian military.
According to a 1996 Dames & Moore environmental audit the Grasberg mine's tailings "severely impacted" more than 11 square miles (28 km2) of rainforest. The report, endorsed by Freeport, also estimated that during the life of the mine 3.2 billion tons of waste rock – large components of which generate acid – would be dumped into the local river system. Overburden (waste rock) from the mine had already polluted a nearby lake due to acid mine drainage.
In 2003, a landslide killed eight workers. A government study concluded that the incident was the result of negligence. Important warning signs had been detected two days prior. In response to this, management moved some equipment, but did not keep workers out of the area. A month later two workers died from being exposed to sulfur fumes. The government ultimately overturned its conclusion and attributed the incident to natural causes.
In 2005, The New York Times reported that the company paid local military and police generals, colonels, majors and captains, and military units, a total of nearly US$20 million between 1998 and 2004. One individual received up to US$150,000. The payments were meant to secure the reserve. The company responded that the payments did not go to individuals, but went into infrastructure, food, housing, fuel, travel, vehicle repairs, and allowances to cover incidental and administrative costs. According to the report, anonymous sources within the company claimed that company chairman James R. Moffet courted Indonesia's dictator Suharto and "his cronies", cutting them in on deals. Another employee is said to have worked on a program to monitor environmentalists' telephone and email conversations, in collaboration with Indonesian military intelligence officers.
In 2006, citing extensive, long-term and irreversible environmental damage in New Guinea, the Government Pension Fund of Norway excluded Freeport-McMoRan from its investment portfolio, following a recommendation from the fund's ethical council.
In 2013, a tunnel collapse killed 28 workers. The Freeport geological team claimed that the collapse at the Big Gossan tunnel was caused by erosion of the ceiling, brought about by the continuous infiltration of the limestone wallrocks by corrosive acidic groundwater. Freeport was accused of negligence by the Indonesian National Human Rights Commission.
Attacks by Papuan militants
On 11 July 2009, a Freeport-McMoRan employee was shot dead in an attack outside the company's mine in Papua.
On 11 February 2026, an attack targeted a Freeport Indonesia convoy, killing an Indonesian soldier and injuring a Freeport-McMoRan employee and an officer. Exactly one month later, West Papua National Liberation Army militants ambushed a Freeport-McMoRan truck at the Grasberg minesite. One employee was killed and another was wounded.
Environmental record
Based on 2014 data, the Political Economy Research Institute ranked Freeport-McMoRan 13th among corporations emitting airborne pollutants in the U.S. The ranking is based on emission quantities and toxicity.
After discovery of uranium and sulfate in the groundwater, Cyprus Tohono Corporation provided North Komelik, Arizona residents with bottled water until 2003. In 2003, two new supply wells were installed six miles south of the village. The mine used various mining methods to process ore into copper, and these methods required a mix of chemical fluids. Workers disposed of these chemicals in two areas downhill from the mine in unlined ponds. As a result, the liquid chemicals seeped into the ground below the disposal area and polluted a groundwater drinking source known as the "basin-fill aquifer". The Tohono O'odham Nation, where the mine is located relies heavily upon groundwater to meet drinking water needs.
On October 15, 2009, the City of Blackwell filed suit against Freeport-McMoRan over the contamination caused by its Blackwell Zinc Smelter. The city considered the contamination a nuisance, and alleged that 58 million pounds of toxic waste remained in the city, causing illness within its 7,200 residents. The City of Blackwell and Freeport settled for $54M in February 2010. In 2012, Freeport agreed to a $119M settlement with the residents.
Past holdings
Sulphur mines
Bryan Mound
A first demonstration run began on November 19, 1912, but the plant was quickly shut down again for adjustments. Operations were unsteady throughout 1913. In December one shipment of 730 tons was made to New York and the plant produced about 200 tons per week. The Bryan Mound was 25 feet tall. Five different companies had drilled about 16 holes into the mound in the search for oil, but found no hydrocarbons in commercially viable quantities and attached no value to the sulphur they encountered under the given conditions. During two years of prospecting and with total of $150,000 expended, the Freeport Sulphur syndicate drilled 11 holes, each of them showing sulphur at between 760 feet and 1,100 feet in the form of sulphur bearing limestone, dolomite and gypsum with some beds of pure sulphur up to 7 feet thick. The deposit was carried at a bit below $30,000,000 of estimated value in the 1918 balance sheet. Bryan Mound production was not entirely continuous. To reduce stockpiles, work was suspended from April 1, 1921 until May 1922 and then again from January 31, 1924 to May 15, 1925. During production periods not all of the plants were necessarily in operation. The four plants were built by Westinghouse, Church, Kerr & Co and together were considered to be among the largest oil burning installations in the world.
Freeport Sulphur Co. was also prospecting for oil at Bryan Mound. They found a (decomposing) tree in January 1919 at a record-candidate depth of 2,883 ft.
Hoskins Mound
In 1923, Freeport started producing sulfur from Hoskins Mound in Brazoria County, Texas.
The sulphur was obtained from a depth of between 900 and 1,300 feet. The plant equipment was purchased in 1918 intended to become the 5th plant at Bryanmound, but those plans were abandoned with the end of World War I. Temporary housing, water reservoirs and the excavation for the foundation were all completed before the first train brought cement to the construction site on October 7, 1922. The power plant of steel and brick construction had a 175 foot by 13 foot chimney and was completed on March 26, 1923, with the first turbogenerator already in service since March 10. In the beginning, oil was burned at the Hoskins Mound plant, transported by tank cars from Freeport, stored in 2x15,000bbl tanks and one 55,000bbl reserve tank. These 85,000bbl constituted about 2 months worth of supply (a little more than 1,400bpd). The power generation came from 6 batteries of 2x702hp Stirling boilers (ca. 8,400 hp total). Two 500kW turbogenerators supplied 2,200 volt 3-phase current for those water pumps some distance from the boiler house, the lights, and several auxiliary devices. Hoskins Mound was property of Texaco which received a $1 royalty per ton, as well as 50% of the profits until the time when Freeport had accumulated $2 million of the profit, at which point the contract (dated March 14, 1922) called for 70% of the profits to go to Texaco. The plant was built by Dwight P. Robinson & Co, which by then had absorbed Westinghouse, Church, Kerr & Co, builder of the Bryan Mound plants.
Grand Ecaille
Garden Island Bay
Production started the first week of December 1953 (preliminary activity in November). with approximately 500,000 tons per year capacity, Garden Island Bay was the largest of 4 new mines brought online in Freeport's early 1950s expansion program and in fact the largest new mine in the entire industry since Grand Ecaille in 1933. It was built at a cost of $14 million in an isolated marshland, the only other industrial facility within a 75-mile radius was Freeport's own Grande Ecaille. With the area only a foot or two above sea level, to protect against flooding it was necessary to pour an above-ground foundation, some 16 feet high resting on concrete pilings driven into the ground. When finished the plant could only be reached by boat or seaplane. The power plant and the drill site were 1 mile apart. The sulphur was brought by barges in liquid form to Port Sulphur. Even though Freeport already had the capability to use salty water in its process, this was not used and instead 2 earthen reservoirs together 1 square mile in size and holding almost a billion gallons could satisfy the plants demand for 3.5 million gallons per day. The reservoirs were filled between February and June, when salt water intrusion into the Mississippi river was at its seasonal low point. The sulphur mining rights were obtained in the beginning of 1951 from Texaco, which retained 50% of the profits. The discovery of the deposit was announced by Freeport on August 22, 1951. In its first full year (1954) the plant produced in excess of its rated 500,000 tons.
Grand Isle
Grand Isle was built (beginning on June 20, 1958) at a cost of $30 million of which $8 million represented the extra cost due to it being 7 miles off the coast of Grand Isle, Louisiana (it was the first ever offshore sulphur mine). The plant began operations on April 14, 1960. Its location in the general vicinity of Port Sulphur meant that the port was used as the transshipment hub for this mine. The offshore platform at a depth of 50 feet of water had an Y-shape, where the power plant on the far end was followed by a platform for living quarters and then the heliport, after which it bifurcated and led to 2 production platforms (the second was built in 1962 at a cost of $3.5 million), both of which allowed for 108 holes to be drilled directionally from 36 surface locations to a typical depth of 2,200 ft with a horizontal deviation of up to 1,250 ft and the holes thus fanned out into a kind of pyramid shape below each platform. The new mine was highly automated and originally required 75 workers to run. There were two groups where each alternately worked for 5 days and then rested 5 days. A special engineering feature was the 7 mile undersea molten sulphur pipeline which was buried 5 ft beneath the ocean floor. It consisted of a 14-inch outer diameter casing which enclosed a thermally insulating air volume and a 7+5⁄8-inch OD hot water pipeline which in turn contained a concentric 6-inch OD molten sulphur line. Outside of the 14-inch casing one pipe was attached for hot water return to the mine and one for fresh water supply to the mine (but salt water was pumped into the deposit). Sulphur entered the line at 320 °F and exited at the shore of Grand Isle at 280 °F from where it was shipped still in liquid form by barges to Port Sulphur. The original plant had a capacity of 2,500-3,300 tons of sulphur per day and a requirement for 13mmcfd of natural gas. The sulphur rights were obtained in 1956 from Humble Oil which retained a right to 50% of the profits. The former platform was turned into an artificial reef and is today totally submerged.
Minor Sulphur Mines
Bay Ste. Elaine
Freeport announced the development of a new process for the use of seawater in Frasch mining on February 18, 1952. Bay Ste. [Sainte] Elaine was a relatively small mine, but notable not only for the first use of salt water in a Frasch mine, but also for the mounting of the principle plant equipment on barges instead of dredging an artificial island, which was the solution chosen for the company's first Louisiana marshland mine (Grand Ecaille). The power plant on the main 200 ft long, 40 ft wide and 12 ft deep barge (photograph:) was installed at Grand Ecaille and towed in place. The barge was partially sunk and main deck level was 6.5 ft above the water line. The boilers ran on a fresh water cycle going through heat exchangers. Heat exchangers were of corrosion-resistant steel and salt water pipes had a cement lining. The plant was designed for parallel operation of 6 wells and rated at 100,000 long tons per year. Two 1,000 ton 1.5 million gallon 224 ft x 39 ft x 8ft5in insulated tank barges towed by a 800 hp twin-screw diesel towboat brought the molten sulphur to Port Sulphur, 75 miles and an optimal round trip delay of 36 hours away (i.e. 666 tons per day maximum average ferrying capacity on a tight schedule since mine operation was continuous). Bay Ste. Elaine required a workforce of 85 and 100 when including support personnel at Port Sulphur and Grand Ecaille. From the beginning it was accepted that the BSE operation may not actually be profitable. Texaco had leased the land covering the Bay Ste. Elaine, Dog Lake and Lake Pelto dome areas in 1928 from the Louisiana Land & Exploration Co. and had sublet some of it on February 27, 1951, to Freeport Sulphur. Louisiana Land and Texaco shared equally in a $2 per ton royalty and 40% of net profits.
Nash
Commencement of operations was announced on February 2, 1954. The land was held in trust by the Kentucky Female Orphan School of Midway, Kentucky and the school received royalties. Even among the minor deposits, Nash was especially small.
Chacahoula
Operations began on March 10, 1955.
Lake Pelto
Full scale development began in June 1960. The plant for the most part was reused from the decommissioned Bay Ste. Elaine mine, including the 200 ft-barge-mobile-power-plant which was lifted to rest on a foundation on the Pelto artificial island. Like at Bay Ste. Elaine, sea water was pumped into the deposit. The drill site was 1 mile from the island base facilities. The field pipe line was installed at an elevation of 20 ft. Along this pipe line, 4,800 ft from the main island a prefabricated steel structure relay station and the relay tower from Bay Ste. Elaine mine were installed, the latter's height increased to 150 ft. From the communication station a further 2,560 ft of pipe led to the production area. The sulphur was brought in liquid form by barge to Port Sulphur.
Metal mines
Cuban-American Manganese Corporation (1931–1947):
The Delaware company offered the first block of 140,000 no par common shares out of an authorized 250,000 in September 1928. The capital was increased to 350,000 authorized shares on February 14, 1931.
The Freeport Texas Co. announced on February 19, 1931, the acquisition of a controlling interest (resulting in 9 of 15 Board members) in the Cuban-American Manganese Corporation, owner of 10,000 acres of manganese deposits within 25 miles of Santiago adjacent to the Cuban Railway main line. A plant to process 1,000 tons a day of ore and produce 100,000 tons a year of 50% concentrate was to be constructed within one year. Before 1921 some of the properties were operated by Rand & Aguilara. A prior attempt to finish the plant by July 1929 was apparently not a success. The froth flotation process for concentrating the ore had been developed and tested at commercial scale by Freeport and the B. F. Goodrich Company, who were the principal minority shareholders in the Cuban company. Cuba was not an important producer of manganese and in fact the company worked the only commercially viable deposit in the country which was only viable because it was free from tariffs on import to the United States which heavily relied on importation of the metal. In July 1932 Cuban-American floated 700,000 shares of par $2 8% preferred stock, convertible to common one-for-one at any time. In 1932 Freeport bought additional shares for $699,327 out of its cash reserve. At the end of 1934 the investment stood at 313,621 preferred and 289,715.5 common shares (86.19% of voting shares) and was carried as the principal constituent of the Investments at Cost ($2,727,961) row in the balance sheet. The US-Brazilian trade agreement of February 2, 1935 lowered the manganese import duty by 50% and the plant had to shut down on May 1, 1935, due to the loss of competitive advantage, although the sorting and shipping of high grade ore was continued. The company invested $500,000 into a wet-processing sintering kiln process to increase efficiency and could reopen in early 1937. Total investment was estimated at $3,000,000. In 1941 the Metals Reserve Corp contracted for between 25,000 and 65,000 long tons of concentrate a year over 3 years and plant capacity was increased from 100,000 to 130,000 tons of >=50% concentrate per year. The plant could also produce an additional 50,000 tons of 39-40% concentrate. The company for the first time paid a dividend on its common stock (50 cents) on December 27, 1940. At the time there were 355,873 common shares outstanding and on January 15, 1941, all 594,127 shares of $2 par preferred stock were called unless converted to common stock at a rate of one-for-one before that date. Freeport Sulphur announced it would convert its entire holding of 95% of the preferred. In December 1946 depletion of the mine was imminent. The Cuban-American Manganese Corp was dissolved. For each 95 shares of the company one share of par $50 stock of the Cuban Mining Co. subsidiary was distributed from a total of 10,000 authorized and outstanding shares. Freeport Sulphur owned 94% of the shares of Manganese Corp and thus received 94% of the stock of Cuban Mining Co. Additionally each of the 950,000 shares received $4.958 in cash. Plans were set in motion to convert the plant to produce Portland cement, but this led nowhere and on August 12, 1947, it was announced that the Cuban Mining Co. would also be dissolved. Freeport received $30 per share on September 29, 1947, and $45 per share on October 31, 1947, from this liquidation. The liquidation value of both companies was thus $5,460,100.
Jerritt Canyon mine, near Elko, Nevada has produced over 8 million ounces of gold since 1981. Originally a joint venture of Freeport McMoRan (FCX) with FMC Corporation, then FMC Gold then Meridian Gold, Freeport's share of Jerritt Canyon was then sold to Independence Mining Co., a subsidiary of Minorco (an Anglo American Corporation subsidiary). Minorco later divested all its gold mining assets to AngloGold. AngloGold and Meridian Gold sold the mine to Queenstake Resources in 2003. In 2007 Queenstake and Yukon Gold Corp merged to become Yukon-Nevada Gold, which in 2012 became Veris Gold. Veris Gold operated under U.S. Bankruptcy Code and the Companies' Creditors Arrangement Act bankruptcy protections of Canada from June 9, 2014. Sprott Mining bought the concern after the Canadian bankruptcy court ordered Veris to sell its assets.
In May 2016 Freeport announced an agreement to sell its interests in TF Holdings to China Molybdenum Co., Ltd. (CMOC) for $2.65 billion in cash and possibly more if the average copper price rose enough to trigger the increase in the following 24 months. TF Holdings was a Bermuda holding company with indirect ownership of 80% of Tenke Fungurume Mine. Since FCX had owned 70% ownership of TF Holdings, the sale gave China Molybdenum a 56% interest in Tenke Fungurume Mine. The parties discussed including Kokkola refinery and Kisanfu Exploration in the sale, but did not agree on the terms to do so.
In December 2020, Freeport completed the sale of its interests in the Kisanfu undeveloped project in Democratic Republic of Congo to a wholly owned subsidiary of China Molybdenum Co., Ltd. for US$550 million.
Past board members
Past board members include Henry Kissinger, John Hay Whitney, Robert A. Lovett, Benno C. Schmidt Sr., Gus Long, Arleigh Burke, J. Stapleton Roy, Godfrey Rockefeller and his cousin-in-law, Jean Mauzé.
Джерело: Wikipedia (Англійська), CC BY-SA 4.0 · Переглянути на Wikipedia ↗
10-річна ефективність Тренди виручки, чистого прибутку, маржі та EPS
Оцінка Співвідношення P/E, P/S, P/B, EV/EBITDA — акція дорога чи дешева?
| Метрика | 5-річний тренд | FCX | середнє за 5 років | Медіана аналогів | Висновок |
|---|---|---|---|---|---|
| P/E | 31.9 | · | · | · |
Медіана аналогічних компаній розраховується на стандартизованій основі для кожного показника і може не завжди відповідати базі TTM/MRQ, показаній для цієї акції.
Прибутковість Валова, операційна та чиста маржа; ROE, ROA, ROIC
| Метрика | 5-річний тренд | FCX | середнє за 5 років | Медіана аналогів | Висновок |
|---|---|---|---|---|---|
| Операційна маржа (TTM) | 26.8% | · | · | · | |
| Маржа EBITDA (TTM) | 35.1% | · | · | · | |
| До оподаткування маржа (TTM) | 25.7% | · | · | · | |
| Маржа чистого прибутку (TTM) | 16.2% | · | · | · | |
| ROA | 7.3% | · | · | · | |
| ROE | 22.8% | · | · | · | |
| ROIC | 15.0% | · | · | · |
Фінансове здоровʼя Борг, ліквідність, платоспроможність — міцність балансу
| Метрика | 5-річний тренд | FCX | середнє за 5 років | Медіана аналогів | Висновок |
|---|---|---|---|---|---|
| Борг / Власний капітал (MRQ) | 0.5 | · | · | · | |
| Поточний коефіцієнт (MRQ) | 2.1 | · | · | · | |
| Quick Ratio (Коефіцієнт швидкої ліквідності) | 0.8 | · | · | · | |
| Довгостроковий борг / Власний капітал (MRQ) | 0.4 | · | · | · |
Зростання Зростання виручки, EPS та чистого прибутку: рік до року, 3-річний CAGR, 5-річний CAGR
| Метрика | 5-річний тренд | FCX | середнє за 5 років | Медіана аналогів | Висновок |
|---|---|---|---|---|---|
| Revenue YoY (Виторг рік до року) | 1.8% | · | · | · | |
| Revenue CAGR 3Y (CAGR виторгу 3 роки) | 4.4% | · | · | · | |
| Revenue CAGR 5Y (CAGR виторгу 5 років) | 12.8% | · | · | · | |
| Net Income YoY (Чистий прибуток рік до року) | -5.6% | · | · | · | |
| Net Income CAGR 3Y (CAGR чистого прибутку 3 роки) | -2.5% | · | · | · | |
| Net Income CAGR 5Y (CAGR чистого прибутку 5 років) | 36.9% | · | · | · |
Ефективність капіталу Оборотність активів, оборотність запасів, оборотність дебіторської заборгованості
| Метрика | 5-річний тренд | FCX | середнє за 5 років | Медіана аналогів | Висновок |
|---|---|---|---|---|---|
| Asset Turnover (Оборотність активів) | 0.5 | · | · | · | |
| Receivables Turnover (Оборотність дебіторської заборгованості) | 33.3 | · | · | · | |
| Revenue / Employee (Виручка / співробітник (річна виручка ÷ кількість співробітників (штатний розпис, yfinance). Похідне — не збережена концепція SEC-XBRL).) | ≈$893.6K | · | · | · |
значення · ≈ середнє за 5 років · медіана галузі · вердикт відносно медіани
Дивіденди Дивідендна дохідність, коефіцієнт виплат, історія дивідендів, 5-річний CAGR
| Дата екс-дивіденду | Сума | Валюта | Дохідність |
|---|---|---|---|
| Лип 15, 2026 | $0,15 | USD | ≈0.98% |
| Кві 15, 2026 | $0,15 | USD | ≈0.87% |
| Січ 15, 2026 | $0,15 | USD | ≈1.0% |
| Жов 15, 2025 | $0,15 | USD | ≈1.4% |
| Лип 15, 2025 | $0,15 | USD | ≈1.4% |
| Кві 15, 2025 | $0,15 | USD | ≈1.8% |
| Січ 15, 2025 | $0,15 | USD | ≈1.5% |
| Жов 15, 2024 | $0,15 | USD | ≈1.3% |
| Лип 15, 2024 | $0,15 | USD | ≈1.2% |
| Кві 12, 2024 | $0,15 | USD | ≈1.2% |
| Січ 11, 2024 | $0,15 | USD | ≈1.5% |
| Жов 12, 2023 | $0,15 | USD | ≈1.7% |
| Лип 13, 2023 | $0,15 | USD | ≈1.4% |
| Кві 13, 2023 | $0,15 | USD | ≈1.4% |
| Січ 12, 2023 | $0,15 | USD | ≈1.3% |
| Жов 13, 2022 | $0,15 | USD | ≈2.3% |
| Лип 14, 2022 | $0,15 | USD | ≈2.1% |
| Кві 13, 2022 | $0,15 | USD | ≈0.91% |
| Січ 13, 2022 | $0,15 | USD | ≈0.85% |
| Жов 14, 2021 | $0,08 | USD | ≈0.61% |
Історія прибутків EPS фактичний проти прогнозу, сюрприз %, коефіцієнт перевищення, дата наступного звіту про прибутки
| Період | Звіт | EPS (факт) | EPS прогноз | Сюрприз |
|---|---|---|---|---|
| 30 червня 2026 р. | Лип 16, 2026 | $0.74 | $0.60 | 24.2% |
| 31 березня 2026 р. | $0.57 | $0.46 | 23.1% | |
| 31 грудня 2025 р. | $0.47 | $0.29 | 62.0% | |
| 30 вересня 2025 р. | $0.50 | $0.41 | 21.4% | |
| 30 червня 2025 р. | $0.54 | $0.46 | 17.8% | |
| 31 березня 2025 р. | $0.24 | $0.24 | -0.21% |
Повні фундаментальні показники Усі показники за роками — звіт про прибутки та збитки, баланс, рух грошових коштів
Звіт про прибутки та збитки
| Метрика | Тенденція | 2025 | 2024 | 2023 | 2022 | 2021 | 2020 | 2019 | 2018 | 2017 | 2016 | 2015 | 2014 |
|---|---|---|---|---|---|---|---|---|---|---|---|---|---|
| Revenue | $25.91B | $25.45B | $22.86B | $22.78B | $22.84B | $14.20B | $14.40B | $18.63B | $16.40B | $14.83B | $14.61B | $20.00B | |
| Cost of Revenue | $18.62B | $17.80B | $15.70B | $15.09B | $14.03B | $11.65B | $13.12B | $13.47B | $11.98B | $17.53B | $27.41B | $18.49B | |
| SG&A Expense | $545M | $513M | $479M | $420M | $383M | $370M | $394M | $422M | $477M | $597M | $558M | $580M | |
| Operating Expenses | $19.40B | $18.59B | $16.63B | $15.74B | $14.48B | $11.76B | $13.31B | $13.87B | $12.71B | $17.56B | $28.12B | $20.30B | |
| Operating Income | $6.52B | $6.86B | $6.22B | $7.04B | $8.37B | $2.44B | $1.09B | $4.75B | $3.69B | $-2.73B | $-13.51B | $-298M | |
| Other Non-op | $223M | $362M | $286M | $207M | $-105M | $59M | $-138M | $76M | $-8M | $-14M | $1M | $31M | |
| Pretax Income | $6.37B | $6.91B | $6.01B | $6.71B | $7.66B | $1.80B | $306M | $3.89B | $2.90B | $-3.47B | $-14.13B | $-800M | |
| Income Tax | $2.22B | $2.52B | $2.27B | $2.27B | $2.30B | $944M | $510M | $991M | $883M | $371M | $-1.95B | $225M | |
| Net Income | $4.15B | $4.40B | $3.75B | $4.48B | $5.37B | $865M | $-189M | $2.89B | $2.10B | $-4.03B | $-12.09B | $-745M | |
| EPS (Basic) | · | · | · | · | $2.93 | $0.41 | $-0.17 | $1.79 | $1.25 | $-3.16 | $-11.31 | $-1.26 | |
| EPS (Diluted) | · | · | · | · | $2.90 | $0.41 | $-0.17 | $1.78 | $1.25 | $-3.16 | $-11.31 | $-1.26 | |
| Shares (Basic) | 1,437,000,000 | 1,438,000,000 | 1,434,000,000 | 1,441,000,000 | 1,466,000,000 | 1,453,000,000 | 1,451,000,000 | 1,449,000,000 | 1,447,000,000 | 1,318,000,000 | 1,082,000,000 | 1,039,000,000 | |
| Shares (Diluted) | 1,443,000,000 | 1,445,000,000 | 1,443,000,000 | 1,451,000,000 | 1,482,000,000 | 1,461,000,000 | 1,451,000,000 | 1,458,000,000 | 1,454,000,000 | 1,318,000,000 | 1,082,000,000 | 1,039,000,000 | |
| EBITDA | $8.76B | $9.11B | $8.29B | $9.06B | · | $3.96B | $2.50B | $6.51B | $5.35B | $-182M | $-13.38B | · |
Баланс
| Метрика | Тенденція | 2025 | 2024 | 2023 | 2022 | 2021 | 2020 | 2019 | 2018 | 2017 | 2016 | 2015 | 2014 |
|---|---|---|---|---|---|---|---|---|---|---|---|---|---|
| Cash & Equivalents | $3.82B | $3.92B | $4.76B | $8.15B | $8.07B | $3.66B | $2.02B | $4.22B | $4.53B | $4.25B | $177M | $298M | |
| Receivables | $977M | $578M | $1.21B | $1.34B | $1.17B | $892M | $741M | $829M | $1.32B | $1.13B | $645M | $953M | |
| Other Current Assets | $580M | $535M | $375M | $381M | $523M | $341M | $655M | $422M | $286M | $199M | $161M | $657M | |
| Current Assets | $13.79B | $13.30B | $14.06B | $15.61B | $14.83B | $9.30B | $7.92B | $10.46B | $10.63B | $10.44B | $7.46B | $9.04B | |
| PP&E (Net) | $40.74B | $38.51B | $35.30B | $32.63B | $30.34B | $29.82B | $29.58B | $28.01B | $22.99B | $23.22B | $23.99B | $26.22B | |
| PP&E (Gross) | $66.43B | $62.34B | $84.57B | $80.90B | $77.02B | $74.88B | $73.36B | $71.11B | $64.80B | $35.96B | $35.40B | $37.48B | |
| Accum. Depreciation | $25.69B | $23.83B | $49.27B | $48.27B | $46.67B | $45.06B | $43.77B | $43.09B | $41.80B | $12.74B | $11.41B | $11.26B | |
| Goodwill | · | · | · | · | · | · | · | · | · | · | · | $0 | |
| Intangibles | $432M | $428M | $422M | $416M | $412M | $401M | $402M | $398M | $307M | $305M | $316M | $334M | |
| Other Non-current Assets | $1.66B | $1.51B | $1.81B | $1.60B | $1.46B | $1.56B | $1.89B | $2.17B | $2.27B | $1.96B | $1.99B | $1.96B | |
| Total Assets | $58.17B | $54.85B | $52.51B | $51.09B | $48.02B | $42.14B | $40.81B | $42.22B | $37.30B | $37.32B | $46.58B | $58.67B | |
| Accounts Payable | $4.57B | $2.79B | $2.47B | $2.70B | $2.04B | $1.47B | $1.65B | $1.66B | $1.55B | $1.54B | $2.25B | $3.65B | |
| Current Liabilities | $6.02B | $5.50B | $5.82B | $6.34B | $5.89B | $3.42B | $3.21B | $3.33B | $4.91B | $4.26B | $4.31B | $5.17B | |
| Capital Leases | $1.01B | $692M | $347M | $294M | $281M | $190M | $204M | $0 | · | · | · | · | |
| Deferred Tax | $4.62B | $4.38B | $4.45B | $4.27B | $4.23B | $4.41B | $4.21B | $4.03B | $3.66B | $3.77B | $3.57B | $6.40B | |
| Other Non-current Liabilities | $1.30B | $1.20B | $1.65B | $1.56B | $1.68B | $2.27B | $2.49B | $2.23B | $2.01B | $1.75B | $1.64B | $1.86B | |
| Total Liabilities | $27.40B | $26.07B | $25.20B | $26.22B | $25.00B | $23.48B | $23.36B | $24.32B | $26.01B | $28.06B | $33.77B | $35.45B | |
| Long-term Debt | $9.38B | $8.95B | $9.42B | $10.62B | $9.45B | $9.71B | $9.83B | $11.14B | · | $2.23B | · | · | |
| Total Debt | $9.38B | $8.95B | $9.42B | $10.62B | · | $9.71B | $9.83B | $11.12B | $11.70B | $14.79B | $19.78B | · | |
| Common Stock | $163M | $162M | $162M | $161M | $160M | $159M | $158M | $158M | $158M | $157M | $137M | $117M | |
| Paid-in Capital | $23.68B | $23.80B | $24.64B | $25.32B | $25.88B | $26.04B | $25.83B | $26.01B | $26.75B | $26.69B | $24.28B | $22.28B | |
| Retained Earnings | $1.39B | $-170M | $-2.06B | $-3.91B | $-7.38B | $-11.68B | $-12.28B | $-12.04B | $-14.72B | $-16.54B | $-12.39B | $128M | |
| Treasury Stock | $6.02B | $5.89B | $5.77B | $5.70B | $4.29B | $3.76B | $3.73B | $3.73B | $3.72B | $3.71B | $3.70B | $3.69B | |
| AOCI | $-305M | $-314M | $-274M | $-320M | $-388M | $-583M | $-676M | $-605M | $-487M | $-548M | $-503M | $-544M | |
| Stockholders' Equity | $18.90B | $17.58B | $16.69B | $15.55B | $13.98B | $10.17B | $9.30B | $9.80B | $7.98B | $6.05B | $7.83B | $18.29B | |
| Liabilities + Equity | $58.17B | $54.85B | $52.51B | $51.09B | $48.02B | $42.14B | $40.81B | $42.22B | $37.30B | $37.32B | $46.58B | $58.67B |
Грошовий потік
| Метрика | Тенденція | 2025 | 2024 | 2023 | 2022 | 2021 | 2020 | 2019 | 2018 | 2017 | 2016 | 2015 | 2014 |
|---|---|---|---|---|---|---|---|---|---|---|---|---|---|
| D&A | $2.24B | $2.24B | $2.07B | $2.02B | $2.00B | $1.53B | $1.41B | $1.75B | $1.71B | $2.61B | $3.50B | $3.86B | |
| Stock-based Comp | $121M | $109M | $109M | $95M | $98M | $99M | $63M | $76M | $71M | $86M | $85M | $106M | |
| Deferred Tax | $253M | $-74M | $373M | $299M | $211M | $298M | $45M | $216M | $-163M | $273M | $-3.39B | $-811M | |
| Restructuring | · | · | · | · | · | · | · | · | · | · | $46M | · | |
| Other Non-cash | $-1.16B | $485M | $-1.02B | $-1.75B | · | $227M | $151M | $-1.08B | $965M | $4.84B | · | · | |
| Operating Cash Flow | $5.61B | $7.16B | $5.28B | $5.14B | $7.71B | $3.02B | $1.48B | $3.86B | $4.67B | $3.74B | $3.22B | $5.63B | |
| CapEx | $4.49B | $4.81B | $4.82B | $3.47B | $2.12B | $1.96B | $2.65B | $1.97B | $1.41B | $2.81B | $6.35B | $7.21B | |
| Investing Cash Flow | $-4.47B | $-5.03B | $-4.96B | $-3.44B | $-1.96B | $-1.26B | $-2.10B | $-5.02B | $-1.32B | $3.55B | $-6.25B | $-3.80B | |
| Stock Issued | · | · | · | · | · | · | · | $3.50B | $0 | $1.51B | $1.94B | $0 | |
| Stock Repurchased | $107M | $59M | $0 | $1.35B | $488M | $0 | $0 | · | · | · | · | · | |
| Net Stock Activity | $-107M | $-59M | $0 | $-1.35B | · | · | · | $0 | $0 | $1.51B | $1.94B | · | |
| Dividends Paid | $865M | $865M | $863M | $866M | $1.00B | $0 | $0 | $218M | $176M | $699M | $725M | $1.73B | |
| Financing Cash Flow | $-1.88B | $-3.28B | $-2.65B | $-1.62B | $-1.34B | $-128M | $-1.56B | $900M | $-3.06B | $-3.17B | $2.79B | $-3.35B | |
| Net Change in Cash | $-738M | $-1.15B | $-2.33B | $76M | $4.41B | $1.62B | $-2.18B | $-255M | $290M | $4.12B | $-240M | $-1.52B | |
| Taxes Paid | $2.90B | $2.55B | $2.01B | · | · | · | · | · | · | · | · | · | |
| Free Cash Flow | $1.12B | $2.35B | $455M | $1.67B | · | $1.06B | $-1.17B | $1.89B | $3.27B | $916M | $-3.13B | · |
Прибутковість
| Метрика | Тенденція | 2025 | 2024 | 2023 | 2022 | 2021 | 2020 | 2019 | 2018 | 2017 | 2016 | 2015 | 2014 |
|---|---|---|---|---|---|---|---|---|---|---|---|---|---|
| Operating Margin | 25.1% | 27.0% | 27.2% | 30.9% | · | 17.2% | 7.6% | 25.5% | 22.1% | -18.8% | -84.3% | · | |
| Net Margin | 16.0% | 17.3% | 16.4% | 19.7% | · | 6.1% | -1.3% | 15.5% | 12.8% | -27.1% | -76.1% | · | |
| Pretax Margin | 24.6% | 27.1% | 26.3% | 29.5% | · | 12.7% | 2.1% | 20.9% | 17.7% | -23.4% | -88.3% | · | |
| EBITDA Margin | 33.8% | 35.8% | 36.3% | 39.8% | · | 27.9% | 17.4% | 34.9% | 32.6% | -1.2% | -84.3% | · | |
| ROA | 7.3% | 8.0% | 7.2% | 8.9% | · | 2.1% | -0.46% | 7.2% | 5.6% | -10.2% | -24.9% | · | |
| ROE | 22.8% | 25.7% | 23.3% | 30.3% | · | 8.9% | -2.0% | 32.6% | 29.9% | -58.0% | -92.6% | · | |
| ROIC | 15.0% | 16.4% | 14.8% | 17.8% | · | 5.8% | -3.8% | 16.9% | 12.8% | -14.8% | -41.8% | · |
Ліквідність та платоспроможність
| Метрика | Тенденція | 2025 | 2024 | 2023 | 2022 | 2021 | 2020 | 2019 | 2018 | 2017 | 2016 | 2015 | 2014 |
|---|---|---|---|---|---|---|---|---|---|---|---|---|---|
| Current Ratio | 2.3 | 2.4 | 2.4 | 2.5 | · | 2.7 | 2.5 | 3.2 | 2.1 | 2.4 | 1.7 | · | |
| Quick Ratio | 0.8 | 0.8 | 1.0 | 1.5 | · | 1.3 | 0.9 | 1.5 | 1.1 | 1.3 | 0.2 | · | |
| Debt / Equity | 0.5 | 0.5 | 0.6 | 0.7 | · | 1.0 | 1.1 | 1.1 | 1.5 | 2.4 | 2.5 | · | |
| LT Debt / Equity | 0.5 | 0.5 | 0.5 | 0.6 | · | 1.0 | 1.1 | 1.1 | 1.5 | 2.4 | 2.5 | · |
Ефективність
| Метрика | Тенденція | 2025 | 2024 | 2023 | 2022 | 2021 | 2020 | 2019 | 2018 | 2017 | 2016 | 2015 | 2014 |
|---|---|---|---|---|---|---|---|---|---|---|---|---|---|
| Asset Turnover | 0.5 | 0.5 | 0.4 | 0.5 | · | 0.3 | 0.4 | 0.5 | 0.4 | 0.4 | 0.3 | · | |
| Receivables Turnover | 33.3 | 28.5 | 18.0 | 18.2 | · | 17.4 | 18.3 | 17.3 | 13.8 | 16.7 | 19.3 | · |
На акцію
| Метрика | Тенденція | 2025 | 2024 | 2023 | 2022 | 2021 | 2020 | 2019 | 2018 | 2017 | 2016 | 2015 | 2014 |
|---|---|---|---|---|---|---|---|---|---|---|---|---|---|
| Revenue / Share | $17.96 | $17.62 | $15.84 | $15.70 | · | $9.72 | $9.93 | $12.78 | $11.28 | · | $14.67 | · | |
| Cash Flow / Share | $3.89 | $4.96 | $3.66 | $3.54 | · | $2.06 | $1.02 | $2.65 | $3.22 | · | $2.98 | · | |
| Dividend / Share | $0.60 | $0.60 | $0.60 | $0.60 | $0.38 | $0.00 | $0.20 | $0.20 | $0.00 | $0.00 | $0.26 | $1.25 | |
| EPS (TTM) | $1.59 | $1.41 | $1.28 | $2.83 | $2.90 | $0.41 | $-0.17 | $1.78 | $1.25 | $-3.16 | $-11.31 | $-1.26 |
Темпи зростання
| Метрика | Тенденція | 2025 | 2024 | 2023 | 2022 | 2021 | 2020 | 2019 | 2018 | 2017 | 2016 | 2015 | 2014 |
|---|---|---|---|---|---|---|---|---|---|---|---|---|---|
| Revenue YoY | 1.8% | 11.4% | 0.33% | -0.28% | 60.9% | · | · | · | · | · | · | · | |
| Revenue CAGR 3Y | 4.4% | 3.7% | 17.2% | · | · | · | · | · | · | · | · | · | |
| Revenue CAGR 5Y | 12.8% | · | · | · | · | · | · | · | · | · | · | · | |
| EPS YoY | · | · | · | · | 607.3% | · | · | · | · | · | · | · | |
| Net Income YoY | -5.6% | 17.3% | -16.2% | -16.5% | 520.2% | · | · | · | · | · | · | · | |
| Net Income CAGR 3Y | -2.5% | -6.4% | 63.1% | · | · | · | · | · | · | · | · | · | |
| Net Income CAGR 5Y | 36.9% | · | · | · | · | · | · | · | · | · | · | · |
Оцінка (TTM)
| Метрика | Тенденція | 2025 | 2024 | 2023 | 2022 | 2021 | 2020 | 2019 | 2018 | 2017 | 2016 | 2015 | 2014 |
|---|---|---|---|---|---|---|---|---|---|---|---|---|---|
| Revenue TTM | $25.91B | $25.45B | $22.86B | $22.78B | $22.84B | $14.20B | $14.40B | $18.63B | $16.40B | $14.83B | $14.61B | $20.00B | |
| Net Income TTM | $4.15B | $4.40B | $3.75B | $4.48B | $5.37B | $865M | $-189M | $2.89B | $2.10B | $-4.03B | $-12.09B | $-745M | |
| P/E | 31.9 | 27.0 | 33.3 | 13.4 | 14.4 | 63.5 | -77.2 | 5.8 | 15.2 | -4.2 | -0.6 | -18.5 | |
| Earnings Yield | 3.1% | 3.7% | 3.0% | 7.4% | 7.0% | 1.6% | -1.3% | 17.3% | 6.6% | -24.0% | -167.1% | -5.4% | |
| Payout Ratio | 20.8% | 19.7% | · | · | · | 8.4% | -110.0% | 17.1% | 8.4% | -17.4% | -6.0% | · | |
| Annual Payout | $865M | $865M | $863M | $866M | $1.00B | $0 | $0 | $218M | $176M | $699M | $725M | $1.73B |
Звіт про прибутки та збитки
| Метрика | Тенденція | Q2 2026 | Q1 2026 | Q4 2025 | Q3 2025 | Q2 2025 | Q1 2025 | Q4 2024 | Q3 2024 | Q2 2024 | Q1 2024 | Q4 2023 | Q3 2023 | Q2 2023 | Q1 2023 | Q4 2022 | Q3 2022 |
|---|---|---|---|---|---|---|---|---|---|---|---|---|---|---|---|---|---|
| Revenue | $7.03B | $6.23B | $5.63B | $6.97B | $7.58B | $5.73B | $5.72B | $6.79B | $6.62B | $6.32B | $5.91B | $5.82B | $5.74B | $5.39B | $5.76B | $5.00B | |
| Cost of Revenue | $4.84B | $4.58B | $4.62B | $4.83B | $4.95B | $4.22B | $4.29B | $4.68B | $4.38B | $4.44B | $3.95B | $4.09B | $4.10B | $3.56B | $4.02B | $3.90B | |
| SG&A Expense | $135M | $162M | $133M | $131M | $127M | $154M | $129M | $117M | $123M | $144M | $120M | $118M | $115M | $126M | $107M | $98M | |
| Operating Expenses | $5.03B | $4.10B | $4.82B | $5.00B | $5.15B | $4.42B | $4.48B | $4.85B | $4.58B | $4.69B | $4.18B | $4.33B | $4.33B | $3.79B | $4.23B | $4.04B | |
| Operating Income | $2.00B | $2.14B | $811M | $1.97B | $2.43B | $1.30B | $1.24B | $1.94B | $2.05B | $1.63B | $1.72B | $1.49B | $1.41B | $1.60B | $1.53B | $962M | |
| Other Non-op | $22M | $11M | $65M | $59M | $41M | $58M | $67M | $97M | $69M | $129M | $103M | $71M | $24M | $88M | $140M | $25M | |
| Pretax Income | $1.93B | $2.03B | $766M | $1.92B | $2.39B | $1.29B | $1.24B | $1.96B | $2.03B | $1.67B | $1.73B | $1.47B | $1.27B | $1.54B | $1.54B | $867M | |
| Income Tax | $544M | $653M | $202M | $669M | $850M | $500M | $520M | $737M | $754M | $512M | $724M | $508M | $539M | $499M | $557M | $315M | |
| Net Income | $984M | $1.39B | $565M | $1.25B | $772M | $793M | $721M | $1.24B | $1.28B | $1.16B | $1.01B | $964M | $731M | $1.05B | $977M | $560M | |
| EPS (Basic) | $0.68 | $0.61 | · | $0.46 | $0.53 | $0.24 | · | $0.36 | $0.42 | $0.33 | · | $0.31 | $0.24 | $0.46 | · | $0.28 | |
| EPS (Diluted) | $0.68 | $0.61 | · | $0.46 | $0.53 | $0.24 | · | $0.36 | $0.42 | $0.32 | · | $0.31 | $0.23 | $0.46 | · | $0.28 | |
| Shares (Basic) | 1,438,000,000 | 1,439,000,000 | · | 1,437,000,000 | 1,437,000,000 | 1,438,000,000 | · | 1,438,000,000 | 1,438,000,000 | 1,436,000,000 | · | 1,435,000,000 | 1,434,000,000 | 1,433,000,000 | · | 1,431,000,000 | |
| Shares (Diluted) | 1,443,000,000 | 1,444,000,000 | · | 1,443,000,000 | 1,443,000,000 | 1,444,000,000 | · | 1,444,000,000 | 1,445,000,000 | 1,444,000,000 | · | 1,443,000,000 | 1,442,000,000 | 1,443,000,000 | · | 1,439,000,000 | |
| EBITDA | $2.00B | $2.65B | · | $1.97B | $2.43B | $1.77B | · | $1.94B | $2.05B | $2.23B | · | $1.49B | $1.41B | $2.00B | · | $962M |
Баланс
| Метрика | Тенденція | Q2 2026 | Q1 2026 | Q4 2025 | Q3 2025 | Q2 2025 | Q1 2025 | Q4 2024 | Q3 2024 | Q2 2024 | Q1 2024 | Q4 2023 | Q3 2023 | Q2 2023 | Q1 2023 | Q4 2022 | Q3 2022 |
|---|---|---|---|---|---|---|---|---|---|---|---|---|---|---|---|---|---|
| Cash & Equivalents | $4.08B | $3.74B | $3.82B | $4.32B | $4.49B | $4.38B | $3.92B | $5.00B | $5.27B | $5.21B | · | $5.75B | $6.68B | $6.85B | · | $8.58B | |
| Receivables | $716M | $681M | $977M | $916M | $941M | $743M | $578M | $979M | $1.13B | $1.49B | · | $792M | $675M | $1.13B | · | $844M | |
| Other Current Assets | $573M | $609M | $580M | $554M | $547M | $575M | $535M | $436M | $389M | $385M | · | $406M | $472M | $473M | · | $647M | |
| Current Assets | $14.16B | $14.09B | $13.79B | $13.56B | $13.64B | $13.80B | $13.30B | $14.54B | $14.72B | $14.84B | · | $14.08B | $14.06B | $14.75B | · | $15.37B | |
| PP&E (Net) | $41.70B | $41.10B | $40.74B | $40.26B | $39.84B | $39.20B | $38.51B | $37.75B | $36.78B | $36.20B | · | $34.53B | $33.84B | $33.16B | · | $31.81B | |
| PP&E (Gross) | · | · | $66.43B | · | · | · | $62.34B | · | · | · | · | · | · | · | · | · | |
| Accum. Depreciation | · | · | $25.69B | · | · | · | $23.83B | · | · | · | · | · | · | · | · | · | |
| Intangibles | · | · | $432M | · | · | · | $428M | · | · | · | · | · | · | · | · | · | |
| Other Non-current Assets | $1.72B | $1.72B | $1.66B | $1.92B | $1.90B | $1.85B | $1.51B | $1.85B | $1.84B | $1.85B | · | $1.71B | $1.76B | $1.77B | · | $1.55B | |
| Total Assets | $59.73B | $58.84B | $58.17B | $56.83B | $56.49B | $56.02B | $54.85B | $55.40B | $54.63B | $54.20B | $52.51B | $51.65B | $50.91B | $50.91B | $51.09B | $49.93B | |
| Accounts Payable | $4.58B | $4.14B | $2.95B | $4.10B | $4.29B | $4.08B | $2.79B | $3.82B | $3.91B | $3.67B | · | $3.72B | $3.64B | $3.84B | · | $3.95B | |
| Current Liabilities | $6.86B | $5.91B | $6.02B | $5.53B | $5.53B | $5.94B | $5.50B | $6.25B | $6.14B | $6.30B | · | $4.86B | $4.79B | $5.28B | · | $6.00B | |
| Capital Leases | $973M | $987M | $1.01B | · | · | · | $692M | · | · | · | · | · | · | · | · | · | |
| Deferred Tax | $4.66B | $4.64B | $4.62B | $4.36B | $4.41B | $4.40B | $4.38B | $4.49B | $4.49B | $4.50B | · | $4.40B | $4.34B | $4.30B | · | $4.32B | |
| Other Non-current Liabilities | $1.24B | $1.29B | $1.30B | $2.17B | $2.18B | $2.13B | $1.20B | $1.78B | $1.58B | $1.57B | · | $1.70B | $1.73B | $1.60B | · | $1.55B | |
| Total Liabilities | $27.50B | $27.33B | $27.40B | $26.43B | $26.50B | $26.81B | $26.07B | $26.53B | $25.95B | $26.09B | · | $24.97B | $24.88B | $25.26B | · | $25.75B | |
| Long-term Debt | $9.39B | $9.41B | $9.38B | $9.30B | $9.25B | $9.40B | $8.95B | $9.68B | $9.43B | $9.43B | · | $9.40B | $9.49B | $9.63B | · | $10.69B | |
| Total Debt | $9.39B | $9.41B | · | $9.30B | $9.25B | $9.40B | · | $9.68B | $9.43B | $9.43B | · | $9.40B | $9.49B | $9.63B | · | $10.69B | |
| Common Stock | $163M | $163M | $163M | $163M | $163M | $163M | $162M | $162M | $162M | $162M | · | $162M | $162M | $162M | · | $161M | |
| Paid-in Capital | $23.66B | $23.71B | $23.68B | $23.66B | $23.64B | $23.63B | $23.80B | $24.00B | $24.32B | $24.49B | · | $24.83B | $25.03B | $25.23B | · | $25.48B | |
| Retained Earnings | $2.82B | $2.05B | $1.39B | $1.20B | $738M | $182M | $-170M | $-444M | $-970M | $-1.59B | · | $-2.45B | $-2.90B | $-3.24B | · | $-4.60B | |
| Treasury Stock | $6.23B | $6.12B | $6.02B | $6.02B | $6.02B | $5.97B | $5.89B | $5.89B | $5.83B | $5.82B | · | $5.77B | $5.77B | $5.77B | · | $5.70B | |
| AOCI | $-303M | $-304M | $-305M | $-310M | $-311M | $-313M | $-314M | $-273M | $-274M | $-274M | · | $-317M | $-318M | $-319M | · | $-385M | |
| Stockholders' Equity | $20.11B | $19.50B | $18.90B | $18.68B | $18.21B | $17.69B | $17.58B | $17.55B | $17.40B | $16.97B | · | $16.46B | $16.20B | $16.06B | · | $14.95B | |
| Liabilities + Equity | $59.73B | $58.84B | $58.17B | $56.83B | $56.49B | $56.02B | $54.85B | $55.40B | $54.63B | $54.20B | · | $51.65B | $50.91B | $50.91B | · | $49.93B |
Грошовий потік
| Метрика | Тенденція | Q2 2026 | Q1 2026 | Q4 2025 | Q3 2025 | Q2 2025 | Q1 2025 | Q4 2024 | Q3 2024 | Q2 2024 | Q1 2024 | Q4 2023 | Q3 2023 | Q2 2023 | Q1 2023 | Q4 2022 | Q3 2022 |
|---|---|---|---|---|---|---|---|---|---|---|---|---|---|---|---|---|---|
| D&A | $523M | $514M | $485M | $625M | $668M | $466M | $537M | $600M | $509M | $595M | $589M | $533M | $547M | $399M | $515M | $508M | |
| Stock-based Comp | $35M | $68M | $23M | $24M | $20M | $54M | $15M | $17M | $24M | $53M | $20M | $17M | $19M | $53M | $20M | $13M | |
| Other Non-cash | · | $-474M | · | · | · | $-255M | · | · | · | $86M | · | · | · | $-451M | · | · | |
| Operating Cash Flow | $2.05B | $1.50B | $693M | $1.66B | $2.19B | $1.06B | $1.44B | $1.87B | $1.96B | $1.90B | $1.32B | $1.24B | $1.67B | $1.05B | $1.07B | $758M | |
| CapEx | · | $973M | $1.00B | $1.06B | $1.26B | $1.17B | $1.24B | $1.20B | $1.12B | $1.25B | $1.36B | $1.18B | $1.16B | $1.12B | $1.05B | $836M | |
| Investing Cash Flow | $-1.19B | $-985M | $-1.03B | $-1.01B | $-1.26B | $-1.18B | $-1.23B | $-1.41B | $-1.11B | $-1.28B | $-1.37B | $-1.22B | $-1.20B | $-1.16B | $-1.06B | $-851M | |
| Stock Repurchased | $110M | $93M | $0 | $0 | $52M | $55M | $0 | $59M | $0 | $0 | $0 | $0 | $0 | $0 | $0 | $162M | |
| Net Stock Activity | · | $-93M | · | · | · | $-55M | · | · | · | · | · | · | · | $0 | · | · | |
| Dividends Paid | $216M | $218M | $216M | $216M | $215M | $218M | $216M | $216M | $215M | $218M | $216M | $215M | $215M | $217M | $214M | $214M | |
| Financing Cash Flow | $-514M | $-534M | $-143M | $-825M | $-1.06B | $155M | $-1.51B | $-646M | $-786M | $-342M | $-424M | $-414M | $-640M | $-1.17B | $-444M | $-828M | |
| Net Change in Cash | $342M | $-24M | $-480M | $-171M | $-124M | $37M | $-1.30B | $-186M | $62M | $277M | $-476M | $-397M | $-168M | $-1.29B | $-434M | $-921M | |
| Free Cash Flow | · | $522M | · | · | · | $-114M | · | · | · | $642M | · | · | · | $-71M | · | · |
Прибутковість
| Метрика | Тенденція | Q2 2026 | Q1 2026 | Q4 2025 | Q3 2025 | Q2 2025 | Q1 2025 | Q4 2024 | Q3 2024 | Q2 2024 | Q1 2024 | Q4 2023 | Q3 2023 | Q2 2023 | Q1 2023 | Q4 2022 | Q3 2022 |
|---|---|---|---|---|---|---|---|---|---|---|---|---|---|---|---|---|---|
| Operating Margin | 28.5% | 34.3% | · | 28.3% | 32.1% | 22.8% | · | 28.5% | 30.9% | 25.9% | · | 25.6% | 24.6% | 29.7% | · | 19.2% | |
| Net Margin | 14.0% | 22.2% | · | 17.9% | 20.4% | 13.8% | · | 18.2% | 19.3% | 18.4% | · | 16.6% | 12.7% | 19.5% | · | 11.2% | |
| Pretax Margin | 27.5% | 32.6% | · | 27.6% | 31.5% | 22.5% | · | 28.9% | 30.6% | 26.5% | · | 25.3% | 22.1% | 28.5% | · | 17.3% | |
| EBITDA Margin | 28.5% | 42.5% | · | 28.3% | 32.1% | 30.9% | · | 28.5% | 30.9% | 35.3% | · | 25.6% | 24.6% | 37.1% | · | 19.2% | |
| ROA | 1.7% | 2.4% | · | 2.2% | 2.8% | 1.4% | · | 2.3% | 2.4% | 2.2% | · | 1.9% | 1.5% | 2.1% | · | 1.2% | |
| ROE | 5.1% | 7.5% | · | 6.9% | 8.7% | 4.6% | · | 7.3% | 7.6% | 7.0% | · | 6.1% | 4.7% | 6.8% | · | 4.0% | |
| ROIC | 4.9% | 5.0% | · | 4.6% | 5.7% | 2.9% | · | 4.5% | 4.8% | 4.3% | · | 3.8% | 3.1% | 4.2% | · | 2.4% |
Ліквідність та платоспроможність
| Метрика | Тенденція | Q2 2026 | Q1 2026 | Q4 2025 | Q3 2025 | Q2 2025 | Q1 2025 | Q4 2024 | Q3 2024 | Q2 2024 | Q1 2024 | Q4 2023 | Q3 2023 | Q2 2023 | Q1 2023 | Q4 2022 | Q3 2022 |
|---|---|---|---|---|---|---|---|---|---|---|---|---|---|---|---|---|---|
| Current Ratio | 2.1 | 2.4 | · | 2.5 | 2.5 | 2.3 | · | 2.3 | 2.4 | 2.4 | · | 2.9 | 2.9 | 2.8 | · | 2.6 | |
| Quick Ratio | 0.7 | 0.7 | · | 0.9 | 1.0 | 0.9 | · | 1.0 | 1.0 | 1.1 | · | 1.3 | 1.5 | 1.5 | · | 1.6 | |
| Debt / Equity | 0.5 | 0.5 | · | 0.5 | 0.5 | 0.5 | · | 0.6 | 0.5 | 0.6 | · | 0.6 | 0.6 | 0.6 | · | 0.7 | |
| LT Debt / Equity | 0.4 | 0.5 | · | 0.5 | 0.5 | 0.5 | · | 0.5 | 0.5 | 0.5 | · | 0.6 | 0.6 | 0.6 | · | 0.6 |
Ефективність
| Метрика | Тенденція | Q2 2026 | Q1 2026 | Q4 2025 | Q3 2025 | Q2 2025 | Q1 2025 | Q4 2024 | Q3 2024 | Q2 2024 | Q1 2024 | Q4 2023 | Q3 2023 | Q2 2023 | Q1 2023 | Q4 2022 | Q3 2022 |
|---|---|---|---|---|---|---|---|---|---|---|---|---|---|---|---|---|---|
| Asset Turnover | 0.1 | 0.1 | · | 0.1 | 0.1 | 0.1 | · | 0.1 | 0.1 | 0.1 | · | 0.1 | 0.1 | 0.1 | · | 0.1 | |
| Receivables Turnover | 8.5 | 8.8 | · | 7.4 | 7.3 | 5.1 | · | 7.7 | 7.3 | 4.8 | · | 7.1 | 6.9 | 4.0 | · | 5.6 |
На акцію
| Метрика | Тенденція | Q2 2026 | Q1 2026 | Q4 2025 | Q3 2025 | Q2 2025 | Q1 2025 | Q4 2024 | Q3 2024 | Q2 2024 | Q1 2024 | Q4 2023 | Q3 2023 | Q2 2023 | Q1 2023 | Q4 2022 | Q3 2022 |
|---|---|---|---|---|---|---|---|---|---|---|---|---|---|---|---|---|---|
| Revenue / Share | $4.87 | $4.32 | · | $4.83 | $5.25 | $3.97 | · | $4.70 | $4.58 | $4.38 | · | $4.04 | $3.98 | $3.73 | · | $3.48 | |
| Cash Flow / Share | · | $1.04 | · | · | · | $0.73 | · | · | · | $1.31 | · | · | · | $0.73 | · | · | |
| Dividend / Share | $0.15 | $0.15 | $0.15 | $0.15 | $0.15 | $0.15 | $0.15 | $0.15 | $0.15 | $0.15 | $0.15 | $0.15 | $0.15 | $0.15 | $0.15 | $0.15 |
Оцінка (TTM)
| Метрика | Тенденція | Q2 2026 | Q1 2026 | Q4 2025 | Q3 2025 | Q2 2025 | Q1 2025 | Q4 2024 | Q3 2024 | Q2 2024 | Q1 2024 | Q4 2023 | Q3 2023 | Q2 2023 | Q1 2023 | Q4 2022 | Q3 2022 |
|---|---|---|---|---|---|---|---|---|---|---|---|---|---|---|---|---|---|
| Revenue TTM | $25.87B | $26.42B | · | $26.00B | $25.82B | $24.86B | · | $25.64B | $24.67B | $23.79B | · | $22.71B | $21.89B | $21.57B | · | $23.19B | |
| Net Income TTM | $4.18B | $3.97B | · | $3.53B | $3.52B | $4.03B | · | $4.68B | $4.41B | $3.86B | · | $3.72B | $3.32B | $3.62B | · | $4.86B | |
| Payout Ratio | · | 15.7% | · | · | · | 27.5% | · | · | · | 18.8% | · | · | · | 20.7% | · | · | |
| Annual Payout | $866M | $865M | · | $865M | $865M | $865M | · | $865M | $864M | $864M | · | $861M | $860M | $863M | · | $1.43B |
Найновіший період ліворуч · нульові значення показані як ·
Фінансова звітність Звіт про прибутки та збитки, баланс, рух грошових коштів — річні, за останні 5 років
| Метрика | 2025-12-31 | 2025-06-30 | 2025-03-31 | 2024-12-31 | 2024-09-30 |
|---|---|---|---|---|---|
| Виручка | $25.91B | · | · | $25.45B | · |
| Операційна маржа % | 25.1% | · | · | 27.0% | · |
| Чистий прибуток | $4.15B | · | · | $4.40B | · |
| Метрика | 2025-12-31 | 2025-06-30 | 2025-03-31 | 2024-12-31 | 2024-09-30 |
|---|---|---|---|---|---|
| Борг / Власний капітал | 0.5 | · | · | 0.5 | · |
| Поточний коефіцієнт | 2.3 | · | · | 2.4 | · |
| Коефіцієнт швидкої ліквідності | 0.8 | · | · | 0.8 | · |
| Метрика | 2025-12-31 | 2025-06-30 | 2025-03-31 | 2024-12-31 | 2024-09-30 |
|---|---|---|---|---|---|
| Вільний грошовий потік | $1.12B | · | · | $2.35B | · |
Інституційні власники (13F) 2 084 подавачі звітності · $89.1B всього · Станом на 30 вересня 2026 р.
Інституційні інвестори, які звітують про володіння цими акціями у своїй квартальній формі SEC 13F. Тільки довгі позиції; один подавець звітності може з'явитися двічі для окремих опціонних контрактів. Великі протилежні опціонні позиції (пут/кол) зазвичай відображають маркет-мейкінг або хеджування запасів, а не спрямованість переконань.
| Нові позиції | Закриті позиції | Збільшено | Зменшено | Зміна чистих акцій |
|---|---|---|---|---|
| 193 (-141 проти попереднього кв.) | 123 (-5 проти попереднього кв.) | 863 (+106 проти попереднього кв.) | 637 (+7 проти попереднього кв.) | +28.0M |
Порівняно з Q1 2026. Звіти SEC Form 13F подаються протягом 45 днів після закінчення кварталу плюс невеликий буфер для тих, хто подає із запізненням — квартали, що ще знаходяться в цьому вікні, пропускаються на користь останньої повністю звітної пари.
| Інституційний інвестор | Вартість | Акції | % від відстежуваного 13F | Тип |
|---|---|---|---|---|
| BlackRock, Inc. | $7 669 731 327 | 121 954 704 | 8,61% | Акції |
| VANGUARD GROUP INC | $6 619 610 886 | 130 332 957 | 7,43% | Акції |
| VANGUARD CAPITAL MANAGEMENT LLC | $5 905 710 355 | 93 905 396 | 6,63% | Акції |
| Fisher Asset Management, LLC | $4 208 725 507 | 66 922 014 | 4,72% | Акції |
| STATE STREET CORP | $4 181 268 315 | 66 485 424 | 4,69% | Акції |
| Capital Research Global Investors | $2 610 093 764 | 41 503 051 | 2,93% | Акції |
| FRANKLIN RESOURCES INC | $2 350 898 987 | 37 381 125 | 2,64% | Акції |
| BANK OF AMERICA CORP /DE/ | $2 289 269 804 | 36 401 174 | 2,57% | Акції |
| GEODE CAPITAL MANAGEMENT, LLC | $2 037 971 231 | 32 558 233 | 2,29% | Акції |
| JPMORGAN CHASE & CO | $1 910 136 504 | 30 998 642 | 2,14% | Акції |
| MORGAN STANLEY | $1 634 770 521 | 25 994 123 | 1,83% | Акції |
| VANGUARD PORTFOLIO MANAGEMENT LLC | $1 516 742 217 | 24 117 383 | 1,70% | Акції |
| FMR LLC | $1 314 708 907 | 20 904 897 | 1,48% | Акції |
| Bank of New York Mellon Corp | $1 196 908 815 | 19 031 782 | 1,34% | Акції |
| JANE STREET GROUP, LLC | $1 061 356 796 | 16 876 400 | 1,19% | Опціон пут |
| VICTORY CAPITAL MANAGEMENT INC | $1 026 335 728 | 16 319 528 | 1,15% | Акції |
| NORTHERN TRUST CORP | $941 444 245 | 14 969 697 | 1,06% | Акції |
| WELLINGTON MANAGEMENT GROUP LLP | $938 197 171 | 14 918 066 | 1,05% | Акції |
| GOLDMAN SACHS GROUP INC | $854 286 226 | 13 583 816 | 0,96% | Акції |
| Invesco Ltd. | $851 841 069 | 13 544 937 | 0,96% | Акції |
| DIMENSIONAL FUND ADVISORS LP | $811 837 806 | 12 910 689 | 0,91% | Акції |
| AQR CAPITAL MANAGEMENT LLC | $746 531 875 | 11 927 335 | 0,84% | Акції |
| Amundi | $743 353 384 | 11 819 898 | 0,83% | Акції |
| MILLENNIUM MANAGEMENT LLC | $720 239 549 | 11 452 370 | 0,81% | Акції |
| UBS Group AG | $690 281 772 | 10 976 018 | 0,77% | Акції |
| JANUS HENDERSON GROUP PLC | $675 896 290 | 11 498 267 | 0,76% | Акції |
| JANE STREET GROUP, LLC | $641 113 238 | 10 194 200 | 0,72% | Опціон кол |
| BARROW HANLEY MEWHINNEY & STRAUSS LLC | $627 068 140 | 9 970 872 | 0,70% | Акції |
| Nuveen, LLC | $625 420 934 | 9 944 681 | 0,70% | Акції |
| CHARLES SCHWAB INVESTMENT MANAGEMENT INC | $590 014 735 | 9 381 694 | 0,66% | Акції |
| AMERIPRISE FINANCIAL INC | $587 057 528 | 9 342 718 | 0,66% | Акції |
| Crake Asset Management LLP | $583 332 044 | 9 275 434 | 0,65% | Акції |
| Boston Partners | $577 446 188 | 9 187 889 | 0,65% | Акції |
| VANGUARD FIDUCIARY TRUST CO | $507 614 497 | 8 071 466 | 0,57% | Акції |
| SUSQUEHANNA INTERNATIONAL GROUP, LLP | $490 611 179 | 7 801 100 | 0,55% | Опціон кол |
| Clearbridge Investments, LLC | $489 434 530 | 7 782 390 | 0,55% | Акції |
| DZ BANK AG Deutsche Zentral Genossenschafts Bank, Frankfurt am Main | $464 906 857 | 7 392 451 | 0,52% | Акції |
| MIRAE ASSET GLOBAL ETFS HOLDINGS Ltd. | $453 066 327 | 7 206 154 | 0,51% | Акції |
| Legal & General Group Plc | $429 671 334 | 6 832 109 | 0,48% | Акції |
| SUSQUEHANNA INTERNATIONAL GROUP, LLP | $422 293 772 | 6 714 800 | 0,47% | Опціон пут |
| BANK OF MONTREAL /CAN/ | $411 476 548 | 6 542 798 | 0,46% | Акції |
| UBS AM, a distinct business unit of UBS ASSET MANAGEMENT AMERICAS LLC | $387 146 418 | 6 586 363 | 0,43% | Акції |
| ROYAL BANK OF CANADA | $371 804 000 | 5 911 977 | 0,42% | Акції |
| TWO SIGMA INVESTMENTS, LP | $350 562 444 | 5 574 216 | 0,39% | Акції |
| CITIGROUP INC | $346 090 121 | 5 503 102 | 0,39% | Акції |
| D. E. Shaw & Co., Inc. | $335 388 597 | 5 332 940 | 0,38% | Акції |
| Capital Wealth Planning, LLC | $334 722 619 | 5 322 350 | 0,38% | Акції |
| CITADEL ADVISORS LLC | $321 720 084 | 5 115 600 | 0,36% | Опціон кол |
| NEUBERGER BERMAN GROUP LLC | $319 484 960 | 5 090 048 | 0,36% | Акції |
| BARCLAYS PLC | $312 599 838 | 4 970 581 | 0,35% | Акції |
Активісти та власники %+ 5 9 холдингів
Інвестори, які подали Розклад SEC 13D — бенефіціарна власність понад 5% з наміром вплинути на емітента (активістські частки, кампанії в раді директорів, M&A). Кожен рядок показує останній відомий стан позиції цього подавця.
| Подавець | Подано | Частка | Статус | Мета | Подача |
|---|---|---|---|---|---|
| High River Limited Partnership, Hopper Investments LLC, Barberry Corp., Icahn Partners Master Fund LP, Icahn Offshore LP, Icahn Partners LP, Icahn Onshore LP, Icahn Capital LP, IPH GP LLC, Icahn Enterprises Holdings L.P., Icahn Enterprises G.P. Inc., Beckton Corp., Carl C. Icahn ×7 подання | 15 лютого 2018 р. | · | Первинна подача | · | SEC |
| 13 вересня 2016 р. | · | Первинна подача | · | SEC | |
| 07 жовтня 2015 р. | · | Первинна подача | · | SEC | |
| Freeport-McMoRan Copper & Gold Inc. (2), Freeport-McMoRan Preferred LLC (2) ×3 подання | 04 червня 2013 р. | · | Первинна подача | M&A / продаж | SEC |
| Atticus Capital LP, Atticus Management LLC, Timothy R. Barakett ×2 подання | 20 серпня 2007 р. | · | Первинна подача | · | SEC |
| Нерозкрита особа, що звітує | 30 березня 2004 р. | · | Первинна подача | Кампанія в раді директорів | SEC |
| Нерозкрита особа, що звітує | 22 березня 2004 р. | · | Первинна подача | Кампанія в раді директорів | SEC |
| (entity only). James R. Moffett ×3 подання | 14 лютого 2003 р. | · | Первинна подача | · | SEC |
| Нерозкрита особа, що звітує, Нерозкрита особа, що звітує | 13 лютого 2003 р. | · | Первинна подача | · | SEC |
Purpose is an automated classification of the filer's own stated purpose (SEC Item 4) — not investment advice. "—" means no clear purpose was stated or the text could not be classified.
Інсайдери компанії 45 інсайдерів · 7 керівники · 16 директори
| Інсайдер | Роль | Остання активність | Кількість акцій у власності | Купівлі за 12 міс. | Продажі за 12 міс. | Нетто 12 міс |
|---|---|---|---|---|---|---|
| Kathleen L Quirk | President & CEO | 15 лютого 2026 р. F | 2 251 243 | 0 | 0 | $0 |
| James C Flores | CEO of Subsidiary | 31 березня 2016 р. M | 4 325 273 | 0 | 0 | $0 |
| Maree E. Robertson | EVP & CFO | 15 лютого 2026 р. F | 69 540 | 0 | 1 | $-2 985 175 |
| Douglas N. Currault II | EVP & General Counsel | 25 серпня 2026 р. M | 211 016 | 0 | 2 | $-11 123 800 |
| Richard C Adkerson | Chairman of the Board | 07 березня 2026 р. G | 1 638 005 | 0 | 3 | $-25 465 862 |
| Donald C Whitmire JR | VP Controller & Financial Rptg | 04 березня 2022 р. S | 3 700 | 0 | 0 | $0 |
| James R Moffett | Chairman of the Board | 28 серпня 2015 р. P | 107 552 | 0 | 0 | $0 |
| John Joseph Stephens | Директор | 01 жовтня 2026 р. A | 71 798 | 0 | 0 | $0 |
| Hugh Grant | Директор | 01 жовтня 2026 р. A | 50 332 | 0 | 0 | $0 |
| Lydia H Kennard | Директор | 27 серпня 2026 р. S | 122 702 | 0 | 1 | $-300 460 |
| Marcela E Donadio | Директор | 01 червня 2026 р. A | 24 500 | 0 | 0 | $0 |
| Frances F Townsend | Директор | 01 червня 2026 р. A | 127 570 | 0 | 0 | $0 |
| Ryan Michael Lance | Директор | 01 червня 2026 р. A | 23 200 | 0 | 0 | $0 |
| David P Abney | Директор | 01 червня 2026 р. A | 25 200 | 0 | 0 | $0 |
| Dustan E Mccoy | Директор | 01 червня 2026 р. A | 155 100 | 0 | 0 | $0 |
| Sara L Grootwassink | Директор | 01 червня 2026 р. A | 34 000 | 0 | 0 | $0 |
| Robert W. Dudley | Директор | 01 червня 2025 р. A | 22 400 | 0 | 0 | $0 |
| B M Rankin JR | Директор | 03 червня 2013 р. A | 139 600 | 0 | 0 | $0 |
| Oscar Y L Groeneveld | Директор | 01 серпня 2003 р. A | · | 0 | 0 | $0 |
| Leigh R Clifford | Директор | 01 серпня 2003 р. A | · | 0 | 0 | $0 |
| Rio Tinto plc | Власник 10% | 30 березня 2004 р. S | 0 | 0 | 0 | $0 |
| Ellie L. Mikes | · | 05 серпня 2026 р. S | 36 000 | 0 | 3 | $-1 472 642 |
| Stephen T. Higgins | · | 05 серпня 2026 р. S | 54 618 | 0 | 4 | $-4 700 124 |
| Gerald J. Ford | · | 07 червня 2021 р. S | 0 | 0 | 0 | $0 |
| Harry M. Conger IV | · | 15 лютого 2020 р. F | 360 041 | 0 | 0 | $0 |
| Courtney Mather | · | 01 січня 2019 р. A | 154 254 | 0 | 0 | $0 |
| Michael J Arnold | · | 06 лютого 2018 р. A | 361 051 | 0 | 0 | $0 |
| Andrew Langham | · | 01 січня 2018 р. A | 55 061 | 0 | 0 | $0 |
| Jon C/ Madonna | · | 01 червня 2017 р. A | 75 880 | 0 | 0 | $0 |
| Robert J Allison JR | · | 01 жовтня 2015 р. A | 232 116 | 0 | 0 | $0 |
| Stephen H Siegele | · | 01 жовтня 2015 р. A | 284 396 | 0 | 0 | $0 |
| Thomas A Fry III | · | 01 червня 2015 р. A | 54 262 | 0 | 0 | $0 |
| Charles C Krulak | · | 01 червня 2015 р. A | 52 400 | 0 | 0 | $0 |
| Alan R Buckwalter III | · | 01 червня 2015 р. A | 101 910 | 0 | 0 | $0 |
| Bobby Lee Lackey | · | 01 червня 2015 р. A | 63 242 | 0 | 0 | $0 |
| Devon H Graham JR | · | 01 червня 2015 р. A | 66 400 | 0 | 0 | $0 |
| Robert Day | · | 01 червня 2015 р. A | 323 900 | 0 | 0 | $0 |
| Gabrielle K Mcdonald | · | 25 листопада 2013 р. S | 41 626 | 0 | 0 | $0 |
| Bennett J Johnston | · | 07 листопада 2013 р. P | 140 085 | 0 | 0 | $0 |
| Stapleton J Roy | · | 01 жовтня 2013 р. A | 87 962 | 0 | 0 | $0 |
| Taylor J Wharton | · | 26 липня 2013 р. M | 77 440 | 0 | 0 | $0 |
| Timothy R Snider | · | 17 травня 2007 р. M | 20 793 | 0 | 0 | $0 |
| Mark J Johnson | · | 07 лютого 2007 р. M | 14 361 | 0 | 0 | $0 |
| Armando Mahler | · | 01 лютого 2007 р. F | 15 493 | 0 | 0 | $0 |
| Adrianto Machribie | · | 06 лютого 2006 р. M | 0 | 0 | 0 | $0 |
Інсайдери згідно з формами SEC 3/4/5; чистий результат = лише відкритий ринок купівлі/продажу
Присутність в ETF Належить 135 ETF
Вага відображає лише прямі акціонерні володіння (N-PORT); фонди з кредитним плечем або похідними інструментами можуть мати додаткову експозицію за свопами, яка не відображається.
| Фонд | Вага | Одиниці | Станом на | Джерело |
|---|---|---|---|---|
| IYM · iShares Trust | 8,96% | 1 485 957 SH | 11 вересня 2026 р. | Щоденно |
| ICOP · iShares Trust | 7,85% | 551 465 SH | 11 вересня 2026 р. | Щоденно |
| FMAT · FIDELITY COVINGTON TRUST | 6,07% | 560 686 NS | 31 липня 2026 р. | N-PORT |
| PICK · iShares, Inc. | 5,99% | 2 183 146 SH | 11 вересня 2026 р. | Щоденно |
| VAW · VANGUARD WORLD FUND | 5,91% | 4 217 054 SH | 19 серпня 2026 р. | Щоденно |
| EART · Global X Funds | 5,00% | 30 961 NS | 31 липня 2026 р. | N-PORT |
| COPX · Global X Funds | 4,76% | 5 579 023 NS | 31 липня 2026 р. | N-PORT |
| RSPM · Invesco Exchange-Traded Fund Trust | 3,86% | 94 586 SH | 02 жовтня 2026 р. | Щоденно |
| MGNR · AMERICAN BEACON SELECT FUNDS | 3,54% | 476 043 NS | 31 липня 2026 р. | N-PORT |
| TEKX · SSGA Active Trust | 3,50% | 8 912 NS | 31 липня 2026 р. | N-PORT |
| PYZ · Invesco Exchange-Traded Fund Trust | 3,46% | 31 805 SH | 02 жовтня 2026 р. | Щоденно |
| MXI · iShares Trust | 3,20% | 182 316 SH | 11 вересня 2026 р. | Щоденно |
| CBLS · Elevation Series Trust | 2,97% | 26 380 NS | 31 липня 2026 р. | N-PORT |
| CBSE · Elevation Series Trust | 2,72% | 22 462 NS | 31 липня 2026 р. | N-PORT |
| IGE · iShares Trust | 2,49% | 280 810 SH | 11 вересня 2026 р. | Щоденно |
| LSEQ · Harbor ETF Trust | 2,29% | 5 598 NS | 31 липня 2026 р. | N-PORT |
| FXZ · First Trust Exchange-Traded AlphaDE… | 1,70% | 99 677 NS | 31 липня 2026 р. | N-PORT |
| GUNR · FlexShares Trust | 1,55% | 1 790 066 NS | 31 липня 2026 р. | N-PORT |
| BOBP · EXCHANGE TRADED CONCEPTS TRUST | 1,52% | 142 NS | 31 липня 2026 р. | N-PORT |
| IMCG · iShares Trust | 1,42% | 794 939 SH | 11 вересня 2026 р. | Щоденно |
| SPHB · Invesco Exchange-Traded Fund Trust … | 1,13% | 157 110 SH | 02 жовтня 2026 р. | Щоденно |
| ALTL · Pacer Funds Trust | 1,02% | 15 054 NS | 31 липня 2026 р. | N-PORT |
| QUVU · Hartford Funds Exchange-Traded Trust | 0,88% | 25 378 NS | 31 липня 2026 р. | N-PORT |
| BKDV · BNY Mellon ETF Trust II | 0,76% | 223 438 NS | 31 липня 2026 р. | N-PORT |
| IMCB · iShares Trust | 0,71% | 168 368 SH | 11 вересня 2026 р. | Щоденно |
| DFLV · Dimensional ETF Trust | 0,71% | 764 788 NS | 31 липня 2026 р. | N-PORT |
| HIBL · Direxion Shares ETF Trust | 0,69% | 8 273 NS | 31 липня 2026 р. | N-PORT |
| HAPI · Harbor ETF Trust | 0,66% | 51 442 NS | 31 липня 2026 р. | N-PORT |
| PDP · Invesco Exchange-Traded Fund Trust | 0,59% | 126 881 SH | 02 жовтня 2026 р. | Щоденно |
| XOEF · iShares Trust | 0,58% | 1 801 SH | 11 вересня 2026 р. | Щоденно |
| FTC · First Trust Exchange-Traded AlphaDE… | 0,57% | 119 380 NS | 31 липня 2026 р. | N-PORT |
| GARP · iShares Trust | 0,52% | 224 221 SH | 11 вересня 2026 р. | Щоденно |
| PALC · Pacer Funds Trust | 0,49% | 16 330 NS | 31 липня 2026 р. | N-PORT |
| DFUV · Dimensional ETF Trust | 0,49% | 1 197 516 NS | 31 липня 2026 р. | N-PORT |
| OEI · Listed Funds Trust | 0,44% | 3 222 NS | 31 липня 2026 р. | N-PORT |
| MGV · VANGUARD WORLD FUND | 0,43% | 903 558 SH | 19 серпня 2026 р. | Щоденно |
| CCNR · Financial Investors Trust | 0,43% | 29 137 NS | 31 липня 2026 р. | N-PORT |
| VFMO · VANGUARD WELLINGTON FUND | 0,40% | 127 125 SH | 19 серпня 2026 р. | Щоденно |
| IWX · iShares Trust | 0,38% | 206 292 SH | 11 вересня 2026 р. | Щоденно |
| IVE · iShares Trust | 0,34% | 2 388 527 SH | 11 вересня 2026 р. | Щоденно |
| JPUS · J.P. Morgan Exchange-Traded Fund Tr… | 0,34% | 24 903 NS | 31 липня 2026 р. | N-PORT |
| VTV · VANGUARD INDEX FUNDS | 0,34% | 13 672 604 SH | 19 серпня 2026 р. | Щоденно |
| IUSV · iShares Trust | 0,33% | 1 257 523 SH | 11 вересня 2026 р. | Щоденно |
| ILCG · iShares Trust | 0,32% | 139 939 SH | 11 вересня 2026 р. | Щоденно |
| ESG · FlexShares Trust | 0,32% | 6 720 NS | 31 липня 2026 р. | N-PORT |
| VOOV · VANGUARD ADMIRAL FUNDS | 0,31% | 331 054 SH | 19 серпня 2026 р. | Щоденно |
| DFVX · Dimensional ETF Trust | 0,29% | 24 711 NS | 31 липня 2026 р. | N-PORT |
| VMAX · Lattice Strategies Trust | 0,28% | 2 233 NS | 31 липня 2026 р. | N-PORT |
| FAD · First Trust Exchange-Traded AlphaDE… | 0,28% | 25 947 NS | 31 липня 2026 р. | N-PORT |
| IWD · iShares Trust | 0,27% | 3 179 378 SH | 11 вересня 2026 р. | Щоденно |
| BSCU · Invesco Exchange-Traded Self-Indexe… | 0,27% | 7 781 000 | 02 жовтня 2026 р. | Щоденно |
| FVAL · FIDELITY COVINGTON TRUST | 0,27% | 57 346 NS | 31 липня 2026 р. | N-PORT |
| FEX · First Trust Exchange-Traded AlphaDE… | 0,27% | 67 216 NS | 31 липня 2026 р. | N-PORT |
| IQSU · New York Life Investments ETF Trust | 0,26% | 13 800 NS | 31 липня 2026 р. | N-PORT |
| PEVC · Pacer Funds Trust | 0,26% | 101 NS | 31 липня 2026 р. | N-PORT |
| VFMF · VANGUARD WELLINGTON FUND | 0,26% | 29 002 SH | 19 серпня 2026 р. | Щоденно |
| FQAL · FIDELITY COVINGTON TRUST | 0,26% | 58 567 NS | 31 липня 2026 р. | N-PORT |
| FDMO · FIDELITY COVINGTON TRUST | 0,26% | 37 005 NS | 31 липня 2026 р. | N-PORT |
| VONV · VANGUARD SCOTTSDALE FUNDS | 0,25% | 863 788 SH | 19 серпня 2026 р. | Щоденно |
| EQAL · Invesco Exchange-Traded Fund Trust … | 0,23% | 26 948 SH | 02 жовтня 2026 р. | Щоденно |
| ACVF · ETF Opportunities Trust | 0,22% | 5 437 NS | 31 липня 2026 р. | N-PORT |
| SIZE · iShares Trust | 0,22% | 13 337 SH | 11 вересня 2026 р. | Щоденно |
| EUSA · iShares, Inc. | 0,21% | 56 476 SH | 11 вересня 2026 р. | Щоденно |
| BSCS · Invesco Exchange-Traded Self-Indexe… | 0,21% | 7 456 000 | 02 жовтня 2026 р. | Щоденно |
| PFIG · Invesco Exchange-Traded Fund Trust … | 0,20% | 255 000 | 01 жовтня 2026 р. | Щоденно |
| TOPC · iShares Trust | 0,19% | 873 SH | 11 вересня 2026 р. | Щоденно |
| RSP · Invesco Exchange-Traded Fund Trust | 0,19% | 2 560 375 SH | 02 жовтня 2026 р. | Щоденно |
| QVML · Invesco Exchange-Traded Fund Trust … | 0,18% | 44 208 SH | 02 жовтня 2026 р. | Щоденно |
| IWL · iShares Trust | 0,18% | 55 439 SH | 11 вересня 2026 р. | Щоденно |
| XVV · iShares Trust | 0,17% | 16 484 SH | 11 вересня 2026 р. | Щоденно |
| ESGG · FlexShares Trust | 0,17% | 3 059 NS | 31 липня 2026 р. | N-PORT |
| IUS · Invesco Exchange-Traded Self-Indexe… | 0,17% | 24 161 SH | 02 жовтня 2026 р. | Щоденно |
| MGC · VANGUARD WORLD FUND | 0,17% | 286 949 SH | 19 серпня 2026 р. | Щоденно |
| PRF · Invesco Exchange-Traded Fund Trust | 0,16% | 221 633 SH | 02 жовтня 2026 р. | Щоденно |
| IVV · iShares Trust | 0,16% | 18 119 359 SH | 11 вересня 2026 р. | Щоденно |
| ILCB · iShares Trust | 0,15% | 27 973 SH | 11 вересня 2026 р. | Щоденно |
| PBP · Invesco Exchange-Traded Fund Trust | 0,15% | 8 544 SH | 02 жовтня 2026 р. | Щоденно |
| PBUS · Invesco Exchange-Traded Fund Trust … | 0,15% | 249 071 SH | 02 жовтня 2026 р. | Щоденно |
| ESGV · VANGUARD WORLD FUND | 0,15% | 323 482 SH | 19 серпня 2026 р. | Щоденно |
| IYY · iShares Trust | 0,15% | 61 635 SH | 11 вересня 2026 р. | Щоденно |
| IWB · iShares Trust | 0,15% | 991 489 SH | 11 вересня 2026 р. | Щоденно |
| ACIO · ETF Series Solutions | 0,14% | 53 422 NS | 31 липня 2026 р. | N-PORT |
| DXUV · Dimensional ETF Trust | 0,14% | 12 455 NS | 31 липня 2026 р. | N-PORT |
| CHRI · Global X Funds | 0,14% | 180 NS | 31 липня 2026 р. | N-PORT |
| CATH · Global X Funds | 0,14% | 29 201 NS | 31 липня 2026 р. | N-PORT |
| IWV · iShares Trust | 0,14% | 395 781 SH | 11 вересня 2026 р. | Щоденно |
| VOO · VANGUARD INDEX FUNDS | 0,14% | 37 342 349 SH | 19 серпня 2026 р. | Щоденно |
| VV · VANGUARD INDEX FUNDS | 0,14% | 1 678 954 SH | 19 серпня 2026 р. | Щоденно |
| XYLD · Global X Funds | 0,14% | 72 258 NS | 31 липня 2026 р. | N-PORT |
| XRMI · Global X Funds | 0,14% | 1 114 NS | 31 липня 2026 р. | N-PORT |
| PTLC · Pacer Funds Trust | 0,14% | 72 720 NS | 31 липня 2026 р. | N-PORT |
| BBUS · J.P. Morgan Exchange-Traded Fund Tr… | 0,14% | 198 091 NS | 31 липня 2026 р. | N-PORT |
| ITOT · iShares Trust | 0,14% | 1 871 580 SH | 11 вересня 2026 р. | Щоденно |
| VOXP · Advisors Series Trust | 0,14% | 129 NS | 31 липня 2026 р. | N-PORT |
| ADME · ETF Series Solutions | 0,14% | 6 512 NS | 31 липня 2026 р. | N-PORT |
| DFAU · Dimensional ETF Trust | 0,14% | 275 507 NS | 31 липня 2026 р. | N-PORT |
| VOTE · TCW ETF Trust | 0,14% | 24 295 NS | 31 липня 2026 р. | N-PORT |
| BKLC · BNY Mellon ETF Trust | 0,14% | 121 068 NS | 31 липня 2026 р. | N-PORT |
| XCLR · Global X Funds | 0,14% | 78 NS | 31 липня 2026 р. | N-PORT |
| XTR · Global X Funds | 0,14% | 105 NS | 31 липня 2026 р. | N-PORT |
| XYLG · Global X Funds | 0,14% | 1 388 NS | 31 липня 2026 р. | N-PORT |
| DCOR · Dimensional ETF Trust | 0,13% | 70 098 NS | 31 липня 2026 р. | N-PORT |
| DFUS · Dimensional ETF Trust | 0,13% | 436 964 NS | 31 липня 2026 р. | N-PORT |
| VONE · VANGUARD SCOTTSDALE FUNDS | 0,13% | 236 354 SH | 19 серпня 2026 р. | Щоденно |
| TOV · EA Series Trust | 0,13% | 5 549 NS | 31 липня 2026 р. | N-PORT |
| DFAC · Dimensional ETF Trust | 0,13% | 984 985 NS | 31 липня 2026 р. | N-PORT |
| SPUU · Direxion Shares ETF Trust | 0,13% | 5 424 NS | 31 липня 2026 р. | N-PORT |
| QDPL · Pacer Funds Trust | 0,13% | 34 624 NS | 31 липня 2026 р. | N-PORT |
| PHDG · Invesco Actively Managed Exchange-T… | 0,13% | 1 131 SH | 02 жовтня 2026 р. | Щоденно |
| TOK · iShares Trust | 0,12% | 4 026 SH | 11 вересня 2026 р. | Щоденно |
| VTI · VANGUARD INDEX FUNDS | 0,12% | 45 646 708 SH | 19 серпня 2026 р. | Щоденно |
| VTHR · VANGUARD SCOTTSDALE FUNDS | 0,12% | 120 526 SH | 19 серпня 2026 р. | Щоденно |
| RWL · Invesco Exchange-Traded Fund Trust … | 0,12% | 164 443 SH | 02 жовтня 2026 р. | Щоденно |
| URTH · iShares, Inc. | 0,11% | 128 482 SH | 11 вересня 2026 р. | Щоденно |
| HCMT · Direxion Shares ETF Trust | 0,11% | 10 002 NS | 31 липня 2026 р. | N-PORT |
| SPXL · Direxion Shares ETF Trust | 0,10% | 112 386 NS | 31 липня 2026 р. | N-PORT |
| ACWI · iShares Trust | 0,10% | 455 670 SH | 11 вересня 2026 р. | Щоденно |
| OMFL · Invesco Exchange-Traded Self-Indexe… | 0,10% | 66 519 SH | 02 жовтня 2026 р. | Щоденно |
| TILT · FlexShares Trust | 0,09% | 32 390 NS | 31 липня 2026 р. | N-PORT |
| CRBN · iShares Trust | 0,08% | 13 641 SH | 11 вересня 2026 р. | Щоденно |
| VT · VANGUARD INTERNATIONAL EQUITY INDEX… | 0,08% | 1 199 840 SH | 19 серпня 2026 р. | Щоденно |
| FEUS · FlexShares Trust | 0,03% | 605 NS | 31 липня 2026 р. | N-PORT |
| LGDX · Tidal Trust III | 0,02% | 427 NS | 31 липня 2026 р. | N-PORT |
| BIV · VANGUARD BOND INDEX FUNDS | · | · | 15 липня 2026 р. | Щоденно |
| BLV · VANGUARD BOND INDEX FUNDS | · | · | 15 липня 2026 р. | Щоденно |
| BSV · VANGUARD BOND INDEX FUNDS | · | · | 15 липня 2026 р. | Щоденно |
| BND · VANGUARD BOND INDEX FUNDS | · | · | 15 липня 2026 р. | Щоденно |
| VUSB · VANGUARD BOND INDEX FUNDS | · | · | 15 липня 2026 р. | Щоденно |
| VCRB · VANGUARD MALVERN FUNDS | · | · | 15 липня 2026 р. | Щоденно |
| VSDB · VANGUARD MALVERN FUNDS | · | · | 15 липня 2026 р. | Щоденно |
| VCSH · VANGUARD SCOTTSDALE FUNDS | · | · | 15 липня 2026 р. | Щоденно |
| VCIT · VANGUARD SCOTTSDALE FUNDS | · | · | 15 липня 2026 р. | Щоденно |
| VCLT · VANGUARD SCOTTSDALE FUNDS | · | · | 15 липня 2026 р. | Щоденно |
| VTC · VANGUARD SCOTTSDALE FUNDS | · | · | 30 липня 2026 р. | Щоденно |
| BNDW · VANGUARD SCOTTSDALE FUNDS | · | · | 30 липня 2026 р. | Щоденно |
FCX Консенсус аналітиків Бичачі та ведмежі думки аналітиків, 12-місячна цільова ціна, потенціал зростання
12-місячна цільова ціна
22 аналітиків · 2026-10-02Середня цільова ціна $72.77 +1,0%
Порівняння з аналогами (підгалузь GICS) Ключові показники порівняно з аналогами в секторі
База за фінансовий рік, ціни на момент закриття останнього фінансового року кожної компанії.
| Тікер | Капіталізація | P/E | Виручка рік до року | Чиста маржа | ROE | Валова маржа |
|---|---|---|---|---|---|---|
| FCX | · | 31.9 | 1.8% | 16.0% | 22.8% | · |
| SCCO | · | 27.2 | 17.4% | 32.4% | 43.0% | · |
Останні новини Останні заголовки, що згадують цю компанію
Мої показники Ваш персональний список спостереження — вибрані рядки з Повних фундаментальних даних
Виберіть показники, які для вас важливі — натисніть + поруч із будь-яким рядком у розділі Повна фундаментальна інформація вище.
Ваш вибір збережено і він буде застосовуватися до всіх тікерів.