
CMSD CMS Energy Corporation 5.875% Junior Subordinated Notes due 2079
NYSE · Utilities · Auf SEC EDGAR ansehen ↗ Schließen Okt 2, 2026 10-K/10-Q Jul 28, 2026CMSD Aktien-Snapshot Kurs, Marktkapitalisierung, P/E, EPS, ROE, Schulden/Eigenkapital, 52-Wochen-Spanne
CMSD Aktienkurs-Chart Täglich OHLCV mit technischen Indikatoren — Schwenken, Zoom und Ansicht anpassen
Die Balkengranularität passt sich der ausgewählten Periode an – bewegen Sie den Mauszeiger über das Diagramm, um Eröffnungs-/Höchst-/Tiefst-/Schlusskurse für einen Balken anzuzeigen.
Über CMS Energy Corporation 5.875% Junior Subordinated Notes due 2079 Unternehmensübersicht von Wikipedia
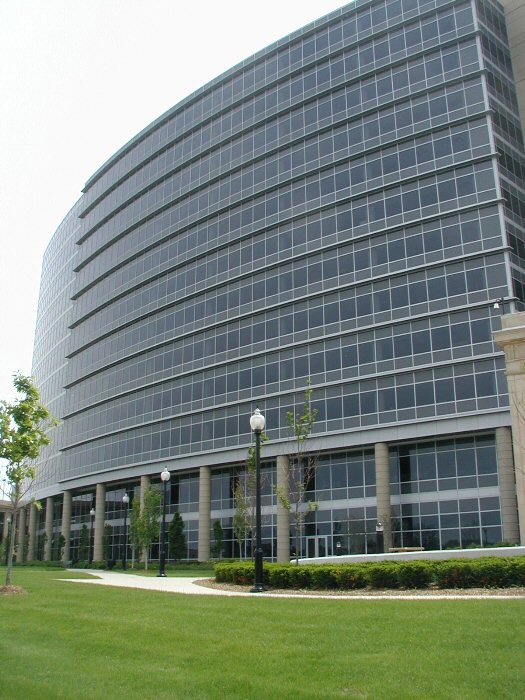
CMS Energy Corporation is an American energy company based in Jackson, Michigan, that is focused principally on utility operations in Michigan. Its principal business is Consumers Energy, a public utility that provides electricity and natural gas to more than 6 million of Michigan's 10 million residents. Its non-utility businesses are focused primarily on domestic independent power production. Consumers Energy has operated since 1886.
NorthStar Clean Energy's primary businesses are independent power production and natural gas transmission.
History
CMS Energy was formed in 1987 as a holding company with its principal subsidiaries as Consumers Energy and NorthStar Clean Energy. On October 23, 1987, CMS Energy became a publicly owned company and was listed at the New York Stock Exchange. The company's history dates back to 1886, when William Augustine Foote and Samuel Jarvis initially approached Jackson, Michigan officials and asked them to support efforts to illuminate Jackson's downtown with electric arc lights. They formed a company, Jackson Electric Light Works in 1888. In 1889, they built a hydro plant project at the Trowbridge Dam on the Kalamazoo River in Allegan. Foote, after seeing some early success, began consolidating his small power companies and formed Commonwealth Power Company.
In 1907, Foote and Jarvis built Croton Hydro project on the Muskegon River, the first project in the world that could transmit 110,000 volts of electricity. In 1920, Foote and Jarvis offered preferred shares of their company to the public to secure sufficient financing to enter other energy and power generation sectors. Over the next decades the company built several coal-fired, natural gas, nuclear and electric facilities. In 1946, the company formed a strategic partnership with Panhandle Company to convert former natural gas fields to underground natural gas storage areas. CMS Energy's primary subsidiary, Consumers Energy, announced Michigan's first nuclear power plant in 1961, Big Rock Point in Charlevoix, Michigan.
The company announced another nuclear plant, Palisades Nuclear Generating Station on Lake Michigan, which first produced electricity in December, 1971 to serve 400,000 people a day. CMS Energy owned the plant until 2006, when it was sold to Entergy. It then announced a gas reforming plant to furnish heat for Michigan homes in 1971. This plant was the first of its kind in North America to produce synthetic gas, converting impure liquid petroleum into pipeline-quality natural gas.
In 1987, CMS Energy, a holding company with its principal subsidiaries as Consumers Power and CMS Enterprises was formed. Consumers Power was rebranded Consumers Energy in 1997. The firm was one of the first companies to introduce an online billing system in the late 1990s.
In 2001, the firm entered into an exploration agreement with Eritrea for oil exploration in the Dismin Block of the Red Sea.
In 2002, CMS Energy founded EnerBank USA.
In 2003, the firm moved its headquarters to One Energy Plaza in Jackson, Michigan. In 2007, the company announced plans to invest $6 billion in Michigan's energy future to support new power plant technology and identify new energy sources. In 2014, Consumers Energy opened Cross Winds Energy Park in Michigan's Tuscola County and signed a contract with General Electric to supply 621.79-kilowatt wind turbine engines for the project which has a total generating capacity of 105 megawatts.
Oct 1, 2021, CMS Energy Completes Sale of EnerBank USA to Regions Bank.
On Nov 1st 2022, CMS Enterprises changes name to NorthStar Clean Energy as it begins to serve more corporate clients.
Sustainability and Environment
In 2015, 9 percent of CMS Energy's power comes from renewable energy sources. Primary CMS Energy subsidiary Consumers Energy joined the Wildlife Habitat Council as an active member. By 2007, all power facilities received the Clean Corporate Citizen award from the Michigan Department of Environmental Quality.
Awards
Consumers Energy, CMS Energy's primary subsidiary, was named Energy Star Partner of the Year in 2014 and 2015 for excellence in sustainable energy efficiency programs. In 2014, Consumers Energy was ranked among the top 15 most sustainable energy providers. Later that year, CMS Energy received Edison Electric Institute's Index Award for top cumulative shareholder return in the small cap category. The firm received the 2015 Emergency Recovery Award for its electricity restoration efforts during the December 2013 North American storm complex.
Criticism
In December 2011, the non-partisan organization Public Campaign criticized CMS Energy for spending $3.48 million on lobbying and not paying any taxes during 2008-2010, instead getting $29 million in tax rebates, despite making a profit of $415 million, and increasing executive pay by 79% to $900.4 million in 2010 for its top 5 executives.
Philanthropy
CMS Energy has helped establish and finance numerous research, educational and cultural institutes in the United States. Consumers Energy was given the William Booth Award in 2013 by The Salvation Army in recognition of its long history of philanthropic activities and leadership for the PeopleCare assistance program.
CMS Energy participates in internship and cooperative education programs to build career opportunities in Michigan. Consumers Energy has also worked on early childhood development and education in Michigan and has also received Wildlife Habitat Council (WHC) compliant certificates for its efforts to promote environmental education.
Quelle: Wikipedia (Englisch), CC BY-SA 4.0 · Auf Wikipedia ansehen ↗
10-Jahres-Performance Umsatz-, Nettoergebnis-, Margen- und EPS-Trends
Bewertung P/E-, P/S-, P/B-, EV/EBITDA-Verhältnisse — ist die Aktie teuer oder günstig?
| Kennzahl | 5-Jahres-Trend | CMSD | 5-Jahres-Durchschnitt | Peer-Median | Fazit |
|---|---|---|---|---|---|
| K/B (MRQ) | 0.7 | · | · | · |
Der Median der Vergleichsgruppe wird pro Kennzahl standardisiert berechnet und stimmt möglicherweise nicht immer mit der für diese Aktie angezeigten TTM/MRQ-Basis überein.
Rentabilität Brutto-, Betriebs- und Nettomargen; ROE, ROA, ROIC
Noch nicht genügend Fundamentaldaten vorhanden, um diese Kennzahlengruppe zu berechnen.
Finanzielle Gesundheit Verschuldung, Liquidität, Solvenz — Bilanzstärke
| Kennzahl | 5-Jahres-Trend | CMSD | 5-Jahres-Durchschnitt | Peer-Median | Fazit |
|---|---|---|---|---|---|
| Fremdkapital / Eigenkapital (MRQ) | 1.9 | · | · | · | |
| Liquiditätsgrad (MRQ) | 0.9 | · | · | · | |
| Langfristige Schulden / Eigenkapital (MRQ) | 1.9 | · | · | · |
Wachstum Umsatz-, EPS- und Nettoergebniswachstum: YoY, 3-Jahres-CAGR, 5-Jahres-CAGR
Noch nicht genügend Fundamentaldaten vorhanden, um diese Kennzahlengruppe zu berechnen.
Kapitaleffizienz Umsatz pro Vermögenswert, Lagerumschlag, Forderungsumschlag
Noch nicht genügend Fundamentaldaten vorhanden, um diese Kennzahlengruppe zu berechnen.
Wert · ≈ 5-Jahres-Durchschnitt · Branchenmedian · Urteil relativ zum Median
Dividenden Rendite, Ausschüttungsquote, Dividendenhistorie, 5-Jahres-CAGR
| Ex-Datum | Betrag | Währung | Rendite |
|---|---|---|---|
| Aug 17, 2026 | $0,37 | USD | ≈6.9% |
| Mai 15, 2026 | $0,37 | USD | ≈6.4% |
| Feb 13, 2026 | $0,37 | USD | ≈6.2% |
| Nov 14, 2025 | $0,37 | USD | ≈6.1% |
| Aug 15, 2025 | $0,37 | USD | ≈6.3% |
| Mai 16, 2025 | $0,37 | USD | ≈6.7% |
| Feb 14, 2025 | $0,37 | USD | ≈6.2% |
| Nov 15, 2024 | $0,37 | USD | ≈6.0% |
| Aug 16, 2024 | $0,37 | USD | ≈6.0% |
| Mai 16, 2024 | $0,37 | USD | ≈6.0% |
| Feb 14, 2024 | $0,37 | USD | ≈6.0% |
| Nov 15, 2023 | $0,37 | USD | ≈6.2% |
| Aug 16, 2023 | $0,37 | USD | ≈6.2% |
| Mai 16, 2023 | $0,37 | USD | ≈6.1% |
| Feb 13, 2023 | $0,37 | USD | ≈6.0% |
| Nov 15, 2022 | $0,37 | USD | ≈6.2% |
| Aug 16, 2022 | $0,37 | USD | ≈5.8% |
| Mai 16, 2022 | $0,37 | USD | ≈6.0% |
| Feb 11, 2022 | $0,36 | USD | ≈5.6% |
| Nov 15, 2021 | $0,37 | USD | ≈5.5% |
Ergebnisverlauf EPS Ist vs. Schätzung, Überraschung %, Beat-Rate, nächstes Ergebnisdatum
| Zeitraum | Bericht | EPS Actual | EPS est. | Überraschung |
|---|---|---|---|---|
| 30. Juni 2026 | $0.37 | $0.36 | 1.6% | |
| 31. März 2026 | $1.13 | $1.11 | 1.9% | |
| 31. Dezember 2025 | $0.94 | $0.95 | -1.2% | |
| 30. September 2025 | $0.93 | $0.85 | 8.9% | |
| 30. Juni 2025 | $0.71 | $0.70 | 2.1% | |
| 31. März 2025 | $1.02 | $1.02 | -0.41% |
Vollständige Fundamentaldaten Alle Kennzahlen nach Jahr — Gewinn- und Verlustrechnung, Bilanz, Cashflow
Bilanz
| Kennzahl | Trend | 2025 |
|---|---|---|
| Cash & Equivalents | $509M | |
| Other Current Assets | $160M | |
| Current Assets | $3.47B | |
| PP&E (Net) | $30.68B | |
| Accum. Depreciation | $10.13B | |
| Other Non-current Assets | $398M | |
| Total Assets | $39.94B | |
| Current Liabilities | $3.55B | |
| Deferred Tax | $3.25B | |
| Other Non-current Liabilities | $392M | |
| Long-term Debt | $18.76B | |
| Common Stock | $3M | |
| Retained Earnings | $2.44B | |
| AOCI | $-36M | |
| Stockholders' Equity | $9.14B | |
| Liabilities + Equity | $39.94B | |
| Shares Outstanding | 306,400,000 |
Gewinn- und Verlustrechnung
| Kennzahl | Trend | Q2 2026 | Q1 2026 | Q2 2025 | Q1 2025 |
|---|---|---|---|---|---|
| Revenue | $1.83B | $2.73B | $1.84B | $2.45B | |
| Operating Expenses | $1.56B | $2.24B | $1.52B | $1.95B | |
| Operating Income | $264M | $490M | $317M | $494M | |
| Other Non-op | $75M | $75M | $137M | $50M | |
| Pretax Income | $129M | $362M | $255M | $358M | |
| Income Tax | $33M | $85M | $62M | $63M | |
| Net Income | $120M | $340M | $201M | $304M | |
| EPS (Basic) | $0.38 | $1.10 | $0.67 | $1.01 | |
| EPS (Diluted) | $0.37 | $1.10 | $0.66 | $1.01 | |
| Shares (Basic) | 310,200,000 | 306,400,000 | 298,500,000 | 298,200,000 | |
| Shares (Diluted) | 310,800,000 | 307,100,000 | 299,100,000 | 299,100,000 | |
| EBITDA | $572M | $902M | · | · |
Bilanz
| Kennzahl | Trend | Q2 2026 | Q1 2026 | Q2 2025 | Q1 2025 |
|---|---|---|---|---|---|
| Cash & Equivalents | $241M | $175M | · | · | |
| Other Current Assets | $243M | $225M | · | · | |
| Current Assets | $2.87B | $3.02B | · | · | |
| PP&E (Net) | $32.33B | $31.53B | · | · | |
| Accum. Depreciation | $10.50B | $10.38B | · | · | |
| Other Non-current Assets | $302M | $341M | · | · | |
| Total Assets | $40.91B | $40.28B | · | · | |
| Current Liabilities | $3.06B | $3.59B | · | · | |
| Deferred Tax | $3.40B | $3.35B | · | · | |
| Other Non-current Liabilities | $444M | $417M | · | · | |
| Long-term Debt | $19.04B | $18.86B | · | · | |
| Total Debt | $19.04B | $18.86B | · | · | |
| Common Stock | $3M | $3M | · | · | |
| Retained Earnings | $2.55B | $2.60B | · | · | |
| AOCI | $-35M | $-35M | · | · | |
| Stockholders' Equity | $9.77B | $9.47B | · | · | |
| Liabilities + Equity | $40.91B | $40.28B | · | · | |
| Shares Outstanding | 313,600,000 | 308,900,000 | · | · |
Cashflow
| Kennzahl | Trend | Q2 2026 | Q1 2026 | Q2 2025 | Q1 2025 |
|---|---|---|---|---|---|
| D&A | $308M | $412M | $288M | $388M | |
| Other Non-cash | · | $-47M | · | · | |
| Operating Cash Flow | $622M | $705M | · | $1.00B | |
| CapEx | $967M | $1.04B | · | $888M | |
| Investing Cash Flow | $-1.02B | $-1.07B | · | $-918M | |
| Debt Issued | $909M | $258M | · | $1.20B | |
| Net Debt Issued | · | $54M | · | · | |
| Stock Issued | $362M | $166M | · | $3M | |
| Net Stock Activity | · | $166M | · | · | |
| Financing Cash Flow | $480M | $16M | · | $266M | |
| Net Change in Cash | $82M | $-352M | · | $348M | |
| Free Cash Flow | · | $-334M | · | · |
Rentabilität
| Kennzahl | Trend | Q2 2026 | Q1 2026 | Q2 2025 | Q1 2025 |
|---|---|---|---|---|---|
| Operating Margin | 14.4% | 17.9% | · | · | |
| Net Margin | 6.6% | 12.4% | · | · | |
| Pretax Margin | 7.0% | 13.3% | · | · | |
| EBITDA Margin | 31.3% | 33.0% | · | · | |
| ROA | 0.31% | 0.89% | · | · | |
| ROE | 1.3% | 3.8% | · | · | |
| ROIC | 0.68% | 1.3% | · | · |
Liquidität & Solvenz
| Kennzahl | Trend | Q2 2026 | Q1 2026 | Q2 2025 | Q1 2025 |
|---|---|---|---|---|---|
| Current Ratio | 0.9 | 0.8 | · | · | |
| Quick Ratio | 0.1 | 0.0 | · | · | |
| Debt / Equity | 1.9 | 2.0 | · | · | |
| LT Debt / Equity | 1.9 | 1.8 | · | · |
Effizienz
| Kennzahl | Trend | Q2 2026 | Q1 2026 | Q2 2025 | Q1 2025 |
|---|---|---|---|---|---|
| Asset Turnover | 0.0 | 0.1 | · | · |
Pro Aktie
| Kennzahl | Trend | Q2 2026 | Q1 2026 | Q2 2025 | Q1 2025 |
|---|---|---|---|---|---|
| Book Value / Share | $31.17 | $30.64 | · | · | |
| Revenue / Share | $5.88 | $8.89 | · | · | |
| Cash Flow / Share | · | $2.30 | · | · | |
| Cash / Share | $0.77 | $0.57 | · | · | |
| Dividend / Share | $0.57 | $0.57 | $0.54 | $0.54 | |
| EPS (TTM) | $3.33 | $3.62 | $3.39 | $3.38 |
Bewertung (TTM)
| Kennzahl | Trend | Q2 2026 | Q1 2026 | Q2 2025 | Q1 2025 |
|---|---|---|---|---|---|
| Revenue TTM | $8.81B | $8.82B | $8.02B | $7.79B | |
| Net Income TTM | $1.03B | $1.11B | $1.02B | $1.02B | |
| Market Cap | $6.87B | $6.83B | · | · | |
| Enterprise Value | $25.66B | $25.51B | · | · | |
| P/E | 6.6 | 6.1 | 6.5 | 6.7 | |
| P/S | 0.8 | 0.8 | 0.8 | 0.9 | |
| P/B | 0.7 | 0.7 | · | · | |
| P / Tangible Book | 0.7 | 0.7 | · | · | |
| P / Cash Flow | · | 9.7 | · | · | |
| EV / Revenue | 2.9 | 2.9 | 3.0 | 3.0 | |
| Earnings Yield | 15.2% | 16.4% | 15.3% | 14.8% |
Aktuellster Zeitraum links · fehlende Werte werden als · angezeigt
Finanzberichte Gewinn- und Verlustrechnung, Bilanz, Cashflow — jährlich, letzte 5 Jahre
Noch nicht genügend Fundamentaldaten vorhanden, um diese Aufstellung zu erstellen.
Noch nicht genügend Fundamentaldaten vorhanden, um diese Aufstellung zu erstellen.
Noch nicht genügend Fundamentaldaten vorhanden, um diese Aufstellung zu erstellen.
Institutionelle Eigentümer (13F) 2 Einreicher · $20K gesamt · Stand 30. Juni 2026
Institutionen, die diese Aktie in ihrer vierteljährlichen SEC-Formular 13F melden. Nur Long-Positionen; ein einzelner Einreicher kann für separate Optionsscheine zweimal erscheinen. Große gegenläufige Put/Call-Positionen spiegeln typischerweise Market-Making oder abgesicherte Bestände wider, nicht die gerichtete Überzeugung.
| Neue Positionen | Geschlossene Positionen | Erhöht | Abgenommen | Nettoveränderung der Aktien |
|---|---|---|---|---|
| 0 (-1 vs. Vorquartal) | 0 (-1 vs. Vorquartal) | 1 (+1 vs. Vorquartal) | 1 (+1 vs. Vorquartal) | +478 |
Verglichen mit Q1 2026. SEC-Formular 13F-Einreichungen sind innerhalb von 45 Tagen nach Quartalsende fällig, zuzüglich einer kurzen Pufferzeit für verspätete Einreicher — Quartale, die noch in diesem Fenster liegen, werden zugunsten des letzten vollständig berichteten Paares übersprungen.
| Institution | Wert | Aktien | % der verfolgten 13F | Typ |
|---|---|---|---|---|
| First Command Advisory Services, Inc. | $16.075 | 734 | 81,20% | Aktien |
| PNC Financial Services Group, Inc. | $3.723 | 170 | 18,80% | Aktien |
Unternehmensinsider 1 Insider · 1 Führungskräfte · 0 Direktoren
| Insider | Rolle | Letzte Aktivität | Gehaltene Aktien | Käufe 12m | Verkäufe 12m | Netto 12m |
|---|---|---|---|---|---|---|
| Srikanth Maddipati | EVP/CFO | 31. Juli 2026 P | 34.895 | 1 | 0 | $14.492 |
Insider aus SEC-Einreichungen Form 3/4/5; Netto = nur P/S aus offenen Märkten
ETF-Besitz Gehalten von 1 ETF
Gewichtung spiegelt nur direkte Aktienbestände (N-PORT) wider; gehebelte oder derivatbasierte Fonds können zusätzliche Swap-Exposure halten, die hier nicht angezeigt wird.
| Fonds | Gewicht | Anteile | Stand | Quelle |
|---|---|---|---|---|
| FPE · First Trust Exchange-Traded Fund III | 0,25% | 705.428 NS | 31. Juli 2026 | N-PORT |
CMSD Analysten-Konsens Bullische und bärische Analystenmeinungen, 12-Monats-Kursziel, Aufwärtspotenzial
Peer-Vergleich (GICS-Subbranche) Wichtige Kennzahlen im Vergleich zu Branchenkollegen
FY-Basis, Kurse zum Schlusskurs am Ende des letzten Geschäftsjahres jedes Unternehmens.
| Ticker | Marktkapitalisierung | P/E | Umsatz Vj. | Nettomarge | ROE | Bruttogewinnmarge |
|---|---|---|---|---|---|---|
| CMSD | · | · | · | · | · | · |
| WEC | $34.32B | 21.9 | 14.0% | 15.9% | 11.2% | · |
| PEG | $39.99B | 19.0 | 18.2% | 17.3% | 12.6% | · |
| AEE | $27.60B | 18.7 | 15.4% | 16.6% | 11.5% | · |
| DTE | · | · | · | · | · | · |
| CNP | $25.03B | 24.0 | 8.3% | 11.2% | 9.5% | · |
| CMS | $21.43B | 19.8 | 13.6% | 12.5% | 12.3% | · |
| NI | $19.98B | 21.4 | 23.5% | 14.2% | 10.2% | · |
| BKH | $5.24B | 17.4 | 8.6% | 12.6% | 8.0% | · |
| NWE | $3.96B | 22.0 | 6.4% | 11.2% | 6.3% | · |
| NWE | $3.96B | 22.0 | 6.4% | 11.2% | 6.3% | · |
Meine Kennzahlen Ihre persönliche Watchlist — ausgewählte Zeilen aus den vollständigen Fundamentaldaten
Wählen Sie die Kennzahlen, die für Sie wichtig sind — klicken Sie auf das + neben jeder Zeile in den vollständigen Fundamentaldaten oben.
Ihre Auswahl wird gespeichert und begleitet Sie über alle Ticker hinweg.