
ONBPP Old National Bancorp - Depositary Shares, Each Representing a 1/40th Interest in a Share of Series A Preferred Stock
NASDAQ · Banking · Auf SEC EDGAR ansehen ↗ Schließen Okt 2, 2026 10-K/10-Q Aug 4, 2021ONBPP Aktien-Snapshot Kurs, Marktkapitalisierung, P/E, EPS, ROE, Schulden/Eigenkapital, 52-Wochen-Spanne
ONBPP Aktienkurs-Chart Täglich OHLCV mit technischen Indikatoren — Schwenken, Zoom und Ansicht anpassen
Die Balkengranularität passt sich der ausgewählten Periode an – bewegen Sie den Mauszeiger über das Diagramm, um Eröffnungs-/Höchst-/Tiefst-/Schlusskurse für einen Balken anzuzeigen.
Über Old National Bancorp - Depositary Shares, Each Representing a 1/40th Interest in a Share of Series A Preferred Stock Unternehmensübersicht von Wikipedia
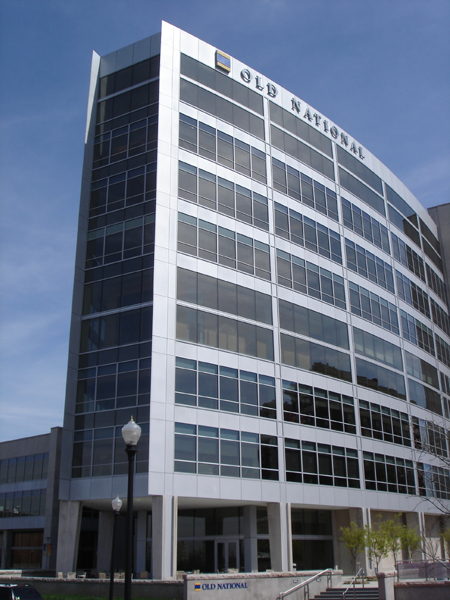
Old National Bank is an American regional bank with nearly 200 retail branches operated by Old National Bancorp and based in Chicago and Evansville, Indiana. With assets at $48.5 billion and 250 banking centers, Old National Bancorp is the largest financial services bank holding company headquartered in Indiana and one of the top 30 banking companies in the U.S. Old National Bank has locations in Illinois, Indiana, Iowa, Kentucky, Michigan, Minnesota, North Dakota, Tennessee, and Wisconsin.
History
The bank was founded in 1834.
In November 1995, Old National acquired the Greencastle-based First United Savings Bank for $18 million in stock. In the following year, Old National acquired the Bloomington-based Workingmens Capital Holdings with its Workingmens Federal Savings Bank subsidiary for an undisclosed amount in stock.
In 2009, Charter One's Indiana bank branches became Old National Bank after Old National Bank bought Charter One's Indiana operations. In January 2011, Old National acquired Bloomington-based Monroe Bancorp with its Monroe Bank subsidiary for $90 million in stock. Later that year, Integra Bank was closed by the Federal Deposit Insurance Corporation and all deposit accounts, excluding certain brokered deposits, were transferred to Old National. In 2012, Old National acquired 24 retail bank branches of Bank of America in Indiana and Michigan. In 2014, Old National acquired four banks: Tower Bank in Fort Wayne, Indiana, United Bank in Ann Arbor, Michigan, Lafayette Savings Bank in Lafayette, Indiana, and Founders Bank & Trust in Grand Rapids, Michigan.
In May 2016, AnchorBank, the third-largest bank based in Wisconsin, was bought by Old National for approximately $461 million.
In August 2017, Old National agreed to buy Anchor Bank of Minnesota for $303 million. The acquisition will add 17 locations in the Twin Cities and 1 in Mankato plus $1.7 billion in deposits and $2.1 billion in assets. In June 2018, KleinBank, based in Chaska, Minnesota, announced its 21 locations were being acquired by Old National, increasing Old National's presence in the western suburbs of Minneapolis.
In 2021, Old National merged with First Midwest Bancorp, combining the companies' assets, retaining the Old National name, and maintaining headquarters in Chicago and Evansville.
On April 10, 2023, a mass shooting at the Louisville, Kentucky branch resulted in five fatalities (all employees) and eight other injured people, including a rookie police officer. The injured officer's partner subsequently killed the perpetrator, who was a current bank employee.
In 2024, it was announced that CapStar Financial Holdings Inc. merged its operations with those of the bank. As a result, CapStar Bank became a division of Old National Bank.
On November 25, 2024, Old National announced its purchase of Minnesota-based Bremer Bank in a $1.4 billion sale which was finalized in October, 2025. The merger created a combined bank worth $70 billion.
Services
The company offers retail banking (checking accounts, savings accounts and certificates of deposit, consumer loans including home mortgages, and small business banking & lending), business or commercial banking (checking accounts, savings accounts & CDs, commercial loans and lines of credit, credit cards, capital markets, treasury management, and merchant services), and wealth management, investment, trust and retirement products and services.
Quelle: Wikipedia (Englisch), CC BY-SA 4.0 · Auf Wikipedia ansehen ↗
10-Jahres-Performance Umsatz-, Nettoergebnis-, Margen- und EPS-Trends
Bewertung P/E-, P/S-, P/B-, EV/EBITDA-Verhältnisse — ist die Aktie teuer oder günstig?
Noch nicht genügend Fundamentaldaten vorhanden, um diese Kennzahlengruppe zu berechnen.
Rentabilität Brutto-, Betriebs- und Nettomargen; ROE, ROA, ROIC
Noch nicht genügend Fundamentaldaten vorhanden, um diese Kennzahlengruppe zu berechnen.
Finanzielle Gesundheit Verschuldung, Liquidität, Solvenz — Bilanzstärke
Noch nicht genügend Fundamentaldaten vorhanden, um diese Kennzahlengruppe zu berechnen.
Wachstum Umsatz-, EPS- und Nettoergebniswachstum: YoY, 3-Jahres-CAGR, 5-Jahres-CAGR
Noch nicht genügend Fundamentaldaten vorhanden, um diese Kennzahlengruppe zu berechnen.
Kapitaleffizienz Umsatz pro Vermögenswert, Lagerumschlag, Forderungsumschlag
Noch nicht genügend Fundamentaldaten vorhanden, um diese Kennzahlengruppe zu berechnen.
Wert · ≈ 5-Jahres-Durchschnitt · Branchenmedian · Urteil relativ zum Median
Dividenden Rendite, Ausschüttungsquote, Dividendenhistorie, 5-Jahres-CAGR
| Ex-Datum | Betrag | Währung | Rendite |
|---|---|---|---|
| Aug 5, 2026 | $0,44 | USD | ≈7.1% |
| Mai 5, 2026 | $0,44 | USD | ≈7.1% |
| Feb 5, 2026 | $0,44 | USD | ≈7.0% |
| Nov 5, 2025 | $0,44 | USD | ≈7.0% |
| Aug 5, 2025 | $0,44 | USD | ≈7.0% |
| Mai 5, 2025 | $0,44 | USD | ≈7.0% |
| Feb 5, 2025 | $0,44 | USD | ≈7.0% |
| Nov 5, 2024 | $0,44 | USD | ≈7.0% |
| Aug 5, 2024 | $0,44 | USD | ≈7.1% |
| Mai 2, 2024 | $0,44 | USD | ≈7.1% |
| Feb 2, 2024 | $0,44 | USD | ≈7.0% |
| Nov 2, 2023 | $0,44 | USD | ≈7.7% |
| Aug 3, 2023 | $0,44 | USD | ≈7.2% |
| Mai 4, 2023 | $0,44 | USD | ≈9.0% |
| Feb 2, 2023 | $0,44 | USD | ≈6.8% |
| Nov 3, 2022 | $0,44 | USD | ≈7.1% |
| Aug 4, 2022 | $0,44 | USD | ≈6.5% |
| Mai 4, 2022 | $0,44 | USD | ≈6.9% |
| Feb 3, 2022 | $0,44 | USD | ≈6.5% |
| Nov 4, 2021 | $0,44 | USD | ≈6.3% |
Ergebnisverlauf EPS Ist vs. Schätzung, Überraschung %, Beat-Rate, nächstes Ergebnisdatum
| Zeitraum | Bericht | EPS Actual | EPS est. | Überraschung |
|---|---|---|---|---|
| 30. Juni 2026 | $0.65 | $0.64 | 2.2% | |
| 31. März 2026 | $0.61 | $0.61 | -0.36% | |
| 31. Dezember 2025 | $0.62 | $0.60 | 3.5% | |
| 30. September 2025 | $0.59 | $0.57 | 3.6% | |
| 30. Juni 2025 | $0.53 | $0.52 | 1.5% | |
| 31. März 2025 | $0.45 | $0.43 | 4.3% |
Vollständige Fundamentaldaten Alle Kennzahlen nach Jahr — Gewinn- und Verlustrechnung, Bilanz, Cashflow
Wir haben noch keine SEC-Einreichungen für dieses Tickersymbol.
Pro Aktie
| Kennzahl | Trend | Q4 2021 | Q4 2014 |
|---|---|---|---|
| EPS (TTM) | $1.81 | $0.95 |
Bewertung (TTM)
| Kennzahl | Trend | Q4 2021 | Q4 2014 |
|---|---|---|---|
| Net Income TTM | $302M | $99M | |
| P/E | 15.6 | · | |
| Earnings Yield | 6.4% | · | |
| Annual Payout | $93M | $45M |
Aktuellster Zeitraum links · fehlende Werte werden als · angezeigt
Unternehmensinsider 7 Insider · 4 Führungskräfte · 3 Direktoren
| Insider | Rolle | Letzte Aktivität | Gehaltene Aktien | Käufe 12m | Verkäufe 12m | Netto 12m |
|---|---|---|---|---|---|---|
| Chady M. Alahmar | CEO, WEALTH MANAGEMENT | 30. Juli 2026 S | 63.531 | 0 | 1 | $-310.872 |
| James C Ryan III | CHAIRMAN AND CEO | 30. Juni 2026 J | 958.389 | 0 | 0 | $0 |
| John V Moran | CHIEF FINANCIAL OFFICER | 1. September 2026 F | 120.728 | 0 | 0 | $0 |
| Scott J Evernham | CHIEF RISK OFFICER | 30. Juni 2026 J | 149.303 | 0 | 0 | $0 |
| Tom Salmon | Direktor | 2. Juli 2026 A | · | 0 | 0 | $0 |
| Alan W Braun | Direktor | 15. Dezember 2003 J | 142.931 | 0 | 0 | $0 |
| Timothy M Burke JR | · | 1. August 2026 F | 54.084 | 0 | 0 | $0 |
Insider aus SEC-Einreichungen Form 3/4/5; Netto = nur P/S aus offenen Märkten
ETF-Besitz Gehalten von 1 ETF
Gewichtung spiegelt nur direkte Aktienbestände (N-PORT) wider; gehebelte oder derivatbasierte Fonds können zusätzliche Swap-Exposure halten, die hier nicht angezeigt wird.
| Fonds | Gewicht | Anteile | Stand | Quelle |
|---|---|---|---|---|
| PFLD · ETF Series Solutions | 0,06% | 9.495 NS | 31. Juli 2026 | N-PORT |
ONBPP Analysten-Konsens Bullische und bärische Analystenmeinungen, 12-Monats-Kursziel, Aufwärtspotenzial
Peer-Vergleich (GICS-Subbranche) Wichtige Kennzahlen im Vergleich zu Branchenkollegen
FY-Basis, Kurse zum Schlusskurs am Ende des letzten Geschäftsjahres jedes Unternehmens.
| Ticker | Marktkapitalisierung | P/E | Umsatz Vj. | Nettomarge | ROE | Bruttogewinnmarge |
|---|---|---|---|---|---|---|
| ONBPP | · | · | · | · | · | · |
| WTFC | $9.36B | 12.3 | 5.9% | 310.1% | 11.4% | · |
| ZION | $8.64B | 9.7 | 3.6% | 135.8% | 13.1% | · |
| UMBF | $8.74B | 12.4 | 62.8% | 26.5% | 9.4% | · |
| SSB | $9.33B | 12.0 | 56.1% | 29.8% | 8.9% | · |
| CFR | · | 12.8 | 8.3% | 29.0% | 14.8% | · |
| ONB | $8.69B | 12.5 | · | 26.5% | 8.1% | · |
| WAL | · | 9.6 | 99.7% | 713.6% | 13.5% | · |
| COLB | $8.26B | 12.2 | 18.8% | 310.7% | 8.5% | · |
| PB | $6.43B | 12.1 | 4.8% | 43.4% | 7.1% | · |
| CBSH | $7.20B | 13.0 | 6.5% | 32.1% | 16.0% | · |
Meine Kennzahlen Ihre persönliche Watchlist — ausgewählte Zeilen aus den vollständigen Fundamentaldaten
Wählen Sie die Kennzahlen, die für Sie wichtig sind — klicken Sie auf das + neben jeder Zeile in den vollständigen Fundamentaldaten oben.
Ihre Auswahl wird gespeichert und begleitet Sie über alle Ticker hinweg.