
WVVIP Willamette Valley Vineyards, Inc. - Series A Redeemable Preferred Stock
NASDAQ · Beverages · Auf SEC EDGAR ansehen ↗ Schließen Okt 2, 2026 10-K/10-Q Aug 12, 2026WVVIP Aktien-Snapshot Kurs, Marktkapitalisierung, P/E, EPS, ROE, Schulden/Eigenkapital, 52-Wochen-Spanne
WVVIP Aktienkurs-Chart Täglich OHLCV mit technischen Indikatoren — Schwenken, Zoom und Ansicht anpassen
Die Balkengranularität passt sich der ausgewählten Periode an – bewegen Sie den Mauszeiger über das Diagramm, um Eröffnungs-/Höchst-/Tiefst-/Schlusskurse für einen Balken anzuzeigen.
Über Willamette Valley Vineyards, Inc. - Series A Redeemable Preferred Stock Unternehmensübersicht von Wikipedia
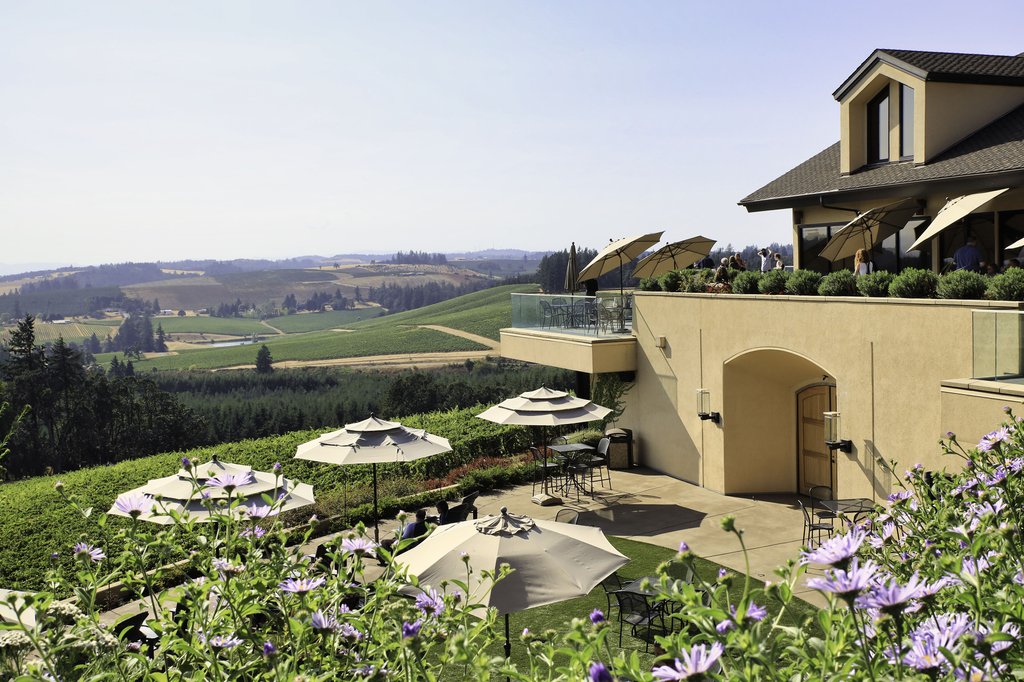
Willamette Valley Vineyards is an American winery located in Turner, Oregon. Named after Oregon's Willamette Valley, the winery is the leading producer of Willamette Valley-appellated Pinot Noir in Oregon, and also produces Chardonnay and Pinot Gris. In 2016, the winery was the largest producer of Riesling wine in the Willamette Valley.
History
Willamette Valley Vineyards was founded by Jim Bernau and Don Voorhies. In 1997, Willamette Valley Vineyards merged with Tualatin Estate Vineyards, which was established by Bill Fuller in 1973.
The winery was established via an early crowdfunding campaign. In 1989, around 1,200 shareholders invested an average of $1,700 each in an unlisted stock offering approved by Oregon regulators. By 1993, the number of shareholders had grown to 4,500 and many shareholders were directly involved with operations, collectively donating 6,000 to 7,000 hours of labor per month. Over 300 shareholders passed an OLCC class to be certified to pour wine in the tasting room. The winery is now listed on the NASDAQ under the symbol WVVI.
In 2021, the winery hosted the season 18 finale of Bravo's Top Chef: Portland.
Subsidiaries
In 2015, founder Jim Bernau and winery director Christine Clair founded the Oregon Estate Vineyards division to manage subsidiary vineyards.
Since 2007, Willamette Valley Vineyards has managed Elton Vineyards in the Eola-Amity Hills AVA. Elton Vineyards is primarily planted with Pinot Noir and Chardonnay. In 2017, Willamette Valley Vineyards began selling a boutique wine label under the "Elton" name.
In 2015, the company purchased new vineyard sites in the Walla Walla Valley AVA for a new subsidiary, "Pambrun Vineyard", named after Bernau's ancestor, Pierre Pambrun, a Walla Walla pioneer. Pambrun produces Cabernet Sauvignon along with other Bordeaux varieties. In 2018, Willamette Valley Vineyards acquired nearby Maison Bleue Winery, previously owned by Jon Meuret, who was also the consulting winemaker for Pambrun Vineyard.
Press coverage
In 2015, Wine Enthusiast named Willamette Valley Vineyards' Whole Cluster Pinot Noir as one of "America's Best Value Pinot Noirs".
The Wall Street Journal included Willamette Valley Vineyards' Pinot Gris in the article, "Why Wine Remains a Great Connector".
Quelle: Wikipedia (Englisch), CC BY-SA 4.0 · Auf Wikipedia ansehen ↗
10-Jahres-Performance Umsatz-, Nettoergebnis-, Margen- und EPS-Trends
Bewertung P/E-, P/S-, P/B-, EV/EBITDA-Verhältnisse — ist die Aktie teuer oder günstig?
| Kennzahl | 5-Jahres-Trend | WVVIP | 5-Jahres-Durchschnitt | Peer-Median | Fazit |
|---|---|---|---|---|---|
| K/B (MRQ) | 0.2 | · | 0.2 | Überbewertet |
Der Median der Vergleichsgruppe wird pro Kennzahl standardisiert berechnet und stimmt möglicherweise nicht immer mit der für diese Aktie angezeigten TTM/MRQ-Basis überein.
Rentabilität Brutto-, Betriebs- und Nettomargen; ROE, ROA, ROIC
Noch nicht genügend Fundamentaldaten vorhanden, um diese Kennzahlengruppe zu berechnen.
Finanzielle Gesundheit Verschuldung, Liquidität, Solvenz — Bilanzstärke
| Kennzahl | 5-Jahres-Trend | WVVIP | 5-Jahres-Durchschnitt | Peer-Median | Fazit |
|---|---|---|---|---|---|
| Fremdkapital / Eigenkapital (MRQ) | 0.2 | · | 0.2 | Hohe Verschuldung | |
| Liquiditätsgrad (MRQ) | 2.9 | · | 1.9 | Starke Liquidität | |
| Langfristige Schulden / Eigenkapital (MRQ) | 0.2 | · | · | · |
Wachstum Umsatz-, EPS- und Nettoergebniswachstum: YoY, 3-Jahres-CAGR, 5-Jahres-CAGR
Noch nicht genügend Fundamentaldaten vorhanden, um diese Kennzahlengruppe zu berechnen.
Kapitaleffizienz Umsatz pro Vermögenswert, Lagerumschlag, Forderungsumschlag
Noch nicht genügend Fundamentaldaten vorhanden, um diese Kennzahlengruppe zu berechnen.
Wert · ≈ 5-Jahres-Durchschnitt · Branchenmedian · Urteil relativ zum Median
Dividenden Rendite, Ausschüttungsquote, Dividendenhistorie, 5-Jahres-CAGR
| Ex-Datum | Betrag | Währung | Rendite |
|---|---|---|---|
| Dez 5, 2025 | $0,22 | USD | ≈6.8% |
| Dez 6, 2024 | $0,22 | USD | ≈6.0% |
| Dez 6, 2023 | $0,22 | USD | ≈4.9% |
| Dez 6, 2022 | $0,22 | USD | ≈4.5% |
| Dez 6, 2021 | $0,22 | USD | ≈3.2% |
| Dez 4, 2020 | $0,22 | USD | ≈3.9% |
| Dez 5, 2019 | $0,22 | USD | ≈4.6% |
| Dez 6, 2018 | $0,22 | USD | ≈4.5% |
| Dez 7, 2017 | $0,22 | USD | ≈4.3% |
Ergebnisverlauf EPS Ist vs. Schätzung, Überraschung %, Beat-Rate, nächstes Ergebnisdatum
| Zeitraum | Bericht | EPS Actual | EPS est. | Überraschung |
|---|---|---|---|---|
| 31. März 2024 | $-0.22 | — | — | |
| 30. September 2023 | $-0.17 | — | — |
Vollständige Fundamentaldaten Alle Kennzahlen nach Jahr — Gewinn- und Verlustrechnung, Bilanz, Cashflow
Wir haben noch keine SEC-Einreichungen für dieses Tickersymbol.
Gewinn- und Verlustrechnung
| Kennzahl | Trend | Q2 2026 | Q2 2025 |
|---|---|---|---|
| Revenue | $10M | $10M | |
| Cost of Revenue | $4M | $4M | |
| Gross Profit | $6M | $6M | |
| SG&A Expense | $3M | $2M | |
| Operating Expenses | $7M | $6M | |
| Operating Income | $-1M | $398.2K | |
| Interest Expense | $268.0K | $270.1K | |
| Pretax Income | $-2M | $130.6K | |
| Income Tax | $-229.5K | $37.8K | |
| Net Income | $-1M | $92.8K | |
| EPS (Basic) | $-0.40 | $-0.09 | |
| EPS (Diluted) | $-0.40 | $-0.09 | |
| Shares (Basic) | 4,979,529 | 4,964,529 | |
| Shares (Diluted) | 4,979,529 | 4,964,529 | |
| EBITDA | $-1M | · |
Bilanz
| Kennzahl | Trend | Q2 2026 | Q2 2025 |
|---|---|---|---|
| Cash & Equivalents | $589.5K | · | |
| Receivables | $3M | · | |
| Inventory | $32M | · | |
| Prepaid Expense | $600.3K | · | |
| Current Assets | $36M | · | |
| PP&E (Net) | $48M | · | |
| PP&E (Gross) | $81M | · | |
| Accum. Depreciation | $33M | · | |
| Other Non-current Assets | $13.8K | · | |
| Total Assets | $103M | · | |
| Accounts Payable | $2M | · | |
| Accrued Liabilities | $2M | · | |
| Short-term Debt | $825.2K | · | |
| Current Liabilities | $12M | · | |
| Capital Leases | $11M | · | |
| Deferred Tax | $2M | · | |
| Total Liabilities | $37M | · | |
| Long-term Debt | $15M | · | |
| Total Debt | $15M | · | |
| Common Stock | $9M | · | |
| Retained Earnings | $11M | · | |
| Stockholders' Equity | $66M | · | |
| Liabilities + Equity | $103M | · | |
| Shares Outstanding | 4,979,529 | · |
Cashflow
| Kennzahl | Trend | Q2 2026 | Q2 2025 |
|---|---|---|---|
| D&A | $800.2K | · | |
| Stock-based Comp | $21.0K | · | |
| Operating Cash Flow | $2M | · | |
| CapEx | $28.5K | · | |
| Investing Cash Flow | $-53.5K | · | |
| Financing Cash Flow | $-2M | · | |
| Net Change in Cash | $184.8K | · |
Rentabilität
| Kennzahl | Trend | Q2 2026 | Q2 2025 |
|---|---|---|---|
| Gross Margin | 57.5% | · | |
| Operating Margin | -13.5% | · | |
| Net Margin | -13.9% | · | |
| Pretax Margin | -16.1% | · | |
| EBITDA Margin | -13.5% | · | |
| ROA | -1.3% | · | |
| ROE | -2.1% | · | |
| ROIC | -1.4% | · |
Liquidität & Solvenz
| Kennzahl | Trend | Q2 2026 | Q2 2025 |
|---|---|---|---|
| Current Ratio | 2.9 | · | |
| Quick Ratio | 0.3 | · | |
| Debt / Equity | 0.2 | · | |
| LT Debt / Equity | 0.2 | · | |
| Interest Coverage | -5.1 | · |
Effizienz
| Kennzahl | Trend | Q2 2026 | Q2 2025 |
|---|---|---|---|
| Asset Turnover | 0.1 | · | |
| Inventory Turnover | 0.1 | · | |
| Receivables Turnover | 4.0 | · |
Pro Aktie
| Kennzahl | Trend | Q2 2026 | Q2 2025 |
|---|---|---|---|
| Book Value / Share | $13.34 | · | |
| Revenue / Share | $2.02 | · | |
| Cash / Share | $0.12 | · |
Bewertung (TTM)
| Kennzahl | Trend | Q2 2026 | Q2 2025 |
|---|---|---|---|
| Revenue TTM | $38M | $38M | |
| Net Income TTM | $-2M | $-428.3K | |
| Market Cap | $13M | · | |
| Enterprise Value | $28M | · | |
| P/S | 0.3 | 0.4 | |
| P/B | 0.2 | · | |
| P / Tangible Book | 0.2 | · | |
| EV / Revenue | 0.7 | 0.8 |
Aktuellster Zeitraum links · fehlende Werte werden als · angezeigt
Finanzberichte Gewinn- und Verlustrechnung, Bilanz, Cashflow — jährlich, letzte 5 Jahre
Noch nicht genügend Fundamentaldaten vorhanden, um diese Aufstellung zu erstellen.
Noch nicht genügend Fundamentaldaten vorhanden, um diese Aufstellung zu erstellen.
Noch nicht genügend Fundamentaldaten vorhanden, um diese Aufstellung zu erstellen.
Unternehmensinsider 3 Insider · 1 Führungskräfte · 3 Direktoren
| Insider | Rolle | Letzte Aktivität | Gehaltene Aktien | Käufe 12m | Verkäufe 12m | Netto 12m |
|---|---|---|---|---|---|---|
| James W Bernau | President | 1. Oktober 2026 P | 380.001 | 18 | 0 | $9.491 |
| Chris Riccardi | Direktor | 1. Oktober 2026 P | 491.661 | 15 | 0 | $11.486 |
| Sean M Cary | Direktor | 12. Mai 2026 A | · | 0 | 0 | $0 |
Insider aus SEC-Einreichungen Form 3/4/5; Netto = nur P/S aus offenen Märkten
Peer-Vergleich (GICS-Subbranche) Wichtige Kennzahlen im Vergleich zu Branchenkollegen
FY-Basis, Kurse zum Schlusskurs am Ende des letzten Geschäftsjahres jedes Unternehmens.
Meine Kennzahlen Ihre persönliche Watchlist — ausgewählte Zeilen aus den vollständigen Fundamentaldaten
Wählen Sie die Kennzahlen, die für Sie wichtig sind — klicken Sie auf das + neben jeder Zeile in den vollständigen Fundamentaldaten oben.
Ihre Auswahl wird gespeichert und begleitet Sie über alle Ticker hinweg.