
GIB CGI Inc. Common Stock
NYSE · Technology · Ver en SEC EDGAR ↗ cerrar Oct 2, 2026 10-K/10-Q Dic 17, 2025GIB Instantánea de la Acción Precio, capitalización bursátil, P/E, BPA, ROE, deuda/capital, rango de 52 semanas
GIB Gráfico del Precio de la Acción OHLCV diario con indicadores técnicos — desplace, amplíe y personalice su vista
La granularidad de las barras se adapta al período seleccionado; pase el ratón sobre el gráfico para ver la apertura/máximo/mínimo/cierre de una barra.
| Fecha ex-dividendo | División | Tipo |
|---|---|---|
| 18 de enero de 2000 | 2-for-1 | Adelante |
Acerca de CGI Inc. Common Stock Descripción general de la empresa de Wikipedia
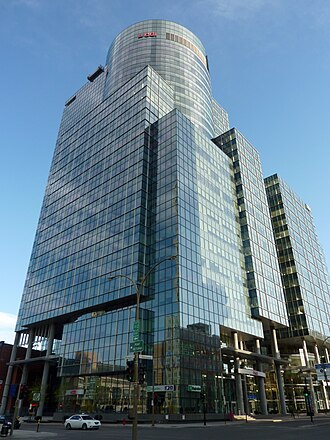
CGI is a multinational information technology consulting and software development company headquartered in Montreal, Quebec, Canada. CGI went public in 1986 with a primary listing on the Toronto Stock Exchange. CGI is also a constituent of the S&P/TSX 60 and has a secondary listing on the New York Stock Exchange.
As of 2025, CGI is based in 40+ countries with around 400 offices worldwide with 94,000 employees. CGI mainly works in application services, business consulting, business process Management, IT infrastructure services, IT outsourcing services, and systems integration services.
History
1970s–1980s: Early years
CGI Inc. was founded as an IT consulting company on June 15, 1976, in Quebec City, Québec, by Serge Godin. Within several months he was joined by co-founder André Imbeau from Quebec City. They initially ran the business from Godin's basement with a single phone. Starting with one client, as the company grew in size the co-founders moved to Montreal, and by the end of their first year they had generated $138,000 in revenue. While CGI stands for "Conseillers en gestion et informatique" in French (which translates to "consultants in management and information technology"), the official English meaning would later become "Consultants to Government and Industry." In later years the company began to go to market as simply CGI.
Throughout the 1970s, CGI focused on the information technology (IT) services market. Later in the 1970s, CGI branched into IT outsourcing. CGI's annual revenue in 1986 was $25 million, and the same year CGI went public with an initial public offering (IPO).
1990s: Doubling in size
CGI earned ISO 9001 certification for their "project management framework" in 1994, and in doing so became the first IT consulting firm in North America to comply with the ISO quality standard. In 1995, CGI entered into a commercial alliance with the large telecommunications company Bell Canada, with Bell Canada purchasing CGI shares then valued at $18.4 million. By the end of 1996, CGI's annual revenue was $122 million. In 1997, CGI acquired the company CDSL Holdings Limited (CDSL). After the acquisition, CGI's employees in both Canada and internationally numbered 2,500. In 1998 CGI acquired the Canadian company Bell Sygma, a Bell Canada subsidiary, which almost doubled CGI's size.
2000s: Expansion into international markets
CGI acquired IMRGlobal in 2001 for $438 million, which added "global delivery options" for CGI. In 2003, the Canadian tech company Cognicase was bought out by CGI for US$221 million, and at the end of 2003 CGI had annual sales of $1.85 billion. In 2004, CGI purchased the majority of American Management Systems (AMS) for $858 million. As of late 2004, CGI was the world's eighth largest independent provider of information technology services.
CGI co-founder Serge Godin stepped aside as CEO in 2006, taking the new position of executive chairman of the board and appointing as new CEO Michael Roach. Annual revenue at CGI was $3.5 billion by the fiscal end of 2006. That same year, CGI became one of four primary Recovery Audit Contractors in the US, with responsibilities to audit region B. At the end of 2007, CGI had a backlog worth $12.04 billion and an annual revenue of $3.7 billion, employing around 26,500 people.
2010–2012: Second doubling in size
In 2010, CGI acquired Stanley, Inc. for an enterprise value of approximately $1.07 billion. The deal came close to doubling CGI's presence in the United States and expanded CGI into defense and intelligence contracts. In 2010, CGI was included in the Forbes Global 2000 ranking of the 2,000 largest public companies in the world. As of 2011, there were 31,000 CGI employees in 125 offices worldwide and 89% of professionals at CGI also owned company shares.
In 2012, CGI acquired the UK-based computer services company Logica for £1.7 billion (CAN$2.7 billion) in cash. The acquisition raised the number of CGI's staff from 31,000 to 68,000, and CGI became the fifth largest independent business processes and IT services company in the world. It also made CGI the biggest tech firm in Canada. In 2012, CGI won a $143 million contract to provide operational support for the Army's training elements, the Deputy Chief of Staff for Intelligence, and the United States Army Training and Doctrine Command.
2013–2015: Contract work
At the time, CGI's train occupancy mobile app, iNStAPP, was being used by several train companies and institutions in Europe. In February 2013, the independent analyst firm Verdantix published a report comparing technology consulting and systems integration firms' ability to build efficient renewable energy management systems. The report named CGI as No. 4 on the "overall capabilities" score. Continuing to work in the financial sector, CGI was rated as a "major contender" by Everest Group in a 2013 PEAK Matrix study looking at IT outsourcing capital markets.
In 2014, CGI had contracts with federal businesses such as Defense Information Services Agency, visa processing in China, and the Coast Guard and Department of Homeland Security. CGI also worked with state governments, for example the California Enterprise Data to Revenue (EDR) Project for the California Franchise Tax Board. In 2014, The Globe and Mail reported that CGI was operating ten security centers, from which 1,400 CGI employees monitor "data traffic for an undisclosed number of customers" that include the Canadian Payments Association, the National Bank of Canada, and about forty Canadian government departments.
By 2014, CGI had been working with the European space industry for years, and had developed software that helps support the missions of over 200 individual satellites. CGI had also created the Constellation Control Facility that control's the Galileo Commercial Service's 30 satellites, and software for the first satellite in the world with e-sail (electric solar wind sail). In 2014, CGI was awarded a new contract by Inmarsat, the safety communications provider for 98% of airlines. In 2014, 16% of CGI's revenue came from software.
In 2014, Canadian Business named Michael Roach, then CEO of CGI, the most innovative CEO of the Canada of the year. Fiscal revenue by the end of 2014 was C$10.5 billion, and in the first quarter of 2015, CGI had revenues of $2.54 billion.
2016–present
As of 2016, CGI ranked number 955 on the Forbes Global 2000. At the time, CGI had assets worth C$20.9 billion, annual sales of $10.7 billion, and a market value of $9.6 billion.
In 2016, CGI had contracts with the British Columbia Ministry of Health, the U.S. Navy to work on their NAVSUP Business Systems Center, the Swedish social insurance agency, Sears Canada, and the Queensland government, among others.
In 2016, George D. Schindler succeeded Michael Roach as the third CEO in CGI's history.
In 2019, The Wall Street Journal indicated CGI was one of the cloud providers breached in the Chinese APT10 group's Operation Cloud Hopper hack, which exposed companies' data from 2013 to 2017. The first known target was Rio Tinto, who was accessed through CGI's managed cloud.
In 2024, François Boulanger succeeded George D. Schindler as the CEO.
In 2026, Tim Hulebaus was named CEO upon the announcement of François Boulanger’s retirement.
Corporate affairs
CGI originally stood for "Conseillers en gestion et informatique" (translated to English: "Consultants on management and information systems"). More recently, in English speaking countries it is taken to stand for "Consultants to Government and Industries".
Markets and corporate structure
CGI has an international client base, with large institutional clients in a wide array of industries and markets. The United States made up 29% of their client base as of March 2015, while Canada was the second-highest percentage at 15%. The majority of CGI's remaining contracts were in Europe (around 40%), with 15% in the rest of the world.
CGI has a primary listing on the Toronto Stock Exchange and is a constituent of the S&P/TSX 60. It has a secondary listing on the New York Stock Exchange. As of March 2015, CGI made 42% of its revenue through government contracts.
CGI Federal
CGI Federal is a wholly owned subsidiary of CGI Inc. CGI Federal has partnered with U.S. federal agencies to provide IT services in defense, diplomacy, intelligence, healthcare, environment, homeland security, justice, treasury and more. CGI Federal has annual revenue exceeding US$1 billion.
In 2018, CGI Federal opened an Innovation Center in Arlington, Virginia, to provide a collaboration space for agency and CGI experts to explore the potential of new technologies.
Products and services
Originally CGI focused its products and services on IT consulting, and the company later branched into outsourcing, software development, and systems integration, among other industries. At the end of 2014, CGI earned 52% of its revenue from providing outsourcing services (specifically through IT services and to a lesser degree, business process services) and 48% of its revenue from systems integration and consulting. Services CGI supplies in relation to business consulting include business intelligence, business transformation, change management, cyber security, CIO advisory services, digital enterprise, as well as other industry-specific services. In relation to business process services, CGI offers customer service and billing, payment services, enterprise services, collections, engineering and logistics, document and data services, and a BPS service launch. CGI provides full IT outsourcing services. The following is an overview of services provided by CGI as of 2015:
Application services
Business consulting
Business process services
Infrastructure services
IT outsourcing services
Systems integration services
CGI also develops products and services for markets such as Banking and finance, telecommunications, health, Manufacturing, Life sciences, oil and gas, posts and logistics, retail and consumer services, transportation, and utilities. Clients include both private entities and central governments, state, provincial and local governments, and government departments dealing with defense, intelligence, space, health, human services, public safety, justice, tax, revenue and collections.
Awards
CGI Federal was ranked 26th on the 2018 Washington Technology Top 100, and 72nd on the 2019 Bloomberg Government 200 (BGOV200). The company also was a finalist for the 2018 Greater Washington Government Contractor Awards, Contractor of the Year ($300 million+), and a 2017 ACT-IACT Igniting Innovation Award.
A number of CGI Federal executives have been recognized for leadership in their sectors, including: Tim Hurlebaus, president: 2019 Wash100, 2018 Fed100 and GovCon 2018 Executive of the Year finalist; Stephanie Mango, senior vice president: 2018 Pinnacle Awards, National Security Executive of the Year and 2018 Top 10 Executives to Watch In National Security; Malcolm Harden, vice president: 2019 Fed100; and Steve Sousa, senior vice president: 2018 Top 10 Health Care Leaders to Watch.
Controversies
CGI faced notable challenges with its involvement in the HealthCare.gov website for the U.S. government. As reported by Vanity Fair, CGI's work on the site frustrated government officials due to missed deadlines, with the CMS's chief operating officer stating, "If we could fire them, we would." The Washington Post further highlighted that the company's previous project controversies were not taken into account when awarding the healthcare.gov contract. Additionally, Reuters documented the U.S. government's decision to part ways with CGI after the site "failed to work when it launched in October" and experienced ongoing issues, further igniting political debates.
Separately, in Ontario, CGI encountered issues with an online medical registry project. The Washington Examiner reported that eHealth Ontario, an Ontario provincial agency, decided to cancel CGI Group's $46.2 million contract related to the registry due to being 14 months behind schedule. Furthermore, the contract was terminated, and a group of other IT companies successfully replicated the registry, rendering CGI's project obsolete. Consequently, due to contract stipulations requiring payment only upon satisfactory delivery, the province refused to pay CGI.
In Hawaii, the Affordable Care Act's implementation via the Hawaii Health Connector faced significant obstacles, leading to the resignation of its executive director, Coral Andrews. The Hawaii Health Connector had secured $200 million in federal funding for its establishment, with CGI Group developing its website at a cost of $53 million. However, the website's launch on Oct. 1 encountered severe technical issues, causing user frustrations due to site crashes and inaccessibility. Despite expectations from officials, including Gov. Neil Abercrombie, for a large enrollment, as of Nov. 15, only 257 individuals successfully secured healthcare through the platform. Senate President Donna Mercado Kim had previously cautioned against employing CGI Group, referencing their involvement with the problematic Hawaii state tax department website.
CGI, who was instrumental in developing Hawaii's computerized tax system and a disease surveillance system, has also come under scrutiny from that state's auditor. The system installed by CGI has been credited with a $66 million increase in tax collections since 2008. The state Legislature initiated an audit following concerns about the $25 million contract awarded to CGI for the delinquent tax system and several other contracts. These concerns were spurred by suspicions of improprieties in the contract award process and the modification of an original contract in CGI's favor. The adjusted agreement appeared more beneficial to CGI than to Hawaii, according to House Finance Chairman Marcus Oshiro. The audit was influenced by claims from a former tax research officer, Tu Duc Pham, who suggested that the revised agreement with CGI unduly favored the company. Besides the tax department, the Health Department's ties with CGI are also being evaluated due to noncompetitive contracts awarded to the firm. Overall, CGI has received contracts amounting to approximately $90 million from Hawaii's Tax and Health departments since 1999, with a notable portion being awarded without competitive bidding.
Fuente: Wikipedia (Inglés), CC BY-SA 4.0 · Ver en Wikipedia ↗
Rendimiento a 10 años Tendencias de ingresos, beneficio neto, márgenes y BPA
Valoración Ratios P/E, P/S, P/B, EV/EBITDA: ¿está la acción cara o barata?
| Métrica | Tendencia a 5 años | GIB | promedio 5A | Mediana de Pares | Veredicto |
|---|---|---|---|---|---|
| P/E | 12.1promedio 5A ≈14.1 | ≈14.1 | · | · |
La mediana de empresas comparables se calcula sobre una base estandarizada por métrica y puede no coincidir siempre con la base TTM/MRQ que se muestra para esta acción.
Rentabilidad Márgenes brutos, operativos y netos; ROE, ROA, ROIC
| Métrica | Tendencia a 5 años | GIB | promedio 5A | Mediana de Pares | Veredicto |
|---|---|---|---|---|---|
| Pretax Margin (Margen antes de impuestos) | 14.1%promedio 5A ≈15.1% | ≈15.1% | · | · | |
| Net Profit Margin (Margen de Beneficio Neto) | 10.4%promedio 5A ≈11.2% | ≈11.2% | · | · | |
| ROA | 9.2%promedio 5A ≈9.8% | ≈9.8% | · | · | |
| ROE | 16.8%promedio 5A ≈19.3% | ≈19.3% | · | · |
Salud financiera Deuda, liquidez, solvencia — solidez del balance general
| Métrica | Tendencia a 5 años | GIB | promedio 5A | Mediana de Pares | Veredicto |
|---|---|---|---|---|---|
| Current Ratio (Ratio corriente) | 1.0promedio 5A ≈1.2 | ≈1.2 | · | · | |
| Quick Ratio (Ratio Rápido) | 0.5promedio 5A ≈0.7 | ≈0.7 | · | · |
Crecimiento Crecimiento de ingresos, BPA y beneficio neto: interanual, CAGR a 3 años, CAGR a 5 años
Aún no hay datos fundamentales para este ticker.
Eficiencia de capital Rotación de activos, rotación de inventario, rotación de cuentas por cobrar
| Métrica | Tendencia a 5 años | GIB | promedio 5A | Mediana de Pares | Veredicto |
|---|---|---|---|---|---|
| Asset Turnover (Rotación de Activos) | 0.9promedio 5A ≈0.9 | ≈0.9 | · | · | |
| Receivables Turnover (Rotación de Cuentas por Cobrar) | 10.6promedio 5A ≈10.2 | ≈10.2 | · | · | |
| Revenue / Employee (Ingresos / Empleado) | ≈$169.3K | · | · | · |
valor · ≈ promedio 5A · mediana sectorial · veredicto relativo a la mediana
Dividendos Rendimiento, ratio de pago, historial de dividendos, CAGR a 5 años
| Fecha ex-dividendo | Monto | Moneda | Rendimiento |
|---|---|---|---|
| Ago 14, 2026 | $0,12 | USD | ≈0.65% |
| May 15, 2026 | $0,12 | USD | ≈0.74% |
| Feb 18, 2026 | $0,13 | USD | ≈0.46% |
| Ago 15, 2025 | $0,11 | USD | ≈0.46% |
| May 16, 2025 | $0,11 | USD | ≈0.30% |
| Feb 14, 2025 | $0,11 | USD | ≈0.18% |
| Nov 20, 2024 | $0,11 | USD | ≈0.10% |
Historial de Ganancias EPS real vs estimado, sorpresa %, tasa de aciertos, próxima fecha de resultados
| Período | Informe | EPS Actual | EPS est. | Sorpresa |
|---|---|---|---|---|
| 30 de junio de 2026 | $2.29 | $2.35 | -2.6% | |
| 31 de marzo de 2026 | $2.27 | $2.34 | -2.8% | |
| 31 de diciembre de 2025 | $2.12 | $2.18 | -2.8% | |
| 30 de septiembre de 2025 | $2.13 | $2.16 | -1.3% | |
| 30 de junio de 2025 | $2.10 | $2.14 | -1.9% | |
| 31 de marzo de 2025 | $2.12 | $2.19 | -3.3% |
Fundamentales Completos Todas las métricas por año — estado de resultados, balance general, flujo de caja
Estado de resultados
| Métrica | Tendencia | 2025 | 2024 | 2023 | 2022 | 2021 | 2020 | 2019 | 2018 | 2017 |
|---|---|---|---|---|---|---|---|---|---|---|
| Revenue | $15.91B | $14.68B | $14.30B | $12.87B | $12.13B | $12.16B | $12.11B | $11.51B | $10.85B | |
| Interest Expense | $129M | $91M | $94M | $95M | $110M | $120M | $82M | $77M | $74M | |
| Interest Income | $45M | $63M | $41M | $3M | $3M | $5M | $12M | $3M | $4M | |
| Pretax Income | $2.24B | $2.29B | $2.20B | $1.97B | $1.84B | $1.52B | $1.68B | $1.49B | $1.42B | |
| Income Tax | $584M | $598M | $567M | $501M | $469M | $398M | $414M | $349M | $383M | |
| Net Income | $1.66B | $1.69B | $1.63B | $1.47B | $1.37B | $1.12B | $1.26B | $1.14B | $1.04B | |
| EPS (Basic) | $7.45 | $7.42 | $6.97 | $6.13 | $5.50 | $4.27 | $4.63 | $4.02 | $3.48 | |
| EPS (Diluted) | $7.35 | $7.31 | $6.86 | $6.04 | $5.41 | $4.20 | $4.55 | $3.95 | $3.41 | |
| Shares (Basic) | 222,693,319 | 228,074,108 | 234,041,041 | 239,262,004 | 249,119,219 | 262,005,521 | 272,719,309 | 283,878,426 | 297,516,970 | |
| Shares (Diluted) | 225,489,344 | 231,672,861 | 237,702,081 | 242,867,445 | 253,088,880 | 266,104,062 | 277,785,724 | 288,858,580 | 303,293,485 | |
| EBITDA | · | · | · | · | · | · | $388M | $384M | · |
Balance general
| Métrica | Tendencia | 2025 | 2024 | 2023 | 2022 | 2021 | 2020 | 2019 | 2018 | 2017 |
|---|---|---|---|---|---|---|---|---|---|---|
| Cash & Equivalents | $864M | $1.46B | $1.57B | $966M | $1.70B | $1.71B | $214M | $184M | $166M | |
| Receivables | $1.61B | $1.40B | $1.43B | $1.36B | $1.23B | $1.22B | $1.36B | $1.48B | $1.29B | |
| Current Assets | $5.05B | $4.82B | $4.93B | $4.35B | $4.77B | $4.94B | $3.26B | $3.10B | $2.86B | |
| PP&E (Net) | $378M | $367M | $389M | $370M | $352M | $373M | $398M | $388M | $397M | |
| Goodwill | $11.74B | $9.47B | $8.72B | $8.48B | $8.14B | $8.38B | $7.77B | $7.34B | $7.06B | |
| Intangibles | $888M | $719M | $623M | $616M | $507M | $521M | $518M | $479M | $490M | |
| Total Assets | $19.52B | $16.69B | $15.80B | $15.18B | $15.02B | $15.55B | $12.62B | $11.92B | $11.40B | |
| Accounts Payable | $1.01B | $1000M | $925M | $1.02B | $891M | $814M | $1.11B | $1.13B | $1.00B | |
| Current Liabilities | $5.10B | $3.55B | $4.65B | $3.65B | $3.80B | $3.66B | $2.88B | $3.12B | $2.70B | |
| Total Liabilities | $9.24B | $7.26B | $7.49B | $7.90B | $8.03B | $8.29B | $5.74B | $5.23B | $5.19B | |
| Retained Earnings | $7.43B | $7.13B | $6.33B | $5.43B | $4.73B | $4.70B | $4.56B | $4.25B | $3.79B | |
| Stockholders' Equity | $10.28B | $9.43B | $8.31B | $7.27B | $6.99B | $7.26B | $6.79B | $6.68B | $6.20B |
Flujo de Efectivo
| Métrica | Tendencia | 2025 | 2024 | 2023 | 2022 | 2021 | 2020 | 2019 | 2018 | 2017 |
|---|---|---|---|---|---|---|---|---|---|---|
| D&A | · | · | · | · | · | · | $388M | $384M | $366M | |
| Other Non-cash | · | · | · | · | · | · | $-17M | $-32M | · | |
| Operating Cash Flow | $2.23B | $2.20B | $2.11B | $1.86B | $2.12B | $1.94B | $1.63B | $1.49B | $1.36B | |
| CapEx | $117M | $110M | $160M | $156M | $122M | $128M | $162M | $143M | $113M | |
| Investing Cash Flow | $-2.20B | $-775M | $-562M | $-912M | $-389M | $-572M | $-951M | $-577M | $-592M | |
| Dividends Paid | $135M | $0 | · | · | · | · | · | · | · | |
| Financing Cash Flow | $-247M | $-1.61B | $-1.19B | $-1.59B | $-1.78B | $94M | $-629M | $-879M | $-1.18B | |
| Free Cash Flow | $2.12B | $2.10B | $1.95B | $1.71B | $1.99B | $1.81B | $1.47B | $1.35B | · | |
| Levered FCF | $2.02B | $2.03B | $1.88B | $1.64B | $1.91B | $1.72B | $1.41B | $1.29B | · |
Rentabilidad
| Métrica | Tendencia | 2025 | 2024 | 2023 | 2022 | 2021 | 2020 | 2019 | 2018 | 2017 |
|---|---|---|---|---|---|---|---|---|---|---|
| Net Margin | 10.4% | 11.5% | 11.4% | 11.4% | 11.3% | 9.2% | 10.4% | 9.9% | · | |
| Pretax Margin | 14.1% | 15.6% | 15.4% | 15.3% | 15.2% | 12.5% | 13.9% | 13.0% | · | |
| EBITDA Margin | · | · | · | · | · | · | 3.2% | 3.3% | · | |
| ROA | 9.2% | 10.4% | 10.5% | 9.7% | 9.0% | 7.8% | 10.3% | 9.8% | · | |
| ROE | 16.8% | 19.1% | 20.9% | 20.6% | 19.2% | 15.9% | 18.6% | 17.7% | · |
Liquidez y Solvencia
| Métrica | Tendencia | 2025 | 2024 | 2023 | 2022 | 2021 | 2020 | 2019 | 2018 | 2017 |
|---|---|---|---|---|---|---|---|---|---|---|
| Current Ratio | 1.0 | 1.4 | 1.1 | 1.2 | 1.3 | 1.4 | 1.1 | 1.0 | · | |
| Quick Ratio | 0.5 | 0.8 | 0.6 | 0.6 | 0.8 | 0.8 | 0.5 | 0.5 | · |
Eficiencia
| Métrica | Tendencia | 2025 | 2024 | 2023 | 2022 | 2021 | 2020 | 2019 | 2018 | 2017 |
|---|---|---|---|---|---|---|---|---|---|---|
| Asset Turnover | 0.9 | 0.9 | 0.9 | 0.9 | 0.8 | 0.8 | 1.0 | 1.0 | · | |
| Receivables Turnover | 10.6 | 10.4 | 10.3 | 9.9 | 9.9 | 9.4 | 8.5 | 8.3 | · |
Por Acción
| Métrica | Tendencia | 2025 | 2024 | 2023 | 2022 | 2021 | 2020 | 2019 | 2018 | 2017 |
|---|---|---|---|---|---|---|---|---|---|---|
| Revenue / Share | $70.57 | $63.35 | $60.14 | $52.98 | $47.92 | $45.71 | $43.60 | $39.84 | · | |
| Cash Flow / Share | $9.91 | $9.52 | $8.89 | $7.68 | $8.36 | $7.29 | $5.88 | $5.17 | · | |
| EPS (TTM) | $7.35 | $7.31 | $6.86 | $6.04 | $5.41 | $4.20 | $4.55 | $3.95 | · |
Valoración (TTM)
| Métrica | Tendencia | 2025 | 2024 | 2023 | 2022 | 2021 | 2020 | 2019 | 2018 | 2017 |
|---|---|---|---|---|---|---|---|---|---|---|
| Revenue TTM | $15.91B | $14.68B | $14.30B | $12.87B | $12.13B | $12.16B | $12.11B | $11.51B | · | |
| Net Income TTM | $1.66B | $1.69B | $1.63B | $1.47B | $1.37B | $1.12B | $1.26B | $1.14B | · | |
| P/E | 12.1 | 15.7 | 14.4 | 12.5 | 15.7 | 16.1 | 17.4 | 16.3 | · | |
| Earnings Yield | 8.2% | 6.4% | 7.0% | 8.0% | 6.4% | 6.2% | 5.8% | 6.1% | · | |
| Payout Ratio | 8.1% | · | · | · | · | · | · | · | · | |
| Annual Payout | $135M | $0 | · | · | · | · | · | · | · |
Por Acción
| Métrica | Tendencia | Q4 2017 | Q4 2016 | Q4 2015 | Q4 2014 | Q4 2013 | Q4 2012 | Q4 2011 | Q4 2010 | Q4 2009 | Q4 2008 | Q4 2007 | Q4 2006 | Q4 2005 | Q4 2004 | Q4 2003 | Q4 2002 |
|---|---|---|---|---|---|---|---|---|---|---|---|---|---|---|---|---|---|
| EPS (TTM) | $3.41 | · | · | · | · | · | · | · | · | · | · | · | · | · | · | · |
Valoración (TTM)
| Métrica | Tendencia | Q4 2017 | Q4 2016 | Q4 2015 | Q4 2014 | Q4 2013 | Q4 2012 | Q4 2011 | Q4 2010 | Q4 2009 | Q4 2008 | Q4 2007 | Q4 2006 | Q4 2005 | Q4 2004 | Q4 2003 | Q4 2002 |
|---|---|---|---|---|---|---|---|---|---|---|---|---|---|---|---|---|---|
| Revenue TTM | $10.85B | · | · | · | · | · | · | · | · | · | · | · | · | · | · | · | |
| Net Income TTM | $1.04B | · | · | · | · | · | · | · | · | · | · | · | · | · | · | · | |
| P/E | 15.2 | · | · | · | · | · | · | · | · | · | · | · | · | · | · | · | |
| Earnings Yield | 6.6% | · | · | · | · | · | · | · | · | · | · | · | · | · | · | · |
Período más reciente a la izquierda · valores nulos mostrados como ·
Estados Financieros Estado de resultados, balance general, flujo de caja — anual, últimos 5 años
| Métrica | 2025-09-30 | 2024-09-30 | 2023-09-30 | 2022-09-30 | 2021-09-30 |
|---|---|---|---|---|---|
| Ingresos | $15.91B | $14.68B | $14.30B | $12.87B | $12.13B |
| Beneficio neto | $1.66B | $1.69B | $1.63B | $1.47B | $1.37B |
| EPS Diluido | $7.35 | $7.31 | $6.86 | $6.04 | $5.41 |
| Métrica | 2025-09-30 | 2024-09-30 | 2023-09-30 | 2022-09-30 | 2021-09-30 |
|---|---|---|---|---|---|
| Ratio corriente | 1.0 | 1.4 | 1.1 | 1.2 | 1.3 |
| Ratio Rápido | 0.5 | 0.8 | 0.6 | 0.6 | 0.8 |
| Métrica | 2025-09-30 | 2024-09-30 | 2023-09-30 | 2022-09-30 | 2021-09-30 |
|---|---|---|---|---|---|
| Flujo de caja libre | $2.12B | $2.10B | $1.95B | $1.71B | $1.99B |
Propietarios institucionales (13F) 351 declarantes · $8.7B total · A fecha de 30 de septiembre de 2026
Instituciones que informan tener esta acción en su Formulario 13F trimestral de la SEC. Solo posiciones largas; un solo presentador puede aparecer dos veces para tramos de opciones separados. Las patas de put/call de compensación grandes suelen reflejar la creación de mercado o el inventario cubierto, no la convicción direccional.
| Nuevas posiciones | Posiciones cerradas | Aumentado | Disminuido | Cambio neto de acciones |
|---|---|---|---|---|
| 33 (-18 vs trimestre anterior) | 45 (-3 vs trimestre anterior) | 114 (+10 vs trimestre anterior) | 130 (-8 vs trimestre anterior) | +6.0M |
Comparado con Q1 2026. Las presentaciones del Formulario 13F de la SEC vencen dentro de los 45 días posteriores al final del trimestre, más un pequeño margen para los presentadores tardíos; los trimestres que aún se encuentran dentro de esa ventana se omiten en favor del par más reciente completamente reportado.
| Institución | Valor | Acciones | % de 13F rastreadas | Tipo |
|---|---|---|---|---|
| Caisse de depot et placement du Quebec | $1 052 580 753 | 16 290 487 | 12,07% | Acciones |
| FIL Ltd | $799 499 364 | 12 369 259 | 9,17% | Acciones |
| VANGUARD GROUP INC | $763 852 418 | 8 269 665 | 8,76% | Acciones |
| MACKENZIE FINANCIAL CORP | $474 301 955 | 5 174 015 | 5,44% | Acciones |
| JARISLOWSKY, FRASER Ltd | $359 373 310 | 4 033 813 | 4,12% | Acciones |
| VANGUARD CAPITAL MANAGEMENT LLC | $343 267 447 | 5 310 778 | 3,94% | Acciones |
| Federation des caisses Desjardins du Quebec | $315 963 758 | 4 950 938 | 3,62% | Acciones |
| Fiera Capital Corp | $295 096 949 | 4 573 729 | 3,38% | Acciones |
| 1832 Asset Management L.P. | $263 864 918 | 4 086 494 | 3,03% | Acciones |
| BANK OF MONTREAL /CAN/ | $258 843 388 | 4 008 647 | 2,97% | Acciones |
| ROYAL BANK OF CANADA | $255 239 000 | 3 952 911 | 2,93% | Acciones |
| GEODE CAPITAL MANAGEMENT, LLC | $195 990 741 | 2 850 082 | 2,25% | Acciones |
| NATIONAL BANK OF CANADA /FI/ | $192 607 194 | 3 016 000 | 2,21% | Acciones |
| MORGAN STANLEY | $171 541 543 | 2 656 675 | 1,97% | Acciones |
| NORGES BANK | $164 950 107 | 2 554 544 | 1,89% | Acciones |
| GUARDIAN CAPITAL LP | $142 240 890 | 2 201 421 | 1,63% | Acciones |
| Groupe la Francaise | $111 335 343 | 1 722 751 | 1,28% | Acciones |
| VANGUARD FIDUCIARY TRUST CO | $108 981 144 | 1 686 075 | 1,25% | Acciones |
| CIBC WORLD MARKET INC. | $107 144 051 | 1 659 114 | 1,23% | Acciones |
| MASSACHUSETTS FINANCIAL SERVICES CO /MA/ | $103 570 242 | 1 300 860 | 1,19% | Acciones |
| TD Asset Management Inc | $97 247 736 | 1 505 075 | 1,12% | Acciones |
| BARCLAYS PLC | $97 079 509 | 1 503 477 | 1,11% | Acciones |
| BANK OF AMERICA CORP /DE/ | $90 463 345 | 1 401 012 | 1,04% | Acciones |
| GOLDMAN SACHS GROUP INC | $86 801 407 | 1 344 299 | 1,00% | Acciones |
| MANUFACTURERS LIFE INSURANCE COMPANY, THE | $82 632 526 | 1 280 962 | 0,95% | Acciones |
| Legal & General Group Plc | $81 014 215 | 1 253 837 | 0,93% | Acciones |
| Burgundy Asset Management Ltd. | $77 563 685 | 799 246 | 0,89% | Acciones |
| CANADA PENSION PLAN INVESTMENT BOARD | $77 508 356 | 1 200 354 | 0,89% | Acciones |
| JPMORGAN CHASE & CO | $57 377 650 | 900 324 | 0,66% | Acciones |
| TORONTO DOMINION BANK | $55 564 465 | 860 537 | 0,64% | Acciones |
| Vanguard Global Advisers, LLC | $53 318 042 | 824 897 | 0,61% | Acciones |
| CHARLES SCHWAB INVESTMENT MANAGEMENT INC | $47 655 994 | 737 558 | 0,55% | Acciones |
| TD Waterhouse Canada Inc. | $46 950 415 | 716 591 | 0,54% | Acciones |
| DEUTSCHE BANK AG\ | $45 074 315 | 698 069 | 0,52% | Acciones |
| Quadrature Capital Ltd | $44 402 202 | 687 200 | 0,51% | Acciones |
| FIRST TRUST ADVISORS LP | $42 692 407 | 661 113 | 0,49% | Acciones |
| Clearbridge Investments, LLC | $41 400 220 | 641 168 | 0,47% | Acciones |
| Alberta Investment Management Corp | $39 409 515 | 610 326 | 0,45% | Acciones |
| Swiss National Bank | $39 196 916 | 608 200 | 0,45% | Acciones |
| Grantham, Mayo, Van Otterloo & Co. LLC | $36 510 021 | 565 055 | 0,42% | Acciones |
| DIMENSIONAL FUND ADVISORS LP | $36 159 883 | 560 064 | 0,41% | Acciones |
| SCOTIA CAPITAL INC. | $34 316 458 | 536 650 | 0,39% | Acciones |
| NEW SOUTH CAPITAL MANAGEMENT INC | $33 184 589 | 513 932 | 0,38% | Acciones |
| MONTRUSCO BOLTON INVESTMENTS INC. | $32 337 235 | 500 474 | 0,37% | Acciones |
| Northwest & Ethical Investments L.P. | $31 420 639 | 486 672 | 0,36% | Acciones |
| BNP PARIBAS ASSET MANAGEMENT Holding S.A. | $31 044 650 | 481 183 | 0,36% | Acciones |
| BlackRock, Inc. | $29 412 252 | 455 510 | 0,34% | Acciones |
| Amundi | $28 003 233 | 433 688 | 0,32% | Acciones |
| VANGUARD ASSET MANAGEMENT, Ltd | $25 531 026 | 394 997 | 0,29% | Acciones |
| Scheer, Rowlett & Associates Investment Management Ltd. | $24 435 699 | 378 430 | 0,28% | Acciones |
Activistas y propietarios del %+ 5 5 tenencias
Inversores que presentaron el Anexo 13D de la SEC — propiedad beneficiosa superior al % 5 con la intención de influir en el emisor (participaciones activistas, campañas de la junta directiva, M&A). Cada fila muestra el estado conocido más reciente de la posición de ese declarante.
| Declarante | Presentado | Participación | Estado | Propósito | Presentación |
|---|---|---|---|---|---|
| Caisse de dépôt et placement du Québec ×2 presentaciones | 2 de diciembre de 2013 | · | Presentación inicial | · | SEC |
| CGI Group Inc., CGI Federal Inc. ×4 presentaciones | 17 de agosto de 2010 | · | Presentación inicial | · | SEC |
| Persona informante no revelada | 8 de diciembre de 2003 | · | Presentación inicial | · | SEC |
| Persona informante no revelada | 19 de agosto de 2003 | · | Presentación inicial | · | SEC |
| / S.S. OR ×2 presentaciones | 27 de julio de 2001 | · | Presentación inicial | · | SEC |
Purpose is an automated classification of the filer's own stated purpose (SEC Item 4) — not investment advice. "—" means no clear purpose was stated or the text could not be classified.
Propiedad de ETFs Mantenido por 21 ETFs
El peso refleja solo las tenencias directas de acciones (N-PORT); los fondos apalancados o basados en derivados pueden tener exposición adicional a swaps no mostrada.
| Fondo | Ponderación | Unidades | A fecha de | Fuente |
|---|---|---|---|---|
| ICOW · Pacer Funds Trust | 0,75% | 184 985 NS | 31 de julio de 2026 | N-PORT |
| FOWF · Pacer Funds Trust | 0,69% | 1 493 NS | 31 de julio de 2026 | N-PORT |
| QLVD · FlexShares Trust | 0,55% | 4 128 NS | 31 de julio de 2026 | N-PORT |
| RODM · Lattice Strategies Trust | 0,46% | 102 415 NS | 31 de julio de 2026 | N-PORT |
| BBCA · J.P. Morgan Exchange-Traded Fund Tr… | 0,44% | 658 257 NS | 31 de julio de 2026 | N-PORT |
| FEDM · FlexShares Trust | 0,28% | 3 038 NS | 31 de julio de 2026 | N-PORT |
| FDEV · Fidelity Covington Trust | 0,23% | 8 867 NS | 31 de julio de 2026 | N-PORT |
| PIEL · Pacer Funds Trust | 0,19% | 29 NS | 31 de julio de 2026 | N-PORT |
| SPTE · SP Funds Trust | 0,14% | 4 172 NS | 31 de julio de 2026 | N-PORT |
| TDVI · First Trust Exchange-Traded Fund IV | 0,14% | 10 186 NS | 31 de julio de 2026 | N-PORT |
| DIHP · Dimensional ETF Trust | 0,10% | 88 292 NS | 31 de julio de 2026 | N-PORT |
| SPWO · SP Funds Trust | 0,07% | 2 002 NS | 31 de julio de 2026 | N-PORT |
| IGM · iShares Trust | 0,06% | 88 048 SH | 11 de septiembre de 2026 | Diario |
| TLTD · FlexShares Trust | 0,06% | 5 181 NS | 31 de julio de 2026 | N-PORT |
| DFSI · Dimensional ETF Trust | 0,05% | 8 582 NS | 31 de julio de 2026 | N-PORT |
| BKIE · BNY Mellon ETF Trust | 0,05% | 9 077 NS | 31 de julio de 2026 | N-PORT |
| DFAI · Dimensional ETF Trust | 0,05% | 108 961 NS | 31 de julio de 2026 | N-PORT |
| ESGG · FlexShares Trust | 0,03% | 513 NS | 31 de julio de 2026 | N-PORT |
| DFAX · Dimensional ETF Trust | 0,03% | 50 889 NS | 31 de julio de 2026 | N-PORT |
| DFIC · Dimensional ETF Trust | 0,03% | 59 873 NS | 31 de julio de 2026 | N-PORT |
| VOXP · Advisors Series Trust | 0,02% | 15 NS | 31 de julio de 2026 | N-PORT |
GIB Consenso de analistas Opiniones de analistas alcistas y bajistas, precio objetivo a 12 meses, potencial alcista
Precio objetivo a 12 meses
2 analistas · 2026-09-29Objetivo medio $81.50 +16,1%
Últimas noticias Noticias recientes que mencionan a esta empresa
Mis Métricas Tu lista de seguimiento personal — filas seleccionadas de Fundamentales Completos
Seleccione las métricas que le importan: haga clic en el + junto a cualquier fila en Fundamentales completos arriba.
Tu selección se guarda y te sigue en todos los tickers.