
ASML ASML Holding N.V. - New York Registry Shares
NASDAQ · Semiconductors · SEC EDGAR पर देखें ↗ बंद अक्ट 6, 2026 10-K/10-Q फ़र 25, 2026ASML स्टॉक स्नैपशॉट मूल्य, बाजार पूंजीकरण, P/E, EPS, ROE, ऋण/इक्विटी, 52-सप्ताह की सीमा
ASML स्टॉक मूल्य चार्ट तकनीकी संकेतकों के साथ दैनिक OHLCV — पैन, ज़ूम और अपना दृश्य कस्टमाइज़ करें
बार ग्रैन्युलैरिटी चयनित अवधि के अनुसार अनुकूलित होती है — बार के लिए ओपन/हाई/लो/क्लोज देखने के लिए चार्ट पर होवर करें।
| एक्स-डेट | स्प्लिट | प्रकार |
|---|---|---|
| 1 अक्टूबर 2007 | 1-for-1 | रिवर्स |
| 17 अप्रैल 2000 | 3-for-1 | फॉरवर्ड |
| 8 मई 1998 | 2-for-1 | फॉरवर्ड |
| 12 मई 1997 | 2-for-1 | फॉरवर्ड |
ASML Holding N.V. - New York Registry Shares के बारे में विकिपीडिया से कंपनी का अवलोकन
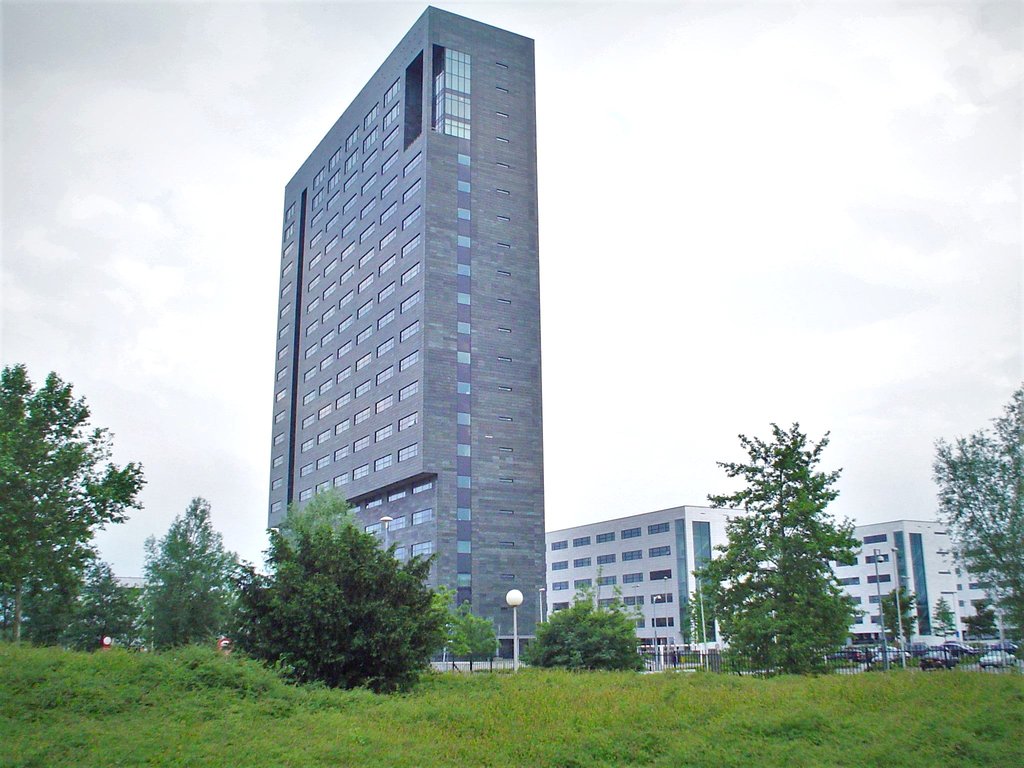
ASML Holding N.V. (originally an abbreviation of Advanced Semiconductor Materials Lithography) is a Dutch company that develops and manufactures photolithography machines used to produce integrated circuits. It is the largest supplier to the semiconductor industry and, as of 2026, the world's only manufacturer of extreme ultraviolet (EUV) lithography machines, which are required to manufacture the most advanced semiconductor chips. As of January 2026, ASML had a market capitalization of approximately $527 billion, making it Europe's largest technology company and one of its most valuable companies overall.
ASML was founded in 1984 as a joint venture between the Dutch technology companies Philips and ASM International and became an independent publicly traded company four years later. The company was established to complete development of a lithography machine that Philips had been developing internally, but initially had no market-ready products. ASML's first product, the PAS 2000, was a commercial and technical failure, but the company achieved commercial success in the early 1990s with the PAS 5500. By 2002, it had become the world's largest supplier of lithography machines.
Meanwhile, in 1997, ASML began developing its EUV lithography technology. To help fund the expensive research and development required, Intel invested $4.1 billion in ASML in July 2012 in exchange for a 15 percent stake. Samsung and TSMC subsequently acquired smaller stakes under the same co-investment program. ASML completed development of the first commercially viable EUV machines in the late 2010s. During the 2010s and 2020s, the governments of the Netherlands and the United States imposed increasingly stringent controls on ASML's sales of semiconductor manufacturing equipment to China, citing concerns including national security and the protection of advanced semiconductor technology.
ASML's corporate headquarters are in Veldhoven, near Eindhoven, in the Netherlands, where the company conducts research and development and manufactures and assembles its products. Additionally the company has offices in more than a dozen countries. ASML employs more than 42,000 people and has a network of nearly 5,000 direct suppliers.
History
Background
ASML can be traced back to the 1970s and the Dutch electronics company Philips. The firm, having observed that the wider electronics industry had been struggling to shrink features without losing accuracy or letting contamination/flaws increase, decided to develop its own prototype lithography machines, harnessing Philips' established knowledge in the fields of optics and precision mechanics. By the early 1980s, Philips had projected that considerable additional investment would be necessary to complete its development, but this need came at a time in which the company was trying to reduce expenditure. Accordingly, in 1984, the company elected to spin-off its lithography machine activities into a joint venture with another Dutch firm, ASM International, which specialised in the supply of equipment to the semiconductor industry.
The new entity used a different business strategy to established competitors; lacking the capital, time, and expertise to realistically pursue vertical integration, instead, the joint venture opted to outsource various major components, including motors and optics, to other parties so that it could dedicate its resources and attention on the assembly and optimisation of the final machine. This decision shaped the machine as well, which adopted a modular design and used clearly defined subsystems. Early on, ASML struggled to secure business, having no market share and no brand recognition at the start of its operations. Furthermore, the firm's first product, the PAS 2000, was a commercial and technical failure, having used oil pressure (instead of electric motors) to move the wafer during exposure, which had a tendency to leak; future lithograph machines made by ASML would use conventional electric motors instead.
The design was improved shortly after, using electric motors and, as one of the first contribution of a newly hired Martin van den Brink, a grid profile to improve the precision of the alignment. The resulting PAS 2400 wasn't as accurate as ASML was hoping for, but it could expose 90 wafers per hour, and it was used as a demonstrator in 1985 to win a first contract with AMD that promised to deliver 25 machines by 1987. In 1986, the company, which had grown from 17 employees to over 200, delivered the first truly competitive wafer stepper to Philips: the PAS 2500. This model was the result of ASML's new policy of splitting the design into modular subsystems and outsourcing the manufacturing as much as possible; for instance, it was equipped with a standard lens from Carl Zeiss.
Independence and commercial breakout
By the start of 1988, Philips was reportedly considered shutting down the joint venture entirely after ASM International pulled out. However, sufficient support was present on Philip's board to continue with operations, giving ASML the time to develop another lithography machine, the PAS 5500. Accordingly, in 1988, ASML became an independent publicly traded entity; that same year, it first adopted the name ASML, which is its official name and not an abbreviation.
In 1991, ASML released the PAS 5500, which quickly became the company's first commercial breakout. In contrast to the more precise contemporary lithography machines from competing firm Nikon, the modular design used by ASML meant that its machines could be fixed quickly on site, reducing downtime and making it possible to extend the machine’s operating life. The serviceability advantage was reportedly the key factor that led to IBM ordering the PAS 5500 over its Japanese counterparts. The first company to operate the PAS 5500 was Micron Technology, one of the world's largest producers of computer memory and storage; it became ASML's largest customer for a time. The success of the PAS 5500 line propelled ASML into a period of intense competition with both Canon and Nikon, who were the leaders of the lithography market at the time.
In 1997, ASML began studying a shift to using extreme ultraviolet. Two years later, it joined a consortium, which included Intel and two other U.S. chipmakers, in order to exploit fundamental research conducted by the US Department of Energy. Because the Cooperative Research and Development Agreement (CRADA) it operates under is funded by the US government, licensing must be approved by Congress. Furthermore, in return for being permitted to join this consortium, ASML committed to the establishment of a US-based research center and to source 55 percent of components for all machines sold in the US from American suppliers. ASML collaborated with various manufacturers to obtain mirrors, including the Belgian firms IMEC and Sematech as well as Germany's Carl Zeiss.
2000s
In 2001, ASML acquired the US-based lithography equipment manufacturer Silicon Valley Group (SVG) after it had encountered liquidity issues, The SVG acquisition, which has also been licensed for EUV research results, involved ASML in an arrangement to supply 193 nm scanners to Intel.
In 2002, it became the largest supplier of photolithography systems. Aided by the adoption of the dual-stage TWINSCAN architecture to reduce idle time, ASML machines could produce more chips per hour than any competitor's products; this competitive edge was so strong that the company could charge higher prices for their machines and still grow its market share. By the end of the decade, it had secured two thirds of the global lithography market and had become the dominant supplier for the growing smartphone market.
During December 2006, ASML announced the acquisition of rival firm BRION Technologies in exchange for $270 million; this transaction brought the company into direct competition with the major Electronic design automation (EDA) vendors who had similar products - Cadence Design Systems, Synopsys, and Mentor Graphics.
During late 2008, following the start of the Great Recession, ASML experienced a large drop in sales, which led management to cut the workforce by about 1000 worldwide, mainly at its headquarters in the Netherlands as well its Connecticut manufacturing plant; additionally, the firm applied for support from the Dutch national unemployment fund to prevent even larger layoffs. ASML had recovered by 2011, reporting record-high revenue for that year.
2010s
During the early 2010s, ASML sharply increased its annual R&D budget, rising from just under $500 million in 2010 to $1 billion in 2015. While this expenditure was necessary in order to complete the development of its next generation EUV machines, financing such amounts was not straightforward. To achieve this, ASML launched a co-investment program in 2012, under which 23 percent of the company was sold to its three largest customers: Intel, TSMC and Samsung. Intel's investment of $4.1 billion into ASML, made in July 2012, gave it a 15 percent stake in the company; this move was stated to accelerate Intel's transition from 300 mm to 450 mm wafers as well as support further development of EUV lithography. That same month, ASML offered another 10 percent of its shares to other companies.
Beyond simply generating additional funds, these new stakeholders were incentivised to participate in ASML's research efforts. TSMC in particular worked closely with ASML to develop and troubleshoot its EUV machines, being keen to use them to manufacture their own products. As part of their EUV strategy, ASML announced the acquisition of DUV and EUV sources manufacturer Cymer in exchange for $2.55 billion in October 2012; this transaction was completed in May 2013. Cymer's technology was viewed as being useful to developing ASML's EUV machines.
In November 2013, ASML paused development of 450 mm lithography equipment, citing uncertain timing of chipmaker demand.
In early 2015, ASML reported an instance of intellectual property theft; allegedly a number of employees had been found stealing confidential data from its Silicon Valley software subsidiary that develops software for machine optimization. Three years later, ASML was awarded $223 million in damages pertaining to this incident, as well as securing the offending company's own intellectual property. ASML employees have often been viewed as highly desirable recruitment targets for other tech companies.
In June 2016, ASML announced their plans to acquire Taiwan-based Hermes Microvision Inc. in exchange for about $3.1 billion; it was reported that this transaction would secure technology for creating smaller and more advanced semiconductors.
In 2018, the Trump administration tried to block the sale of ASML technology to China. This move, which has been viewed as part of a wider "technological cold war" between the US and China, may have contributed to the 2020–2023 global chip shortage and impacted the business opportunities available to ASML.
2020s
Throughout the late 2010s and early 2020s, ASML experienced a period of steady revenue growth, rising from $13 billion in 2018 up to $35 billion in 2024; this has been largely credited to the firm's EUV machines, which have received a significant surge in demand during this period, driven by modern electronics' increasing complexity and performance requirements. In July 2020, ASML stated that it had acquired the German optical glassmaking firm Berliner Glas Group, which will help to satisfy the increasing need for components for its EUV systems; at the time of this acquisition, ASML's outstanding orders had reportedly risen to €10 billion.
In July 2021, European Commissioner Thierry Breton, visited ASML and announced a goal of at least 20 percent of global production of semiconductors in Europe by 2030, and support via a European Alliance on semiconductors. After reporting earnings in July 2021, the company said they had a near monopoly for machines used by TSMC and Samsung to make the advanced chips.
In February 2023, ASML claimed that a former worker in China "allegedly" stole information about the company's technology. This was not the first time that ASML was allegedly linked with an intellectual property breach connected to China. In its 2021 annual report, ASML mentioned that Dongfang Jingyuan Electron Limited "was actively marketing products in China that could potentially infringe on ASML's IP rights." At the time, the United States Department of Commerce expressed concern about economic espionage against ASML. In October 2023, Dutch newspaper NRC Handelsblad reported that the former employee who "allegedly" stole data about ASML's technology subsequently went to work for Huawei.
In March 2023, the Dutch government placed restrictions on chip equipment exports in order to protect national security. This measure affected ASML as one of the most important companies in the global microchip supply chain. Export license requirements came into effect in September 2023. Three months later, the Netherlands' Institute for Human Rights ruled that despite the country's constitution prohibiting discrimination based on nationality, ASML was allowed to reject job applications from residents of countries subject to sanctions under the U.S. Export Administration Regulations (such as China, Cuba, Iran, North Korea, and Syria) in order to remain compliant with U.S. law.
In January 2024, the Dutch government placed further restrictions on the shipment of some advanced chip-making equipment to China. On 6 September 2024, the Dutch government tightened export controls on certain ASML chipmaking equipment, aligning its policy with U.S. restrictions to limit China's access to advanced technology amid safety and geopolitical concerns. These restrictions were expanded for tighter export controls in January 2025, with ASML required to apply for export licenses with the Dutch government instead of the U.S. In December 2025, Reuters reported that China had secretly built a prototype EUV machine in Shenzhen with the assistance of former ASML engineers, with the machine expected to produce working chips between 2028 and 2030.
Products
ASML produces the photolithography machines used in the production of integrated circuits, called "scanners". In these machines, patterns are optically imaged onto a silicon wafer that is covered with a film of light-sensitive material (photoresist). This procedure is repeated dozens of times on a single wafer. The photoresist is then further processed to create the actual electronic circuits on the silicon. The optical imaging that ASML's machines deal with is used in the fabrication of nearly all integrated circuits. As of 2025, ASML had 83% percent of the worldwide sales of lithography machines.
ASML's earlier competition consisted of Ultratech, Canon, Nikon, MKS Instruments, Lam Research and Cadence Design Systems.
Immersion lithography
Since immersion lithography was first proposed by Burn-Jeng Lin in the 1970s, ASML cooperated with TSMC. In 2004, TSMC began commercial production of 90 nanometer semiconductor nodes using ASML immersion lithography. By 2011, their high-end TWINSCAN NXT:1950i system was used for producing features down to 32 nanometres at up to 200 wafers per hour, using a water immersion lens and an argon fluoride laser that produces light at a wavelength of 193 nm. By 2011, an average lithography machine cost €27 million.
DUV lithography
Deep ultraviolet lithography (DUV) devices from ASML use ultraviolet light to print the tiny features that form the microchip's structure.
EUV lithography
Extreme ultraviolet lithography (EUV) is a critical technology used to create the smallest and most complex chip designs. ASML holds a near-monopoly in the EUV market. The company's machines are capable of exposing patterns as small as 8 nanometers wide, about 1/10,000 the width of a human hair.
EUV machines produce light in the 13.5 nm wavelength range by focusing a high-energy laser on microscopic droplets of molten tin to produce a plasma, which then emits EUV light. The light is bounced off Zeiss mirrors onto the surface of a silicon wafer to form the designs for the chip.
In 2009, the IMEC research center in Belgium produced the world's first functional 22 nm CMOS Static random-access memory memory cells with a prototype EUV lithography machine. ASML shipped the first pre-production EUV machine in 2013 and, after two decades of development, started shipping production EUV machines in 2018. Samsung shipped the first EUV-enabled commercial product in 2019.
As of 2022, ASML has shipped around 140 EUV systems. ASML's best-selling EUV product has been the TWINSCAN NXE:3600D, which costs up to $200 million. The machine weighs 180 tons and needs three Boeing 747s to transport.
ASML is working on the next generation of EUV systems, with the first shipments for R&D shipped to Intel in December 2023, and TSMC in late 2024. The platform is designated High-NA as it increases the numerical aperture (NA) from 0.33 to 0.55. each system costs approximately $370 million.
Sponsorships
ASML became a sponsor of the PSV football club in 2019 together with Philips, VDL Groep, Royal Swinkels Family Brewers and Jumbo Supermarkets from the Brainport region. Together they run various initiatives like soccer training camps for school children, the development of interactive programs for teaching, assisting community members in need or who are new to the region, as well as supporting a vitality program that is online. ASML was the title partner of the Eindhoven marathon from 2022 - 2024.
Awards
The IEEE Spectrum Emerging Technology 2018 Award was given to ASML for its Extreme Ultraviolet Lithography system. ASML is currently the top supplier of photolithography systems to the semiconductor industry.
In the category for Popular Prize, Vadim Banine received the 2018 European Inventor Award for shaping the future of microchip manufacturing.
The largest independent microelectronics research center in Europe is called IMEC (Interuniversity Micro Electronics Centre). Martin van den Brink of ASML was given the 2019 IMEC Lifetime of Innovation Award.
The Netherlands Association for Investor Relations (NEVIR), where listed companies and professionals in investor relations had the chance to be recognized for their outstanding work in the sector, presented awards to ASML in the categories: "Best Company in the field of Investor Relations" during the Dutch IR Awards 2019 annual award ceremony.
ASML received the SEMI Americas Award at the 2020 edition of the microelectronics conference SEMICON West for its collaborative approach to extreme ultraviolet lithography (EUV), which helped it become commercially viable and opened the door to new technological possibilities.
The Intel Preferred Quality Supplier (PQS) Award for 2020 was awarded to ASML. ASML has attained a level of performance that continuously surpasses Intel's expectations for the commitment to continual quality improvement.
The Dutch Innovation Prize 2021 was awarded to ASML at the 4th National BID AVROTROS Innovation Dinner held at Kasteel Wittenburg in Wassenaar.
ASML received the first CoSta Award for the most successful and impactful innovative partnership between a corporate company and a startup.
स्रोत: विकिपीडिया (अंग्रेज़ी), CC BY-SA 4.0 · विकिपीडिया पर देखें ↗
10-वर्षीय प्रदर्शन राजस्व, शुद्ध आय, मार्जिन और ईपीएस रुझान
मूल्यांकन P/E, P/S, P/B, EV/EBITDA अनुपात — क्या स्टॉक महंगा है या सस्ता?
| मेट्रिक | 5Y रुझान | ASML | 5Y औसत | सहकर्मी माध्यिका | निर्णय |
|---|---|---|---|---|---|
| P/E | 74.25Y औसत ≈42.3 | ≈42.3 | · | · | |
| P/S | 21.65Y औसत ≈12.1 | ≈12.1 | · | · | |
| P/B | 36.05Y औसत ≈22.8 | ≈22.8 | · | · | |
| EV / EBITDA | 56.75Y औसत ≈32.7 | ≈32.7 | · | · | |
| Price / FCF (मूल्य / FCF) | 63.85Y औसत ≈44.0 | ≈44.0 | · | · | |
| Price / Cash Flow (मूल्य / नकदी प्रवाह) | 55.85Y औसत ≈33.3 | ≈33.3 | · | · | |
| EV / Revenue (EV / राजस्व) | 21.45Y औसत ≈11.9 | ≈11.9 | · | · | |
| EV / FCF | 63.05Y औसत ≈43.4 | ≈43.4 | · | · | |
| Price / Tangible Book (मूल्य / मूर्त पुस्तक) | 48.65Y औसत ≈43.6 | ≈43.6 | · | · |
सहकर्मी माध्यिका को प्रति मीट्रिक मानकीकृत आधार पर गणना की जाती है और यह हमेशा इस स्टॉक के लिए दिखाए गए TTM/MRQ आधार से मेल नहीं खा सकती है।
लाभप्रदता सकल, परिचालन और शुद्ध मार्जिन; ROE, ROA, ROIC
| मेट्रिक | 5Y रुझान | ASML | 5Y औसत | सहकर्मी माध्यिका | निर्णय |
|---|---|---|---|---|---|
| Gross Margin (सकल मार्जिन) | 52.8%5Y औसत ≈51.7% | ≈51.7% | · | · | |
| Operating Margin (परिचालन मार्जिन) | 34.6%5Y औसत ≈33.3% | ≈33.3% | · | · | |
| EBITDA Margin (EBITDA मार्जिन) | 37.7%5Y औसत ≈36.1% | ≈36.1% | · | · | |
| Pretax Margin (प्रीटैक्स मार्जिन) | 34.9%5Y औसत ≈33.3% | ≈33.3% | · | · | |
| Net Profit Margin (शुद्ध लाभ मार्जिन) | 29.4%5Y औसत ≈28.6% | ≈28.6% | · | · | |
| ROA | 19.4%5Y औसत ≈18.9% | ≈18.9% | · | · | |
| ROE | 50.5%5Y औसत ≈55.3% | ≈55.3% | · | · | |
| ROIC | 38.8%5Y औसत ≈38.7% | ≈38.7% | · | · |
वित्तीय स्वास्थ्य ऋण, तरलता, शोधन क्षमता — बैलेंस शीट की मजबूती
| मेट्रिक | 5Y रुझान | ASML | 5Y औसत | सहकर्मी माध्यिका | निर्णय |
|---|---|---|---|---|---|
| Debt / Equity (ऋण / इक्विटी) | 0.25Y औसत ≈0.4 | ≈0.4 | · | · | |
| Current Ratio (वर्तमान अनुपात) | 1.35Y औसत ≈1.4 | ≈1.4 | · | · | |
| Quick Ratio (त्वरित अनुपात) | 0.75Y औसत ≈0.7 | ≈0.7 | · | · | |
| Long-Term Debt / Equity (दीर्घकालिक ऋण / इक्विटी) | 0.15Y औसत ≈0.3 | ≈0.3 | · | · |
विकास राजस्व, EPS और शुद्ध आय वृद्धि: YoY, 3Y CAGR, 5Y CAGR
इस टिकर के लिए अभी तक कोई फंडामेंटल डेटा नहीं है।
पूंजी दक्षता एसेट टर्नओवर, इन्वेंटरी टर्नओवर, प्राप्य टर्नओवर
| मेट्रिक | 5Y रुझान | ASML | 5Y औसत | सहकर्मी माध्यिका | निर्णय |
|---|---|---|---|---|---|
| Asset Turnover (परिसंपत्ति टर्नओवर) | 0.75Y औसत ≈0.7 | ≈0.7 | · | · | |
| Inventory Turnover (इन्वेंटरी टर्नओवर) | 1.45Y औसत ≈1.6 | ≈1.6 | · | · | |
| Receivables Turnover (प्राप्य टर्नओवर) | 8.75Y औसत ≈6.9 | ≈6.9 | · | · | |
| Revenue / Employee (राजस्व / कर्मचारी (रिपोर्ट की गई हेडकाउंट, यफाइनांस)। व्युत्पन्न — संग्रहीत SEC-XBRL अवधारणा नहीं है।) | ≈$743.5K | · | · | · |
मान · ≈ 5Y औसत · उद्योग माध्य · माध्य के सापेक्ष निर्णय
लाभांश यील्ड, भुगतान अनुपात, लाभांश इतिहास, 5Y CAGR
| एक्स-डेट | राशि | मुद्रा | यील्ड |
|---|---|---|---|
| जुल 28, 2026 | $2.14 | USD | ≈0.57% |
| अप्र 27, 2026 | $3.18 | USD | ≈0.61% |
| फ़र 10, 2026 | $1.88 | USD | ≈0.54% |
| अक्ट 29, 2025 | $1.86 | USD | ≈0.69% |
| जुल 29, 2025 | $1.85 | USD | ≈1.00% |
| अप्र 28, 2025 | $2.09 | USD | ≈1.0% |
| फ़र 11, 2025 | $1.57 | USD | ≈0.89% |
| अक्ट 29, 2024 | $1.64 | USD | ≈0.94% |
| जुल 29, 2024 | $1.64 | USD | ≈0.76% |
| अप्र 26, 2024 | $1.87 | USD | ≈0.71% |
| फ़र 5, 2024 | $1.56 | USD | ≈0.73% |
| नव 1, 2023 | $1.53 | USD | ≈1.1% |
| अग 1, 2023 | $1.59 | USD | ≈0.88% |
| मई 1, 2023 | $1.86 | USD | ≈1.6% |
| फ़र 6, 2023 | $1.47 | USD | ≈1.2% |
| नव 3, 2022 | $1.34 | USD | ≈1.5% |
| अग 4, 2022 | $1.40 | USD | ≈1.3% |
| मई 3, 2022 | $3.90 | USD | ≈1.0% |
| नव 2, 2021 | $2.08 | USD | ≈0.49% |
| मई 3, 2021 | $1.87 | USD | ≈0.50% |
Earnings History EPS वास्तविक बनाम अनुमान, आश्चर्य %, बीट दर, अगली आय तिथि
| Period | रिपोर्ट | EPS Actual | EPS अनुमान | आश्चर्य |
|---|---|---|---|---|
| 30 जून 2026 | $7.58 | $6.93 | 9.4% | |
| 31 मार्च 2026 | $7.15 | $6.67 | 7.1% | |
| 31 दिसमबर 2025 | $7.34 | $7.71 | -4.8% | |
| 30 सितमबर 2025 | $5.48 | $5.56 | -1.4% | |
| 30 जून 2025 | $5.90 | $5.30 | 11.2% | |
| 31 मार्च 2025 | $7.34 | $7.71 | -4.8% |
पूर्ण मौलिक सभी मेट्रिक्स प्रति वर्ष — आय विवरण, बैलेंस शीट, नकदी प्रवाह
आय विवरण
| मेट्रिक | रुझान | 2025 | 2024 | 2023 | 2022 | 2021 | 2020 | 2019 | 2018 | 2017 | 2016 | 2015 | 2014 |
|---|---|---|---|---|---|---|---|---|---|---|---|---|---|
| Revenue | $32.67B | $28.26B | $27.56B | $21.17B | $18.61B | $13.98B | $11.82B | $10.94B | $8.96B | $6.88B | $6.29B | $5.86B | |
| Cost of Revenue | $15.41B | $13.77B | $13.42B | $10.47B | $8.80B | $7.18B | $6.54B | $5.91B | $4.94B | $3.73B | $3.39B | $3.26B | |
| Gross Profit | $17.26B | $14.49B | $14.14B | $10.70B | $9.81B | $6.80B | $5.28B | $5.03B | $4.02B | $3.15B | $2.90B | $2.60B | |
| R&D Expense | $4.70B | $4.30B | $3.98B | $3.25B | $2.55B | $2.20B | $1.97B | $1.58B | $1.26B | · | · | $1.07B | |
| SG&A Expense | $1.26B | $1.17B | $1.11B | $946M | $726M | $545M | $520M | $488M | $417M | $375M | $346M | $321M | |
| Operating Income | $11.30B | $9.02B | $9.04B | $6.50B | $6.75B | $4.05B | $2.79B | $2.97B | $2.44B | $1.76B | $1.57B | $1.28B | |
| Interest Expense | · | · | $153M | $61M | $55M | $43M | $37M | $42M | $58M | $38M | $27M | $23M | |
| Interest Income | $223M | $182M | $194M | $16M | $10M | · | · | · | · | · | · | · | |
| Pretax Income | $11.41B | $9.04B | $9.08B | $6.46B | $6.71B | $4.02B | $2.77B | $2.94B | $2.39B | $1.79B | $1.55B | $1.27B | |
| Income Tax | $2.01B | $1.68B | $1.44B | $970M | $1.02B | $552M | $192M | $352M | $306M | $234M | $161M | $77M | |
| Net Income | $9.61B | $7.57B | $7.84B | $5.62B | $5.88B | $3.55B | $2.59B | $2.59B | $2.07B | $1.56B | $1.39B | $1.20B | |
| EPS (Basic) | $24.73 | $19.25 | $19.91 | $14.14 | $14.36 | $8.49 | $6.16 | $6.10 | $4.81 | $3.66 | $3.22 | $2.74 | |
| EPS (Diluted) | $24.71 | $19.24 | $19.89 | $14.13 | $14.34 | $8.48 | $6.15 | $6.08 | $4.79 | $3.64 | $3.21 | $2.72 | |
| Shares (Basic) | 388,500,000 | 393,300,000 | 393,800,000 | 397,700,000 | 409,800,000 | 418,300,000 | 420,800,000 | 424,900,000 | 429,800,000 | 425,600,000 | 430,600,000 | 437,142,000 | |
| Shares (Diluted) | 388,900,000 | 393,600,000 | 394,100,000 | 398,000,000 | 410,400,000 | 419,100,000 | 421,600,000 | 426,400,000 | 431,600,000 | 427,700,000 | 432,600,000 | 439,693,000 | |
| EBITDA | $12.33B | $9.94B | $9.78B | $7.08B | $7.22B | $4.54B | $3.24B | $3.39B | $2.91B | $2.01B | $1.86B | $1.54B |
बैलेंस शीट
| मेट्रिक | रुझान | 2025 | 2024 | 2023 | 2022 | 2021 | 2020 | 2019 | 2018 | 2017 | 2016 | 2015 | 2014 |
|---|---|---|---|---|---|---|---|---|---|---|---|---|---|
| Cash & Equivalents | $12.92B | $12.74B | $7.00B | $7.27B | $6.95B | $6.05B | $3.53B | $3.12B | $2.26B | $2.91B | $2.46B | $2.42B | |
| Short-term Investments | · | · | · | · | · | $1.30B | $1.19B | $913M | $1.03B | $1.15B | $950M | $335M | |
| Receivables | $3.02B | $4.48B | $4.33B | $5.32B | $3.03B | $1.31B | $1.79B | $1.50B | $1.74B | $700M | $804M | $1.05B | |
| Inventory | $11.43B | $10.89B | $8.85B | $7.20B | $5.18B | $4.57B | $3.81B | $3.44B | $2.96B | $2.78B | $2.57B | $2.55B | |
| Prepaid Expense | $1.43B | $1.94B | $1.58B | $1.64B | $1.00B | $802M | $843M | $773M | $510M | $560M | $489M | $390M | |
| Other Current Assets | $350M | $193M | $92M | $266M | $149M | $93M | $131M | $84M | $78M | $89M | $34M | $39M | |
| Current Assets | $30.62B | $30.74B | $24.39B | $23.06B | $18.19B | $15.93B | $12.13B | $10.53B | $8.89B | $8.56B | $7.71B | $7.15B | |
| PP&E (Net) | $7.89B | $6.85B | $5.49B | $3.94B | $2.98B | $2.47B | $2.00B | $1.59B | $1.60B | $1.69B | $1.62B | $1.45B | |
| PP&E (Gross) | $12.82B | $11.06B | $9.08B | $6.99B | $5.62B | $5.02B | $4.30B | $3.71B | $3.43B | $3.30B | $3.01B | $2.60B | |
| Goodwill | $4.59B | $4.59B | $4.59B | $4.56B | $4.56B | $4.63B | $4.54B | $4.54B | $4.54B | $4.87B | $2.62B | $2.36B | |
| Intangibles | $486M | $621M | $742M | $842M | $952M | $1.05B | $1.10B | $1.10B | $1.17B | $1.32B | $738M | $724M | |
| Other Non-current Assets | $13M | $28M | $14M | $16M | $15M | $15M | $19M | $19M | $24M | $22M | $20M | $5M | |
| Total Assets | $50.57B | $48.59B | $39.96B | $36.30B | $30.23B | $27.27B | $22.63B | $20.14B | $18.19B | $17.21B | $13.30B | $12.20B | |
| Accounts Payable | $3.52B | $3.50B | $2.35B | $2.57B | $2.12B | $1.38B | $1.06B | $964M | $837M | $593M | $528M | $496M | |
| Current Liabilities | $24.26B | $20.05B | $16.27B | $17.98B | $12.30B | $6.60B | $4.69B | $3.79B | $3.17B | $3.28B | $3.11B | $2.89B | |
| Capital Leases | · | · | · | · | $118M | $130M | $154M | $94M | $81M | · | · | · | |
| Deferred Tax | · | · | · | · | · | · | · | $42M | $192M | $278M | $160M | $154M | |
| Other Non-current Liabilities | $432M | $460M | $401M | $455M | $251M | $258M | $241M | $202M | $279M | $616M | $414M | $412M | |
| Total Liabilities | $30.95B | $30.11B | $26.51B | $27.49B | $20.09B | $13.40B | $10.04B | $8.50B | $7.41B | $7.39B | $4.91B | $4.69B | |
| Long-term Debt | $4.39B | $4.69B | $4.63B | $4.26B | $4.58B | $4.68B | $3.11B | $3.01B | $3.04B | $3.28B | $1.03B | $1.04B | |
| Total Debt | $4.39B | $4.69B | $4.63B | $4.26B | $4.58B | $4.68B | $3.11B | $3.01B | $3.01B | $3.04B | $1.03B | $1.04B | |
| Common Stock | · | · | · | · | · | · | $39M | $39M | $39M | · | · | · | |
| Retained Earnings | $17.59B | $14.41B | $12.38B | $9.05B | $8.32B | $10.73B | $9.52B | $9.20B | $7.31B | $6.28B | $5.28B | $4.65B | |
| Treasury Stock | $2.25B | $476M | $3.31B | $4.64B | $2.42B | $863M | $1.02B | $1.62B | $558M | $796M | $477M | $389M | |
| AOCI | $136M | $454M | $345M | $428M | $334M | $179M | $278M | $285M | $252M | $601M | $472M | $212M | |
| Stockholders' Equity | $19.61B | $18.48B | $13.45B | $8.81B | $10.14B | $13.87B | $12.59B | $11.64B | $10.69B | $9.97B | $8.45B | $7.51B | |
| Liabilities + Equity | $50.57B | $48.59B | $39.96B | $36.30B | $30.23B | $27.27B | $22.63B | $20.14B | $18.19B | $17.21B | $13.30B | $12.20B | |
| Shares Outstanding | 385,417,665 | 393,283,720 | 393,421,721 | 394,600,000 | 402,600,000 | 416,500,000 | 419,800,000 | 421,100,000 | 427,400,000 | 429,900,000 | 428,000,000 | 432,900,000 |
नकदी प्रवाह
| मेट्रिक | रुझान | 2025 | 2024 | 2023 | 2022 | 2021 | 2020 | 2019 | 2018 | 2017 | 2016 | 2015 | 2014 |
|---|---|---|---|---|---|---|---|---|---|---|---|---|---|
| D&A | $1.03B | $919M | $740M | $584M | $471M | $491M | $448M | $423M | $418M | $357M | $297M | $255M | |
| Stock-based Comp | $202M | $173M | $135M | $69M | $118M | $54M | $75M | $46M | $53M | $48M | $59M | $63M | |
| Deferred Tax | $16M | $-66M | $-217M | $-527M | $-367M | $-232M | $-232M | $-292M | $-78M | $76M | $45M | $-59M | |
| Amort. of Intangibles | $124M | $126M | $128M | $135M | $133M | $124M | $115M | $104M | $106M | $64M | $51M | $44M | |
| Other Non-cash | $1.80B | $2.57B | $-3.05B | $2.74B | $4.74B | $761M | $393M | $247M | $-734M | $-210M | $237M | $-430M | |
| Operating Cash Flow | $12.66B | $11.17B | $5.44B | $8.49B | $10.85B | $4.63B | $3.28B | $3.07B | $1.82B | $1.67B | $2.03B | $1.03B | |
| CapEx | $1.57B | $2.07B | $2.16B | $1.28B | $901M | $962M | $767M | $574M | $339M | $316M | $372M | $358M | |
| Investing Cash Flow | $-3.78B | $-2.61B | $-2.69B | $-1.03B | $-72M | $-1.35B | $-1.16B | $-492M | $-1.23B | · | · | · | |
| Debt Issued | · | $22M | $998M | $496M | $0 | $1.49B | $0 | $0 | · | · | · | · | |
| Net Debt Issued | · | $22M | $245M | $-21M | $-12M | $1.48B | $-4M | $-3M | $-243M | $-5M | $-4M | $-4M | |
| Stock Repurchased | $5.95B | $500M | $1.00B | $4.64B | $8.56B | $1.21B | $410M | $1.15B | $500M | $400M | $565M | $700M | |
| Net Stock Activity | $-5.95B | $-500M | $-1.00B | $-4.64B | $-8.56B | $-1.21B | $-410M | $-1.15B | $-500M | $-400M | $-565M | $-700M | |
| Dividends Paid | · | · | · | · | · | · | · | $597M | $517M | $446M | $302M | $268M | |
| Financing Cash Flow | $-8.67B | $-2.83B | $-3.00B | $-7.14B | $-9.89B | $-753M | $-1.71B | $-1.72B | $-1.21B | · | · | · | |
| Net Change in Cash | $180M | $5.73B | $-264M | $316M | $902M | $2.52B | $411M | $862M | $-648M | $448M | $39M | $89M | |
| Taxes Paid | $1.62B | $1.10B | $2.57B | $1.73B | $1.24B | $650M | $679M | $554M | $475M | $116M | $127M | $124M | |
| Free Cash Flow | $11.08B | $9.10B | $3.29B | $7.21B | $9.95B | $3.67B | $2.51B | $2.50B | $1.46B | $1.35B | $1.65B | $667M | |
| Levered FCF | · | · | $3.16B | $7.15B | $9.90B | $3.63B | $2.48B | $2.46B | $1.41B | $1.32B | $1.63B | $645M |
लाभप्रदता
| मेट्रिक | रुझान | 2025 | 2024 | 2023 | 2022 | 2021 | 2020 | 2019 | 2018 | 2017 | 2016 | 2015 | 2014 |
|---|---|---|---|---|---|---|---|---|---|---|---|---|---|
| Gross Margin | 52.8% | 51.3% | 51.3% | 50.5% | 52.7% | 48.6% | 44.7% | 46.0% | 45.0% | 44.8% | 46.1% | 44.3% | |
| Operating Margin | 34.6% | 31.9% | 32.8% | 30.7% | 36.3% | 29.0% | 23.6% | 27.1% | 27.6% | 24.4% | 24.9% | 21.9% | |
| Net Margin | 29.4% | 26.8% | 28.4% | 26.6% | 31.6% | 25.4% | 21.9% | 23.7% | 23.4% | 21.7% | 22.1% | 20.4% | |
| Pretax Margin | 34.9% | 32.0% | 33.0% | 30.5% | 36.0% | 28.7% | 23.4% | 26.8% | 27.0% | 24.9% | 24.6% | 21.8% | |
| EBITDA Margin | 37.7% | 35.2% | 35.5% | 33.5% | 38.8% | 32.5% | 27.4% | 31.0% | 32.2% | 29.6% | 29.6% | 26.2% | |
| ROA | 19.4% | 17.1% | 20.6% | 16.9% | 20.5% | 14.2% | 12.1% | 13.5% | 12.0% | 9.7% | 10.9% | 10.1% | |
| ROE | 50.5% | 47.4% | 70.4% | 59.4% | 49.0% | 26.9% | 21.4% | 23.2% | 20.5% | 16.1% | 17.4% | 16.6% | |
| ROIC | 38.8% | 31.7% | 42.1% | 42.3% | 38.9% | 18.9% | 16.5% | 17.8% | 15.9% | 11.2% | 14.9% | 14.1% |
तरलता और शोधन क्षमता
| मेट्रिक | रुझान | 2025 | 2024 | 2023 | 2022 | 2021 | 2020 | 2019 | 2018 | 2017 | 2016 | 2015 | 2014 |
|---|---|---|---|---|---|---|---|---|---|---|---|---|---|
| Current Ratio | 1.3 | 1.5 | 1.5 | 1.3 | 1.5 | 2.4 | 2.6 | 2.8 | 2.7 | 2.6 | 2.5 | 2.5 | |
| Quick Ratio | 0.7 | 0.9 | 0.7 | 0.7 | 0.8 | 0.4 | 0.6 | 1.5 | 1.5 | 1.5 | 1.4 | 1.3 | |
| Debt / Equity | 0.2 | 0.3 | 0.3 | 0.5 | 0.5 | 0.3 | 0.2 | 0.3 | 0.3 | 0.3 | 0.1 | 0.1 | |
| LT Debt / Equity | 0.1 | 0.2 | 0.3 | 0.4 | 0.4 | 0.3 | 0.2 | 0.3 | 0.3 | 0.3 | 0.1 | 0.1 | |
| Interest Coverage | · | · | 59.2 | 106.9 | 123.6 | 93.6 | 76.3 | 70.9 | 43.4 | 43.6 | 57.1 | 55.5 |
दक्षता
| मेट्रिक | रुझान | 2025 | 2024 | 2023 | 2022 | 2021 | 2020 | 2019 | 2018 | 2017 | 2016 | 2015 | 2014 |
|---|---|---|---|---|---|---|---|---|---|---|---|---|---|
| Asset Turnover | 0.7 | 0.6 | 0.7 | 0.6 | 0.6 | 0.6 | 0.6 | 0.6 | 0.5 | 0.4 | 0.5 | 0.5 | |
| Inventory Turnover | 1.4 | 1.4 | 1.7 | 1.7 | 1.8 | 1.7 | 1.8 | 1.8 | 1.7 | 1.4 | 1.3 | 1.3 | |
| Receivables Turnover | 8.7 | 6.4 | 5.7 | 5.1 | 8.6 | 9.0 | 7.2 | 6.8 | 7.3 | 9.0 | 6.8 | 6.1 |
प्रति शेयर
| मेट्रिक | रुझान | 2025 | 2024 | 2023 | 2022 | 2021 | 2020 | 2019 | 2018 | 2017 | 2016 | 2015 | 2014 |
|---|---|---|---|---|---|---|---|---|---|---|---|---|---|
| Book Value / Share | $50.89 | $46.98 | $34.19 | $22.33 | $25.19 | $33.29 | $30.00 | $27.64 | $24.98 | $22.84 | $19.60 | $17.35 | |
| Revenue / Share | $84.00 | $71.81 | $69.93 | $53.20 | $45.35 | $33.35 | $28.04 | $25.67 | $20.98 | $15.89 | $14.53 | $13.32 | |
| Cash Flow / Share | $32.55 | $28.37 | $13.81 | $21.32 | $26.43 | $11.04 | $7.77 | $7.21 | $4.17 | $3.90 | $4.68 | $2.33 | |
| Cash / Share | $33.51 | $32.38 | $17.80 | $18.42 | $17.27 | · | · | $7.41 | $5.29 | $6.76 | $5.74 | $5.59 | |
| Dividend / Share | · | $6.40 | $6.10 | $5.80 | $5.50 | $2.75 | · | · | · | · | · | · | |
| EPS (TTM) | $24.71 | $19.24 | $19.89 | $14.13 | $14.34 | $8.48 | $6.15 | $6.08 | $4.79 | $3.64 | $3.21 | $2.72 |
मूल्यांकन (TTM)
| मेट्रिक | रुझान | 2025 | 2024 | 2023 | 2022 | 2021 | 2020 | 2019 | 2018 | 2017 | 2016 | 2015 | 2014 |
|---|---|---|---|---|---|---|---|---|---|---|---|---|---|
| Revenue TTM | $32.67B | $28.26B | $27.56B | $21.17B | $18.61B | $13.98B | $11.82B | $10.94B | $8.96B | $6.88B | $6.29B | $5.86B | |
| Net Income TTM | $9.61B | $7.57B | $7.84B | $5.62B | $5.88B | $3.55B | $2.59B | $2.59B | $2.07B | $1.56B | $1.39B | $1.20B | |
| Market Cap | $412.34B | $272.58B | $297.79B | $215.60B | $320.53B | $203.14B | $124.24B | $65.53B | $74.29B | $48.24B | $37.99B | $46.68B | |
| Enterprise Value | $403.82B | $264.53B | $295.42B | $212.60B | $318.16B | · | · | $64.50B | $74.01B | $47.22B | $35.61B | $44.97B | |
| P/E | 43.3 | 36.0 | 38.1 | 38.7 | 55.5 | 57.5 | 48.1 | 25.6 | 36.3 | 30.8 | 27.7 | 39.6 | |
| P/S | 12.6 | 9.6 | 10.8 | 10.2 | 17.2 | 14.5 | 10.5 | 6.0 | 8.3 | 7.0 | 6.0 | 8.0 | |
| P/B | 21.0 | 14.8 | 22.1 | 24.5 | 31.6 | 14.7 | 9.9 | 5.6 | 7.0 | 4.9 | 4.5 | 6.2 | |
| P / Tangible Book | 28.4 | 20.5 | 36.7 | 63.2 | 69.2 | 24.8 | · | · | · | · | · | · | |
| P / Cash Flow | 32.6 | 24.4 | 54.7 | 25.4 | 29.6 | 43.9 | 37.9 | 21.3 | 41.3 | 29.0 | 18.8 | 45.5 | |
| P / FCF | 37.2 | 30.0 | 90.6 | 29.9 | 32.2 | 55.4 | 49.5 | 26.2 | 50.9 | 35.7 | 23.0 | 70.0 | |
| EV / EBITDA | 32.8 | 26.6 | 30.2 | 30.0 | 44.1 | · | · | 19.0 | 25.4 | 23.4 | 19.1 | 29.3 | |
| EV / FCF | 36.4 | 29.1 | 89.9 | 29.5 | 32.0 | · | · | 25.8 | 50.7 | 35.0 | 21.5 | 67.4 | |
| EV / Revenue | 12.4 | 9.4 | 10.7 | 10.0 | 17.1 | · | · | 5.9 | 8.3 | 6.9 | 5.7 | 7.7 | |
| Dividend Yield | · | · | · | · | · | · | · | 0.91% | 0.70% | 0.92% | 0.80% | 0.57% | |
| Earnings Yield | 2.3% | 2.8% | 2.6% | 2.6% | 1.8% | 1.7% | 2.1% | 3.9% | 2.8% | 3.2% | 3.6% | 2.5% | |
| Payout Ratio | · | · | · | · | · | · | · | 23.0% | 24.4% | 30.3% | 21.8% | 22.4% | |
| Annual Payout | · | · | · | · | · | · | · | $597M | $517M | $446M | $302M | $268M |
प्रति शेयर
| मेट्रिक | रुझान | Q4 2010 | Q4 2009 | Q4 2008 | Q4 2007 | Q4 2006 | Q4 2005 | Q4 2004 | Q4 2003 | Q4 2002 | Q4 2001 |
|---|---|---|---|---|---|---|---|---|---|---|---|
| EPS (TTM) | $2.33 | $-0.35 | $0.74 | $1.41 | · | · | · | · | · | · |
मूल्यांकन (TTM)
| मेट्रिक | रुझान | Q4 2010 | Q4 2009 | Q4 2008 | Q4 2007 | Q4 2006 | Q4 2005 | Q4 2004 | Q4 2003 | Q4 2002 | Q4 2001 |
|---|---|---|---|---|---|---|---|---|---|---|---|
| Revenue TTM | $4.51B | $1.60B | $2.95B | $3.77B | · | · | · | · | · | · | |
| Net Income TTM | $1.02B | $-151M | $322M | $671M | · | · | · | · | · | · | |
| P/E | 21.4 | -126.5 | 31.7 | 28.8 | · | · | · | · | · | · | |
| Earnings Yield | 4.7% | -0.79% | 3.1% | 3.5% | · | · | · | · | · | · | |
| Annual Payout | $87M | $86M | $108M | $0 | · | · | · | · | · | · |
सबसे हाल की अवधि बाईं ओर · शून्य मान इस प्रकार दिखाए गए हैं ·
वित्तीय विवरण आय विवरण, बैलेंस शीट, नकदी प्रवाह — वार्षिक, पिछले 5 वर्ष
| मेट्रिक | 2025-12-31 | 2024-12-31 | 2023-12-31 | 2022-12-31 | 2021-12-31 |
|---|---|---|---|---|---|
| राजस्व | $32.67B | $28.26B | $27.56B | $21.17B | $18.61B |
| सकल मार्जिन % | 52.8% | 51.3% | 51.3% | 50.5% | 52.7% |
| परिचालन मार्जिन % | 34.6% | 31.9% | 32.8% | 30.7% | 36.3% |
| शुद्ध आय | $9.61B | $7.57B | $7.84B | $5.62B | $5.88B |
| तनुकरणित EPS | $24.71 | $19.24 | $19.89 | $14.13 | $14.34 |
| मेट्रिक | 2025-12-31 | 2024-12-31 | 2023-12-31 | 2022-12-31 | 2021-12-31 |
|---|---|---|---|---|---|
| ऋण / इक्विटी | 0.2 | 0.3 | 0.3 | 0.5 | 0.5 |
| वर्तमान अनुपात | 1.3 | 1.5 | 1.5 | 1.3 | 1.5 |
| त्वरित अनुपात | 0.7 | 0.9 | 0.7 | 0.7 | 0.8 |
| मेट्रिक | 2025-12-31 | 2024-12-31 | 2023-12-31 | 2022-12-31 | 2021-12-31 |
|---|---|---|---|---|---|
| फ्री कैश फ्लो | $11.08B | $9.10B | $3.29B | $7.21B | $9.95B |
संस्थागत मालिक (13F) 2694 फाइलर्स · $164.0B कुल · तिथि अनुसार 30 सितमबर 2026
संस्थान जो अपनी तिमाही SEC फॉर्म 13F में इस स्टॉक को होल्ड करने की रिपोर्ट करते हैं। केवल लॉन्ग पोजीशन; एक ही फाइलर अलग-अलग ऑप्शन लेग्स के लिए दो बार दिखाई दे सकता है। बड़े ऑफसेटिंग पुट/कॉल लेग्स आमतौर पर मार्केट-मेकिंग या हेज्ड इन्वेंट्री को दर्शाते हैं, न कि दिशात्मक विश्वास को।
| नई स्थितियाँ | बाहर निकली पोजीशन | बढ़ाया | घटा हुआ | शुद्ध शेयर परिवर्तन |
|---|---|---|---|---|
| 435 (+68 पिछली तिमाही की तुलना में) | 93 (-7 पिछली तिमाही की तुलना में) | 933 (+129 पिछली तिमाही की तुलना में) | 811 (+23 पिछली तिमाही की तुलना में) | +3.6M |
Q1 2026 की तुलना में। SEC फॉर्म 13F फाइलिंग तिमाही के अंत के 45 दिनों के भीतर देय होती है, साथ ही देर से फाइल करने वालों के लिए एक छोटा बफर भी होता है — उस विंडो के भीतर आने वाली तिमाहियों को सबसे हालिया पूरी तरह से रिपोर्ट की गई जोड़ी के पक्ष में छोड़ दिया जाता है।
| संस्था | मूल्य | शेयर | % ट्रैक किए गए 13F का | प्रकार |
|---|---|---|---|---|
| FMR LLC | $10898828806 | 5478341 | 6.65% | शेयर |
| Fisher Asset Management, LLC | $9425199953 | 4737614 | 5.75% | शेयर |
| Capital World Investors | $7408061436 | 3726679 | 4.52% | शेयर |
| Invesco Ltd. | $6247254210 | 3140208 | 3.81% | शेयर |
| STATE FARM MUTUAL AUTOMOBILE INSURANCE CO | $5487219693 | 2758173 | 3.35% | शेयर |
| VAN ECK ASSOCIATES CORP | $4892868525 | 2459420 | 2.98% | शेयर |
| Capital International Investors | $4804665620 | 2439219 | 2.93% | शेयर |
| JPMORGAN CHASE & CO | $4511671022 | 2395859 | 2.75% | शेयर |
| SUSQUEHANNA INTERNATIONAL GROUP, LLP | $3654402336 | 1836900 | 2.23% | पुट ऑप्शन |
| MORGAN STANLEY | $3557702292 | 1788291 | 2.17% | शेयर |
| BANK OF AMERICA CORP /DE/ | $3306830984 | 1662192 | 2.02% | शेयर |
| SUSQUEHANNA INTERNATIONAL GROUP, LLP | $3141524704 | 1579100 | 1.92% | कॉल ऑप्शन |
| ARROWSTREET CAPITAL, LIMITED PARTNERSHIP | $2912352596 | 1463906 | 1.78% | शेयर |
| CITADEL ADVISORS LLC | $2858029504 | 1436600 | 1.74% | पुट ऑप्शन |
| WCM INVESTMENT MANAGEMENT, LLC | $2728632941 | 1449003 | 1.66% | शेयर |
| BlackRock, Inc. | $2550839967 | 1282190 | 1.56% | शेयर |
| JANE STREET GROUP, LLC | $2223398144 | 1117600 | 1.36% | पुट ऑप्शन |
| DIMENSIONAL FUND ADVISORS LP | $2181016069 | 1096493 | 1.33% | शेयर |
| CITADEL ADVISORS LLC | $1897129984 | 953600 | 1.16% | कॉल ऑप्शन |
| WELLINGTON MANAGEMENT GROUP LLP | $1847270638 | 928538 | 1.13% | शेयर |
| Clearbridge Investments, LLC | $1781404688 | 895430 | 1.09% | शेयर |
| GOLDMAN SACHS GROUP INC | $1672998070 | 840939 | 1.02% | शेयर |
| FRANKLIN RESOURCES INC | $1595180440 | 801824 | 0.97% | शेयर |
| NEUBERGER BERMAN GROUP LLC | $1499936208 | 754422 | 0.91% | शेयर |
| NORTHERN TRUST CORP | $1459321881 | 733534 | 0.89% | शेयर |
| WELLS FARGO & COMPANY/MN | $1430376710 | 718985 | 0.87% | शेयर |
| FIRST MANHATTAN CO. LLC. | $1429229612 | 718408 | 0.87% | शेयर |
| ROYAL BANK OF CANADA | $1425726000 | 716647 | 0.87% | शेयर |
| UBS Group AG | $1241136018 | 623862 | 0.76% | शेयर |
| Fayez Sarofim & Co | $1166541622 | 586367 | 0.71% | शेयर |
| LONE PINE CAPITAL LLC | $1132337523 | 569174 | 0.69% | शेयर |
| Point72 Asset Management, L.P. | $1103464780 | 554661 | 0.67% | शेयर |
| SANDS CAPITAL MANAGEMENT, LLC | $1061750202 | 533693 | 0.65% | शेयर |
| ALLIANCEBERNSTEIN L.P. | $1010726853 | 765221 | 0.62% | शेयर |
| VICTORY CAPITAL MANAGEMENT INC | $947094463 | 476010 | 0.58% | शेयर |
| JANE STREET GROUP, LLC | $927079040 | 466000 | 0.57% | कॉल ऑप्शन |
| TWO SIGMA INVESTMENTS, LP | $918136507 | 461505 | 0.56% | शेयर |
| ENVESTNET ASSET MANAGEMENT INC | $876782888 | 440721 | 0.53% | शेयर |
| AXIOM INVESTORS LLC /DE | $864918987 | 434755 | 0.53% | शेयर |
| EDGEWOOD MANAGEMENT LLC | $860858540 | 432714 | 0.52% | शेयर |
| EAGLE CAPITAL MANAGEMENT LLC | $743880300 | 373914 | 0.45% | शेयर |
| AMERICAN CENTURY COMPANIES INC | $739921065 | 371924 | 0.45% | शेयर |
| PRIMECAP MANAGEMENT CO/CA/ | $699439357 | 351576 | 0.43% | शेयर |
| REGENTS OF THE UNIVERSITY OF CALIFORNIA | $698854462 | 351282 | 0.43% | शेयर |
| CIBC Bancorp USA Inc. | $694314234 | 348738 | 0.42% | शेयर |
| Winslow Capital Management, LLC | $693033361 | 348356 | 0.42% | शेयर |
| BNP PARIBAS FINANCIAL MARKETS | $681570208 | 342594 | 0.42% | शेयर |
| CITIGROUP INC | $649238631 | 326342 | 0.40% | शेयर |
| Value Aligned Research Advisors, LLC | $637814464 | 320600 | 0.39% | कॉल ऑप्शन |
| BROWN ADVISORY INC | $621660400 | 312480 | 0.38% | शेयर |
ईटीएफ स्वामित्व 64 ETFs द्वारा धारित
वजन केवल प्रत्यक्ष इक्विटी होल्डिंग्स (N-PORT) को दर्शाता है; लीवरेज्ड या डेरिवेटिव-आधारित फंड में अतिरिक्त स्वैप एक्सपोजर हो सकता है जो नहीं दिखाया गया है।
| फंड | भार | इकाइयाँ | तिथि अनुसार | स्रोत |
|---|---|---|---|---|
| EWN · iShares, Inc. | 22.31% | 84734 SH | 11 सितमबर 2026 | दैनिक |
| IDMO · Invesco Exchange-Traded Fund Trust … | 9.56% | 222199 SH | 5 अक्टूबर 2026 | दैनिक |
| EZU · iShares, Inc. | 8.68% | 492662 SH | 11 सितमबर 2026 | दैनिक |
| MTRA · Invesco Actively Managed Exchange-T… | 8.08% | 5907 SH | 5 अक्टूबर 2026 | दैनिक |
| EFG · iShares Trust | 6.17% | 599925 SH | 11 सितमबर 2026 | दैनिक |
| DMXF · iShares Trust | 6.07% | 33678 SH | 11 सितमबर 2026 | दैनिक |
| IQLT · iShares Trust | 5.65% | 458139 SH | 11 सितमबर 2026 | दैनिक |
| GRW · TCW ETF Trust | 5.38% | 2142 NS | 31 जुलाई 2026 | N-PORT |
| IDHQ · Invesco Exchange-Traded Fund Trust … | 5.25% | 31337 SH | 5 अक्टूबर 2026 | दैनिक |
| IMTM · iShares Trust | 4.82% | 121919 SH | 11 सितमबर 2026 | दैनिक |
| VGK · VANGUARD INTERNATIONAL EQUITY INDEX… | 4.80% | 927679 SH | 19 अगस्त 2026 | दैनिक |
| SUPP · TCW ETF Trust | 4.76% | 349 NS | 31 जुलाई 2026 | N-PORT |
| IEV · iShares Trust | 4.71% | 45309 SH | 11 सितमबर 2026 | दैनिक |
| IEUR · iShares Trust | 4.23% | 226267 SH | 11 सितमबर 2026 | दैनिक |
| SOXQ · Invesco Exchange-Traded Fund Trust … | 3.87% | 68616 SH | 5 अक्टूबर 2026 | दैनिक |
| DIHP · Dimensional ETF Trust | 3.51% | 137089 NS | 31 जुलाई 2026 | N-PORT |
| ESGD · iShares Trust | 3.20% | 226669 SH | 11 सितमबर 2026 | दैनिक |
| PABD · iShares Trust | 3.11% | 5994 SH | 11 सितमबर 2026 | दैनिक |
| EFA · iShares Trust | 3.01% | 1383240 SH | 11 सितमबर 2026 | दैनिक |
| QNXT · iShares Trust | 2.96% | 479 SH | 11 सितमबर 2026 | दैनिक |
| AIFD · TCW ETF Trust | 2.94% | 2259 NS | 31 जुलाई 2026 | N-PORT |
| IMFL · Invesco Exchange-Traded Self-Indexe… | 2.80% | 16291 SH | 5 अक्टूबर 2026 | दैनिक |
| IEFA · iShares Trust | 2.58% | 2931914 SH | 11 सितमबर 2026 | दैनिक |
| AQLT · iShares Trust | 2.55% | 4845 SH | 11 सितमबर 2026 | दैनिक |
| DFSI · Dimensional ETF Trust | 2.48% | 17456 NS | 31 जुलाई 2026 | N-PORT |
| IXN · iShares Trust | 2.42% | 132571 SH | 11 सितमबर 2026 | दैनिक |
| SOXX · iShares Trust | 2.42% | 622400 SH | 11 सितमबर 2026 | दैनिक |
| INTF · iShares Trust | 2.41% | 52774 SH | 11 सितमबर 2026 | दैनिक |
| IDVZ · Elevation Series Trust | 2.35% | 2837 NS | 31 जुलाई 2026 | N-PORT |
| VEA · VANGUARD TAX-MANAGED FUNDS | 2.33% | 3773498 SH | 19 अगस्त 2026 | दैनिक |
| IDEV · iShares Trust | 2.27% | 429322 SH | 11 सितमबर 2026 | दैनिक |
| VSGX · VANGUARD WORLD FUND | 2.26% | 77513 SH | 19 अगस्त 2026 | दैनिक |
| ESIM · Strategy Shares | 2.05% | 227 NS | 31 जुलाई 2026 | N-PORT |
| THNQ · EXCHANGE TRADED CONCEPTS TRUST | 2.02% | 5168 NS | 31 जुलाई 2026 | N-PORT |
| VEU · VANGUARD INTERNATIONAL EQUITY INDEX… | 1.85% | 903309 SH | 19 अगस्त 2026 | दैनिक |
| ACWX · iShares Trust | 1.76% | 128585 SH | 11 सितमबर 2026 | दैनिक |
| VXUS · VANGUARD STAR FUNDS | 1.68% | 5673014 SH | 19 अगस्त 2026 | दैनिक |
| SOXL · Direxion Shares ETF Trust | 1.65% | 197024 NS | 31 जुलाई 2026 | N-PORT |
| DFAI · Dimensional ETF Trust | 1.63% | 175212 NS | 31 जुलाई 2026 | N-PORT |
| IOO · iShares Trust | 1.61% | 84938 SH | 11 सितमबर 2026 | दैनिक |
| MPLY · Strategy Shares | 1.57% | 153 NS | 31 जुलाई 2026 | N-PORT |
| IXUS · iShares Trust | 1.52% | 536382 SH | 11 सितमबर 2026 | दैनिक |
| DFIC · Dimensional ETF Trust | 1.05% | 95349 NS | 31 जुलाई 2026 | N-PORT |
| DXIV · Dimensional ETF Trust | 1.05% | 1307 NS | 31 जुलाई 2026 | N-PORT |
| QQQE · Direxion Shares ETF Trust | 1.03% | 8428 NS | 31 जुलाई 2026 | N-PORT |
| TOK · iShares Trust | 0.78% | 1077 SH | 11 सितमबर 2026 | दैनिक |
| URTH · iShares, Inc. | 0.73% | 34908 SH | 11 सितमबर 2026 | दैनिक |
| QQQM · Invesco Exchange-Traded Fund Trust … | 0.73% | 433844 SH | 5 अक्टूबर 2026 | दैनिक |
| QQQ · Invesco QQQ Trust, Series 1 | 0.72% | 1962501 SH | 5 अक्टूबर 2026 | दैनिक |
| QRMI · Global X Funds | 0.72% | 63 NS | 31 जुलाई 2026 | N-PORT |
| QYLD · Global X Funds | 0.70% | 34635 NS | 31 जुलाई 2026 | N-PORT |
| QYLG · Global X Funds | 0.69% | 666 NS | 31 जुलाई 2026 | N-PORT |
| CRBN · iShares Trust | 0.68% | 4641 SH | 11 सितमबर 2026 | दैनिक |
| QTR · Global X Funds | 0.66% | 31 NS | 31 जुलाई 2026 | N-PORT |
| VT · VANGUARD INTERNATIONAL EQUITY INDEX… | 0.65% | 323470 SH | 19 अगस्त 2026 | दैनिक |
| ACWI · iShares Trust | 0.64% | 123648 SH | 11 सितमबर 2026 | दैनिक |
| QCLR · Global X Funds | 0.64% | 13 NS | 31 जुलाई 2026 | N-PORT |
| DFAX · Dimensional ETF Trust | 0.62% | 46020 NS | 31 जुलाई 2026 | N-PORT |
| GLOF · iShares Trust | 0.60% | 707 SH | 11 सितमबर 2026 | दैनिक |
| ACWV · iShares, Inc. | 0.43% | 8461 SH | 11 सितमबर 2026 | दैनिक |
| PXF · Invesco Exchange-Traded Fund Trust … | 0.40% | 6239 SH | 5 अक्टूबर 2026 | दैनिक |
| EFAV · iShares Trust | 0.29% | 9167 SH | 11 सितमबर 2026 | दैनिक |
| BNDW · VANGUARD SCOTTSDALE FUNDS | · | · | 30 जुलाई 2026 | दैनिक |
| BNDX · VANGUARD CHARLOTTE FUNDS | · | · | 15 जुलाई 2026 | दैनिक |
ASML विश्लेषक सर्वसम्मति तेजी और मंदी के विश्लेषक राय, 12-महीने का मूल्य लक्ष्य, अपसाइड
12-महीने का मूल्य लक्ष्य
16 विश्लेषक · 2026-10-05माध्य लक्ष्य $2087.84 +13.8%
ताज़ा समाचार इस कंपनी का उल्लेख करने वाली हालिया सुर्खियां
ASML एआई विश्लेषक पैनल — तेजी और मंदी के विचार स्टॉक की संभावनाओं पर 2026Q2 बहस: क्लॉड, ग्रोक, जेमिनी, चैटजीपीटी
ASML AI क्रांति पर एक उच्च-दांव वाला दांव बना हुआ है, जो एक अद्वितीय विनिर्माण एकाधिकार को महत्वपूर्ण भू-राजनीतिक और मूल्यांकन जोखिमों के विरुद्ध संतुलित करता है। Grok का तर्क है कि कंपनी की अनिवार्य EUV तकनीक खरीदने को सही ठहराती है, जबकि Claude, ChatGPT, और Gemini चेतावनी देते हैं कि 34.5 P/E त्रुटि के लिए कोई जगह नहीं छोड़ता है। पैनल इस बात पर विभाजित है कि 21.86 ऋण-से-इक्विटी अनुपात वित्तीय ताकत का संकेत देता है या बदलते निर्यात नियंत्रणों के प्रति एक खतरनाक भेद्यता, अंततः एक सतर्क होल्ड का पक्ष लेता है।
राउंड 1 — शुरुआती विचार
मैं ASML को AI चिप निर्माण पर हावी होते हुए देखता हूं क्योंकि EUV लिथोग्राफी टूल का एकाधिकार आपूर्तिकर्ता है जिसे कोई भी बड़े पैमाने पर मेल नहीं खा सकता है। उन्होंने 15 अप्रैल को अपनी 2026 की बिक्री का पूर्वानुमान बढ़ाया, AI मांग को आपूर्ति से अधिक बताते हुए, जो बहु-वर्षीय राजस्व दृश्यता को लॉक करता है। शुद्ध मार्जिन TTM 31.73% तक बढ़ गया, पिछले तिमाही में 29.31% से ऊपर, यह दर्शाता है कि वे मूल्य निर्धारण शक्ति के कारण लाभ के रूप में उस मांग का अधिकांश हिस्सा जेब में रखते हैं। ROE 46.86% पर स्थिर है, जो साबित करता है कि कुशल पूंजी बिना लीवरेज जोखिम के उच्च रिटर्न में बदल जाती है, D/E 21.86 पर सपाट है।
मेरा अनुमान है कि ASML के ऊंचे मूल्यांकन में AI मांग के निराश होने की कोई गुंजाइश नहीं है, जिससे विकास धीमा होने पर कई गुना संकुचन का खतरा है। P/E TTM 34.5 पर है, जो मूल्य रैली के साथ ऊपर है, जिसका अर्थ है कि बाजार आगे वर्षों के लिए निर्दोष निष्पादन की मांग करता है। P/B 12.3 पर थोड़ा नीचे है, लेकिन फिर भी पुस्तक मूल्य को भारी प्रीमियम देता है, यदि कैपेक्स चक्र मुड़ते हैं तो कमजोर है। हाल की मूल्य अस्थिरता, मई की शुरुआत में 651 तक गिरकर 802 पर वापस आने से पता चलता है कि भावना में उतार-चढ़ाव कितनी तेजी से लाभ को मिटा सकता है।
ASML एक संरचनात्मक टेलविंड की सवारी कर रहा है जिसका अधिकांश चिप निर्माता केवल सपना देख सकते हैं — यह उन्नत सेमीकंडक्टर निर्माण के लिए एकमात्र महत्वपूर्ण चोकपॉइंट है, और AI मांग अब आपूर्ति से अधिक हो रही है। कंपनी ने 15 अप्रैल को 2026 मार्गदर्शन बढ़ाया, जो निरंतर ऑर्डर प्रवाह में विश्वास का संकेत देता है। शुद्ध मार्जिन बढ़कर 31.73% हो गया, जो एक साल पहले 29.31% से ऊपर था, जो मुझे बताता है कि मूल्य निर्धारण शक्ति वास्तविक और टिकाऊ है। 34.5 P/E पर भी, वह एकाधिक संकुचित हो जाता है यदि आय वृद्धि 15-20% की सीमा में रहती है, जो मार्गदर्शन वृद्धि का सुझाव देता है कि यह यथार्थवादी है।
ASML के मूल्यांकन में पहले से ही वर्षों के निर्दोष निष्पादन की कीमत तय हो चुकी है — 34.5 गुना पिछले आय और 10.9 गुना बिक्री पर, त्रुटि के लिए लगभग कोई मार्जिन नहीं है। स्टॉक केवल भावना के आधार पर मई से 18% बढ़ गया है, और भावना मौलिकता से तेजी से उलट सकती है। ऋण-से-इक्विटी 21.86 पर है, जो एक पूंजी-प्रकाश सॉफ्टवेयर-संबंधित व्यवसाय के लिए ऊंचा है और यदि TSMC जैसा ग्राहक लड़खड़ाता है तो वित्तीय लचीलेपन को सीमित करता है। मेरी चिंता यह है कि बाजार ASML को AI अपसाइड के प्रॉक्सी के रूप में मान रहा है, न कि उसके अपने नकदी उत्पादन पर उसका मूल्यांकन कर रहा है।
ASML पूरे AI हार्डवेयर क्रांति के लिए अनिवार्य टोल बूथ है, और उनके हालिया मार्गदर्शन वृद्धि साबित करती है कि उनके पास शून्य प्रतिस्पर्धा है। कंपनी वर्तमान में 31.73% का शुद्ध लाभ मार्जिन उत्पन्न कर रही है। इसका मतलब है कि हर बिक्री का लगभग एक तिहाई सीधे बॉटम लाइन में जाता है, जो एक्सट्रीम अल्ट्रावायलेट लिथोग्राफी में उनके पूर्ण प्रभुत्व को उजागर करता है। 46.86% ROE के साथ, वे शेयरधारक पूंजी को वास्तविक विकास में बदलने में अविश्वसनीय रूप से कुशल हैं। रिटर्न का यह स्तर उनके अद्वितीय, उच्च-स्तरीय चिप-निर्माण मशीनों के आसपास निर्मित विशाल प्रवेश बाधाओं का एक प्रमाण है।
मूल्यांकन एक ऐसे बिंदु पर पहुंच गया है जहां बाजार पूर्णता की कीमत तय कर रहा है, जिससे 2026 में एक भी चूक के लिए बिल्कुल कोई जगह नहीं बची है। निवेशक इन शेयरों के लिए 34.49 गुना पिछले आय का भुगतान कर रहे हैं। यह एक खड़ी प्रीमियम है जिसके लिए वर्तमान मूल्य को सही ठहराने के लिए निर्दोष निष्पादन और निरंतर, अति-विकास की मांग की आवश्यकता होती है। इसके अलावा, 21.86 ऋण-से-इक्विटी अनुपात यह संकेत देता है कि जबकि वे सॉल्वेंट हैं, वे अपने बड़े पैमाने पर आर एंड डी खर्च को बनाए रखने के लिए महत्वपूर्ण लीवरेज ले रहे हैं। यदि AI खर्च चक्र थोड़ा भी ठंडा होता है, तो वह ऋण भार अचानक उनके बैलेंस शीट पर बहुत भारी महसूस होगा।
मुझे लगता है कि ASML टिकाऊ अपसाइड के लिए AI-संचालित टूल मांग और अल्ट्रा-स्ट्रॉन्ग मार्जिन के कारण स्थित है। ROE TTM 46.86% दिखाता है कि कंपनी इक्विटी को बहुत उच्च दर पर मुनाफे में परिवर्तित करती है, जो कुशल पैमाने और पूंजी-प्रकाश विकास पथ का संकेत देता है। वह दक्षता आय वृद्धि और मजबूत नकदी उत्पादन प्रोफ़ाइल का समर्थन करती है। शुद्ध लाभ मार्जिन 31.73% का मतलब है कि अधिकांश राजस्व लाभ बन जाता है, जिससे ASML को पुनर्निवेश करने और पूंजी वापस करने की जगह मिलती है। EPS TTM 26.03 एक मजबूत आय आधार का संकेत देता है जो AI-पूंजीगत सामान के लिए भूखे बाजार में प्रीमियम एकाधिक को सही ठहराता है।
मुझे लगता है कि बियर केस यह है कि ASML का मूल्यांकन फैला हुआ है और यदि AI चक्र धीमा हो जाता है तो लीवरेज काट सकता है। P/E TTM 34.49 बताता है कि निवेशक बहु-वर्षीय AI विकास की कीमत तय कर रहे हैं; यदि मांग धीमी हो जाती है, तो एकाधिक संकुचित हो जाते हैं। P/S TTM 10.94 इस बात पर जोर देता है कि स्टॉक एक समृद्ध राजस्व एकाधिक पर कारोबार करता है, जिससे यह किसी भी टॉप-लाइन गलती के प्रति संवेदनशील हो जाता है। ऋण/इक्विटी 21.86 ऊंचा लीवरेज इंगित करता है जो वित्तपोषण लागत बढ़ने या कैपेक्स मांग नरम होने पर रिटर्न पर भारी पड़ सकता है।
राउंड 2 — प्रतिक्रियाएं और खंडन
राउंड 2 — प्रतिक्रियाएं और खंडन
Claude, मैं ASML जैसे कैपेक्स-भारी लीडर के लिए 21.86 पर ऋण-से-इक्विटी को ऊंचा कहने पर वापस धकेलता हूं — यह कई तिमाहियों से सपाट रहा है, जिसका अर्थ है कि ऋण केवल उनके इक्विटी आधार के पांचवें हिस्से को आर एंड डी को बाधित किए बिना फंड करता है। वह स्थिरता 1.41 के वर्तमान अनुपात के साथ जुड़ती है, जो किसी भी TSMC हिचकी को झेलने के लिए पर्याप्त तरलता की पुष्टि करती है। यह निकट-अवधि के डर पर बहु-वर्षीय AI टेलविंड के मामले को मजबूत करता है।
मुझे Grok की D/E अनुपात की रीडिंग पर वापस धकेलने की जरूरत है। Grok का कहना है कि 21.86 ऋण-से-इक्विटी सपाट है और साबित करता है कि कोई लीवरेज जोखिम नहीं है — लेकिन यह उल्टा है। 21.86 का D/E का मतलब है कि ASML 31.73% शुद्ध मार्जिन प्रिंट करने वाली कंपनी के लिए वास्तव में ऊंचा, इक्विटी के प्रत्येक डॉलर के लिए लगभग $22 का ऋण ले रहा है। तथ्य यह है कि यह सपाट है इसे सुरक्षित नहीं बनाता है; इसका मतलब है कि वे रिकॉर्ड लाभप्रदता के बावजूद डी-लीवरेज नहीं कर रहे हैं। यदि AI मांग ठंडी होती है और नकदी प्रवाह तंग होता है, तो वह ऋण भार कैपेक्स लचीलेपन पर एक वास्तविक बाधा बन जाता है — ठीक उसी समय जब ASML को प्रतिस्पर्धा से आगे रहने के लिए सबसे कठिन निवेश करने की आवश्यकता होती है।
Grok, मुझे लगता है कि आप ASML के लीवरेज के संरचनात्मक जोखिम को नजरअंदाज कर रहे हैं जब आप 21.86 ऋण-से-इक्विटी अनुपात को सपाट कहते हैं। जबकि संख्या नहीं बदली है, वह अनुपात बताता है कि वे अपने बड़े पैमाने पर आर एंड डी और EUV उत्पादन क्षमता को उधार लिए गए पैसे की एक महत्वपूर्ण राशि के साथ वित्तपोषित कर रहे हैं। इसका मतलब है कि यदि AI मांग चक्र एक स्पीड बंप से टकराता है, तो उनके निश्चित ब्याज दायित्व स्थिर रहते हैं जबकि राजस्व अस्थिर हो जाता है। वह लीवरेज एक छोटी बिक्री गिरावट को उनके बॉटम लाइन के लिए एक बड़े खतरे में बदल देता है, यही कारण है कि मैं होल्ड रेटिंग के साथ बना हुआ हूं।
Grok, मैं आपके साथ इस जोखिम पर हूं कि ऊंचे एकाधिक में त्रुटि के लिए बहुत कम जगह बची है, लेकिन मुझे लगता है कि आप ASML के बचाव की स्थायित्व को कम आंक रहे हैं। स्टॉक 34.5x पिछले आय पर कारोबार करता है। इसका मतलब है कि निवेशक पहले से ही AI-संचालित विकास के वर्षों की कीमत तय कर रहे हैं; निकट-अवधि की मांग में गड़बड़ी से आय के पकड़ने से पहले एकाधिक संपीड़ित होने की संभावना है। एकाधिक से परे, Q1 बीट और AI चक्र दृश्यता निरंतर मजबूत ऑर्डर प्रवाह के लिए तर्क देती है, जो कुछ निकट-अवधि के नीचे की ओर जोखिम को ऑफसेट करती है।
राउंड 3 — अंतिम खंडन
राउंड 3 — अंतिम खंडन
Claude, Gemini, लीवरेज टॉक को अलग रखते हुए, ग्राहक एकाग्रता वास्तव में अभी बुल केस को मजबूत करती है। TSMC, ASML का शीर्ष ग्राहक जिसे 16 अप्रैल की खबरों में मजबूत आपसी आय के साथ हाइलाइट किया गया था, AI चिप्स को रैंप कर रहा है जहां ASML उपकरण अपूरणीय हैं। उस सहजीवन ने 15 अप्रैल के मार्गदर्शन को बढ़ाया, जिसमें शुद्ध ऑर्डर आपूर्ति से अधिक थे। कोई गड़बड़ी के संकेत नहीं — इसके बजाय, यह D/E भय पर बहु-वर्षीय दृश्यता को मजबूत करता है, जिससे 2026Q2 के लिए खरीद होती है।
मैं कुछ ऐसा वापस धकेलना चाहता हूं जिसे किसी ने अभी तक नहीं छुआ है — ग्राहक एकाग्रता। ASML का राजस्व TSMC, Samsung और Intel पर बहुत अधिक निर्भर करता है। यदि TSMC अकेले 40-50% ऑर्डर का प्रतिनिधित्व करता है, तो ASML का मार्गदर्शन वृद्धि वास्तव में एक ग्राहक के कैपेक्स चक्र पर एक शर्त है, न कि एक विविध AI टेलविंड। इसका मतलब है कि जब TSMC की इन्वेंट्री सामान्य हो जाती है या उनका कैपेक्स रुक जाता है, तो ASML की वृद्धि केवल धीमी नहीं होती है — यह क्रेटर हो सकती है। Grok और Gemini 31.73% शुद्ध मार्जिन और मार्गदर्शन को टिकाऊ मान रहे हैं, लेकिन वे दोनों TSMC के अति-विकास मोड में रहने पर निर्भर हैं। वह एक संरचनात्मक बचाव नहीं है; वह मूल्य निर्धारण शक्ति के रूप में भेष बदलने वाला ग्राहक एकाग्रता जोखिम है।
Grok, मैं वर्तमान अनुपात के जोखिम के खिलाफ ढाल के रूप में आपके मूल्यांकन से असहमत हूं। 1.41 का वर्तमान अनुपात का मतलब है कि ASML के पास अल्पकालिक ऋण के प्रत्येक डॉलर के लिए लगभग $1.41 तरल संपत्ति है, जो तीव्र भू-राजनीतिक निर्यात नियंत्रणों का सामना करने वाली कंपनी के लिए खतरनाक रूप से पतला है। हम इस बात को नजरअंदाज नहीं कर सकते कि अमेरिकी और डच सरकारें चीन को उच्च-स्तरीय लिथोग्राफी टूल भेजने पर प्रतिबंध कस रही हैं। यह नियामक दबाव सिर्फ एक सुर्खियां नहीं है; यह ASML के सबसे बड़े विकास बाजार से राजस्व धारा को खतरा है, संभावित रूप से उस तंग तरलता को एक सॉल्वेंसी बाधा में बदल सकता है यदि बिक्री चैनल अचानक अवरुद्ध हो जाते हैं।
मुझे लगता है कि हमें ASML के चीन एक्सपोजर के आसपास नियामक जोखिम के लिए फ्रेम को चौड़ा करना चाहिए। Claude, लीवरेज के बारे में आपका बिंदु दिलचस्प है, लेकिन मजबूत मौलिकता के साथ भी नीति जोखिम अपसाइड को सीमित कर सकता है। Grok, Gemini, मैं अभी भी AI-संचालित मांग को टिकाऊ देखता हूं, लेकिन नीदरलैंड में EUV बिक्री को चीन तक सीमित करने वाले निर्यात नियंत्रण ऑर्डर को ट्रिम कर सकते हैं और बहु-वर्षीय विकास में देरी कर सकते हैं। 2026Q2 के लिए ओवरहैंग मायने रखता है क्योंकि नीति चालें राजस्व दृश्यता को बाधित कर सकती हैं, भले ही Q1 बीट नकदी उत्पादन कहानी को रेखांकित करता है।
मूल्य पूर्वानुमान
| मॉडल | 3M लक्ष्य | 6M लक्ष्य | तर्क |
|---|---|---|---|
| Grok | $750.00 | $820.00 | मैं ASML को 2026Q2 के माध्यम से उच्च स्तर पर वापस आते हुए देखता हूं क्योंकि इसका EUV एकाधिकार आपूर्ति से अधिक लगातार AI टूल मांग को कैप्चर करता है। 17 जुलाई, 2026 को TSMC की Q2 आय, कैपेक्स रैंप को स्पॉटलाइट करेगी जो ASML के अप्रैल मार्गदर्शन वृद्धि को मान्य करती है और ऑर्डर को उच्च ड्राइव करती है। बड़ा जोखिम डच नियामकों द्वारा Q3 आय तक चीन निर्यात प्रतिबंधों का विस्तार करना है, जो रातोंरात संभावित बिक्री का 20-30% काट देगा। मेरा 6-महीने का $820 लक्ष्य बढ़ती EPS पर लगभग 37 के फॉरवर्ड P/E का तात्पर्य है, जो 31.73% शुद्ध मार्जिन को पुरस्कृत करता है जो AI प्रचार को टिकाऊ मुनाफे में परिवर्तित करता है। |
| Claude | $745.00 | $820.00 | EUV में ASML का संरचनात्मक बचाव वास्तविक है, लेकिन स्टॉक 34.5x P/E पर निर्दोष निष्पादन की कीमत तय कर रहा है — जिसका अर्थ है कि बाजार ने पहले से ही AI-संचालित विकास के वर्षों को एकीकृत कर लिया है। मेरा थीसिस: भावना के ठंडा होने पर निकट-अवधि का समेकन, फिर 2026Q2 आय के रूप में रिकवरी साबित होती है कि मार्गदर्शन वृद्धि अर्जित की गई थी, न कि प्रचार। उत्प्रेरक: ASML की Q2 2026 आय बीट (देर जुलाई) निरंतर TSMC कैपेक्स और मार्जिन स्थायित्व की पुष्टि करती है। जोखिम: TSMC मार्गदर्शन में कटौती या निर्यात नियंत्रण कसने से चीन का राजस्व अवरुद्ध हो सकता है, जो हफ्तों में एकाधिक को 15-20% संपीड़ित कर सकता है। 34.5x पिछले आय पर, एक मामूली आय चूक भी आय के ठीक होने से पहले एकाधिक संपीड़न को ट्रिगर करती है। मैं अपनी होल्ड रेटिंग बनाए रख रहा हूं लेकिन 745 को उचित 3-महीने का मूल्य देखता हूं, फिर Q3 तक 820 यदि Q2 निष्पादन बना रहता है। |
| Gemini | $725.00 | $760.00 | मेरा थीसिस यह है कि ASML साइडवेज कारोबार करेगा क्योंकि बाजार AI-संचालित ऑर्डर बैकलॉग को कसने वाले निर्यात नियंत्रणों और ऊंचे मूल्यांकन की वास्तविकता के मुकाबले संतुलित करता है। छह महीने के दृष्टिकोण के लिए एक प्रमुख उत्प्रेरक Q3 आय रिपोर्ट है, जहां मार्जिन संपीड़न का कोई भी संकेत यह संकेत देगा कि भू-राजनीतिक हेडविंड अंततः बॉटम लाइन को प्रभावित कर रहे हैं। इसके विपरीत, चीन को उच्च-स्तरीय लिथोग्राफी टूल पर अमेरिकी नेतृत्व वाले निर्यात प्रतिबंधों का एक महत्वपूर्ण विस्तार मेरे थीसिस को तोड़ सकता है। निवेशक वर्तमान में इन शेयरों के लिए 34.49 गुना पिछले आय का भुगतान कर रहे हैं। यह एक खड़ी प्रीमियम है जिसके लिए अनिश्चित नियामक माहौल में वर्तमान मूल्य को सही ठहराने के लिए निर्दोष निष्पादन की आवश्यकता होती है। |
| Chatgpt | $710.00 | $750.00 | मुझे लगता है कि ASML टिकाऊ AI टूल मांग और ठोस मार्जिन पर अगले कुछ महीनों में उच्च स्तर पर जा सकता है, लेकिन मूल्यांकन और नीति जोखिम अपसाइड को सीमित करते हैं। एक ठोस उत्प्रेरक देर जुलाई में आने वाली आय प्रिंट है जो निरंतर AI-संचालित ऑर्डर गति और संभावित मार्गदर्शन उन्नयन दिखाती है। एक ठोस जोखिम त्वरित निर्यात नियंत्रण है जो ASML के चीन एक्सपोजर को सीमित करता है, जो ऑर्डर को ट्रिम कर सकता है। ASML लगभग 34.5x पिछले आय पर कारोबार करता है। इसका मतलब है कि बाजार स्टॉक में AI-संचालित विकास के वर्षों की कीमत तय कर रहा है, इसलिए एक मामूली चूक या नीति झटका एकाधिक संपीड़न को मजबूर कर सकता है। |
ट्रेडिंग सिग्नल प्रवेश मूल्य और जोखिम/इनाम अनुपात के साथ हालिया खरीद/बिक्री संकेत
अभी कोई खुला सिग्नल नहीं — कोई कार्ड भरा नहीं है, और यह ईमानदार है।
मेरे मेट्रिक्स आपकी व्यक्तिगत वॉचलिस्ट — पूर्ण फंडामेंटल से चयनित पंक्तियाँ
उन मेट्रिक्स को चुनें जो आपके लिए मायने रखते हैं — ऊपर फुल फंडामेंटल्स में किसी भी पंक्ति के बगल में + पर क्लिक करें।
आपका चयन सहेजा गया है और यह सभी टिकर में आपके साथ रहता है।