
HOOD Class A Robinhood Markets, Inc. - Class A Common Stock
NASDAQ · Financial Services · SEC EDGAR पर देखें ↗ बंद अक्ट 2, 2026 10-K/10-Q जुल 30, 2026HOOD स्टॉक स्नैपशॉट मूल्य, बाजार पूंजीकरण, P/E, EPS, ROE, ऋण/इक्विटी, 52-सप्ताह की सीमा
HOOD स्टॉक मूल्य चार्ट तकनीकी संकेतकों के साथ दैनिक OHLCV — पैन, ज़ूम और अपना दृश्य कस्टमाइज़ करें
बार ग्रैन्युलैरिटी चयनित अवधि के अनुसार अनुकूलित होती है — बार के लिए ओपन/हाई/लो/क्लोज देखने के लिए चार्ट पर होवर करें।
Robinhood Markets, Inc. - Class A Common Stock के बारे में विकिपीडिया से कंपनी का अवलोकन
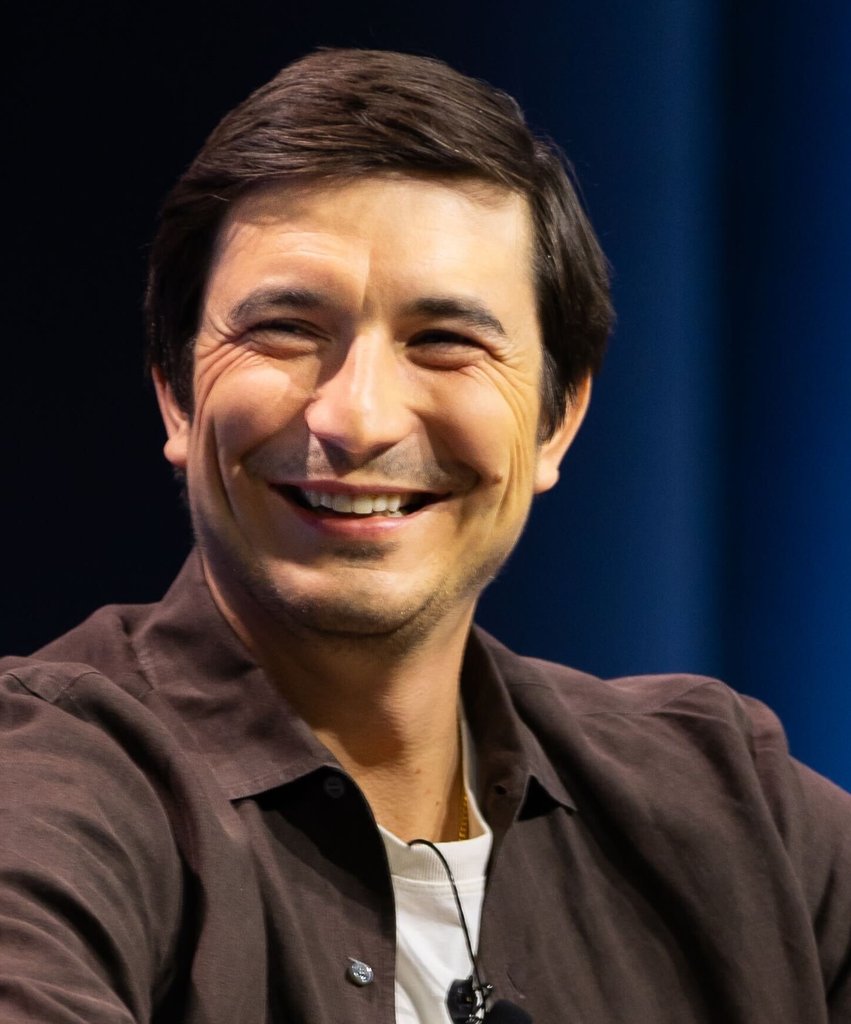
Robinhood Markets, Inc. is an American financial services company based in Menlo Park, California. It provides an electronic trading platform that facilitates trades of stocks, exchange-traded funds (ETFs), options, index options, futures contracts, event contracts on prediction markets, and cryptocurrency. It also offers cryptocurrency wallets, wealth management, credit cards and other banking services, some in partnership with banks insured by the FDIC, and operates a venture capital arm as well as an independent media subsidiary, Sherwood.News.
The company has more than 27 million funded customers and $307 billion total platform assets. Its platform is available in the U.S., the UK, and, for trading cryptocurrency and tokenized stocks and ETFs, in the European Union. Bitstamp, its cryptocurrency exchange, holds licenses in Singapore, Luxembourg, the UK, Slovenia and the U.S.
The company does not allow trading in mutual funds, preferred stocks, bonds, some high-risk penny stocks, and new positions in options on their expiration dates in the last 30 minutes of the trading day.
History
2013-2019: Foundation, options and cryptocurrency trading
Robinhood was founded in April 2013 by Vladimir Tenev and Baiju Bhatt, two former Stanford classmates who had previously built high-frequency trading platforms for financial institutions in New York City. The company is named after Robin Hood, based on its self-stated mission to "democratize finance for all". Tenev and Bhatt served as co-CEOs from 2013 to 2020, when Tenev became the sole CEO and Bhatt became chief creative officer.
In December 2013, Robinhood closed its seed funding round, securing $3 million in an investment led by Index Ventures, with participation from Andreessen Horowitz, Rothenberg Ventures, Tim Draper, and Howard Lindzon.
The founders presented the mobile app at LA Hacks in April 2014 and launched a beta release in December on the Apple App Store. That September, Robinhood raised $13 million in a Series A round, with returning investors Index Ventures and Howard Lindzon, as well as new investors Ribbit Capital, Aaron Levie, Dave Morin, Jared Leto, Snoop Dogg, and Nas.
The mobile app was launched officially in March 2015. In May 2015, the company raised $50 million in a Series B round led by New Enterprise Associates.
Robinhood raised $110 million in a Series C round at a $1.3 billion valuation in April 2017, bringing its total funding raised to $176 million. Investors included Yuri Milner of DST Global, Greenoaks Capital, and Thrive Capital. In December 2017, the company launched commission-free options trading.
In February 2018, the company announced that it would be moving its headquarters from Palo Alto to the former headquarters of Sunset magazine in Menlo Park. That same month, Robinhood launched cryptocurrency trading. Later that year, the company launched its own clearing system.
In May 2018, Robinhood closed a $363 million Series D financing round led by DST Global, bringing its total equity funding to $539 million. Robinhood raised $323 million in a Series E venture funding round led by DST Global, the following July.
In March 2019, Robinhood acquired MarketSnacks, a financial newsletter. Robinhood launched banking products with insurance from the Federal Deposit Insurance Corporation via partner banks in December 2019.
The Financial Industry Regulatory Authority fined Robinhood $1.25 million in December 2019 for failing to determine whether its market makers provided the best execution quality as compared to other execution venues.
2020-2021: Increased usage and Game Stop short squeeze
In the second quarter of 2020, during the 2020 stock market crash, compared to the first quarter of 2020, trading volumes increased 139%, more than any other major brokerage.
In May 2020, Robinhood raised $280 million in a Series F venture funding round led by Sequoia Capital at a pre-money valuation of $8.3 billion. Robinhood began offering additional guidance and requiring additional criteria and education for customers seeking authorization to trade options after a University of Nebraska–Lincoln student died by suicide in June 2020 after seeing a six-figure negative cash balance on his account.
In August 2020, the company announced a $200 million Series G funding round from a new investor, D1 Capital Partners.
In October 2020, Robinhood found that almost 2,000 Robinhood accounts were compromised and that the hackers had siphoned off customer funds. The users' personal email addresses had been compromised outside of Robinhood and the company fully compensated customers if they lost money because of unauthorized activity.
In December 2020, the company paid $65 million to settle accusations by the U.S. Securities and Exchange Commission that it failed to disclose payment for order flow, that some customers' orders lost a total of approximately $34.1 million in price improvement compared to the best execution by other brokers, and that Robinhood made false and misleading statements about its execution quality.
Also in December 2020, Robinhood was sued in the United States District Court for the Northern District of California for failing to disclose to customers that it received payment for order flow. The case was consolidated with others under In re Robinhood Order Flow Litigation (No. 4:20-cv-09328) and was settled for $2 million in December 2025.
Also in December 2020, the Securities Division of the Massachusetts Secretary of the Commonwealth filed an administrative complaint alleging violation of state securities laws and claimed that Robinhood exploited novice investors with gamification. In March 2022, the Suffolk County Superior Court declared that the new fiduciary duty rule underlying parts of the case was invalid. In February 2024, the company paid $7.5 million and agreed to overhaul its digital engagement practices to settle the remaining claims.
On January 28, 2021, several broker-dealers, including Robinhood Securities, restricted the purchase of certain stocks, most notably GameStop, to meet collateral requirements at its clearing house, the National Securities Clearing Corporation, following an effort by users of the r/wallstreetbets subreddit to drive up share prices. Robinhood Securities faced an increase in its collateral requirement from $700 million to $3.7 billion, later reduced to $1.4 billion. The company began once again allowing trading in the affected stocks on January 29.
The decision to halt trading was criticized by customers as well as politicians including Ted Cruz and Alexandria Ocasio-Cortez. The House Committee on Financial Services questioned Robinhood CEO Vladimir Tenev during a hearing on February 18, 2021.
Protests were held outside Robinhood headquarters in Menlo Park, California, at the U.S. Securities and Exchange Commission headquarters in Washington, D.C., and the New York Stock Exchange.
On January 28, 2021, a class-action lawsuit against Robinhood was filed in the Southern District of New York alleging market manipulation and collusion with market maker Citadel Securities to deprive investors of the ability to invest in the open market in violation of Section 1 of the Sherman Antitrust Act, which prohibits agreements in restraint of trade. The case was dismissed by the Miami federal court in November 2021 on the grounds that the plaintiffs fell short of providing direct evidence of an antitrust conspiracy and that its terms of service allowed the company to prohibit trading by customers. In 2024, an appeals court affirmed the dismissal of the case.
2021-2024: Initial public offering
In January 2021, Robinhood raised $3.4 billion in capital during the "meme stock" frenzy which exceeded the total amount of funding raised in the company's history.
In March 2021, Robinhood acquired Binc, a recruiting firm.
In late June 2021, Robinhood was fined $57 million by the Financial Industry Regulatory Authority (FINRA) related to the March 2020 outages and was ordered to pay restitution to affected clients in the largest penalty ever issued by the agency. In 2022, the company agreed to pay $9.9 million to settle class action lawsuits regarding trading losses due to the outages.
The company went public via an initial public offering on the Nasdaq on July 29, 2021 under the ticker HOOD, raising approximately $2.1 billion and valuing Robinhood at about $32 billion. In August 2021, Robinhood completed the $140 million acquisition of Say Technologies, a company that helps shareholders vote proxies and ask questions of management.
In November 2021, a voice phishing scheme on a Robinhood employee resulted in about 5 million customers having their email addresses disclosed, 2 million customers having their full names disclosed and 300 customers having their dates of birth disclosed. It is believed that the person who was responsible for the 2021 FBI email hack and was arrested in March 2023, was responsible for the breach.
In December 2021, Robinhood acquired Cove Markets, a developer of cryptocurrency trading platforms.
In April 2022, Robinhood cut its workforce by 9%. In August that year, the company announced additional layoffs of 23% of its workforce, mostly in operations, marketing and program management.
In August 2022, Robinhood's crypto unit was fined $30 million by the New York State Department of Financial Services for allegedly violating anti-money-laundering and cybersecurity regulations, in the department's first cryptocurrency-related enforcement action.
In November 2022, as part of the bankruptcy of FTX, the U.S. government seized the 7.6% stake in Robinhood owned by Alameda Research, which were used as partial collateral for a transfer of at least $4 billion from FTX. The shares were sold back to Robinhood for $605 million, or $10.96 per share.
In June 2023, Robinhood completed the $95 million acquisition of X1, a credit card issuance startup. Robinhood announced additional layoffs of 150 employees or about 7% of its staff that same month. In December 2023, Robinhood acquired Chartr, a publisher of a daily financial newsletter.
2024-present: Product and international expansion
In March 2024, Robinhood acquired Marex FCM, a broker of futures contracts. Robinhood also expanded its services to the United Kingdom. The following month, Robinhood launched its "Sherwood News" website and a rebrand of its financial newsletter Snacks. In March 2024, the company launched the Robinhood Gold credit card. In July 2024, Robinhood acquired Pluto Capital, an AI-powered investment research platform. In October 2024, Robinhood launched Legend, a desktop trading platform.
In August 2024, Robinhood's crypto unit paid $3.9 million and instituted changes to settle claims by the State of California that, between 2018 and 2022, customers could not make timely withdrawals of cryptocurrency from their Robinhood Crypto accounts to cryptocurrency wallets.
In February 2025, Robinhood completed the $300 million acquisition of TradePMR, a wealth management platform. In March 2025, Robinhood announced the launch of wealth management services, including Robinhood Strategies as well as an AI investment tool, Robinhood Cortex. The following month, the Bank of Lithuania granted the company a brokerage license to operate in Lithuania. Soon after, Robinhood received its MiFID and MICA licenses, allowing Robinhood Europe to operate as a crypto-asset service and payment institution. In May 2025, Robinhood announced that it would acquire WonderFi, a cryptocurrency trading platform based in Canada.
In March 2025, subsidiaries of Robinhood were fined $26 million by the Financial Industry Regulatory Authority for violating numerous rules, which led to the firms’ inability to detect, investigate, or report suspicious activities and were ordered to pay $3.75 million in restitution to certain customers whose market orders were collared and canceled, who then reentered their orders and received executions at prices less favorable than the market prices available at the time the customers initially entered their orders.
In June 2025, the company launched trading in tokenized ETFs and stocks in the European Union. At the time of the launch, the company was operating in 30 countries and had more than 26 million users in total. Robinhood also completed the $200 million acquisition of Bitstamp, a cryptocurrency exchange.
In September 2025, the company introduced Robinhood Social, a social media platform for traders. In November 2025, Robinhood announced a joint venture with Susquehanna International Group to acquire MIAXdx; the acquisition closed in January 2026.
In December 2025, Robinhood announced that it would acquire PT Buana Capital Sekuritas, an Indonesian brokerage, and PT Pedagang Aset Kripto, an Indonesian financial asset trader. In March 2026, Robinhood Ventures Fund I (RVI), a closed-end fund managed by Robinhood Ventures, went public on the New York Stock Exchange. In August 2026 a second closed end fund Robinhood Ventures Fund II (RVII) went public.
Business model
Robinhood operates an electronic trading and investing platform that allows users to trade stocks, exchange-traded funds, options, index options, futures contracts, event contracts tied to prediction markets, and cryptocurrency. In addition to brokerage, the company offers other services such as cryptocurrency wallets, wealth management, checking and saving accounts through a partner bank (deposits are FDIC insured) and credit cards. It does not allow trading in mutual funds, preferred stocks, bonds, some high-risk penny stocks, and new positions in options on their expiration dates in the last 30 minutes of the trading day. Robinhood's platform is available in the United States and United Kingdom. In the European Union, trading only includes cryptocurrency and tokenized stocks and ETFs.
The company has been described as an innovator in zero-commission stock trading. Apart from transaction-based revenue, it also generates income through subscription fees for its Robinhood Gold service and other fees associated with its financial products. Robinhood has expanded the appeal of retail investing to millennials and has been credited with the industry shift away from traditional trading fees. As of March 2025, the average age of its customers was 35.
Structure and financials
Company structure
Robinhood Markets is a financial services company that operates subsidiaries such as Robinhood Financial for brokerage operations, Robinhood Securities for clearing operations, Robinhood Crypto for cryptocurrency trading, Robinhood Money for banking offerings, Robinhood Asset Management for wealth management, Robinhood Derivatives for futures trading, and Sherwood Media, a financial news producer. Outside the United States, its subsidiaries include Robinhood UK and Robinhood Europe.
Financials
The company's revenue comes from payment for order flow, commissions, or other fees on options (24% of Q1 2026 revenues), cryptocurrency (13% of Q1 2026 revenues), equities (8% of Q1 2026 revenues), and other transaction-based products including instant withdrawals, event contracts and futures (14% of Q1 2026 revenues); net interest income from margin lending, interest earned on corporate and customer cash balances, securities lending, and credit cards (34% of Q1 2026 revenues); and other revenues, primarily from subscription fees on its Robinhood Gold product and proxy revenues (5% of Q1 2026 revenues).
Regulation
Robinhood Markets operates through several regulated subsidiaries subject to oversight by U.S. financial authorities. Robinhood Financial and Robinhood Securities are registered with the U.S. Securities and Exchange Commission and are members of the Financial Industry Regulatory Authority. Robinhood Crypto operates within a fragmented regulatory framework in which digital asset platforms are subject to a combination of federal oversight and state-level licensing requirements. Robinhood Derivatives is registered with the Commodity Futures Trading Commission and member of National Futures Association.
स्रोत: विकिपीडिया (अंग्रेज़ी), CC BY-SA 4.0 · विकिपीडिया पर देखें ↗
10-वर्षीय प्रदर्शन राजस्व, शुद्ध आय, मार्जिन और ईपीएस रुझान
मूल्यांकन P/E, P/S, P/B, EV/EBITDA अनुपात — क्या स्टॉक महंगा है या सस्ता?
| मेट्रिक | 5Y रुझान | HOOD | 5Y औसत | सहकर्मी माध्यिका | निर्णय |
|---|---|---|---|---|---|
| P/E (TTM) | 49.95Y औसत ≈9.8 | ≈9.8 | 18.1 | अति मूल्यांकित | |
| P/S (TTM) | 20.65Y औसत ≈9.1 | ≈9.1 | 4.5 | अति मूल्यांकित | |
| P/B (MRQ) | 10.65Y औसत ≈4.5 | ≈4.5 | 3.3 | अति मूल्यांकित | |
| Price / Cash Flow (मूल्य / नकदी प्रवाह) | 62.05Y औसत ≈-29.4 | ≈-29.4 | 35.1 | अति मूल्यांकित | |
| मूल्य / मूर्त पुस्तक (MRQ) | 10.95Y औसत ≈3.8 | ≈3.8 | · | · | |
| PEG Ratio (PEG अनुपात) | ≈0.3 | · | · | · |
सहकर्मी माध्यिका को प्रति मीट्रिक मानकीकृत आधार पर गणना की जाती है और यह हमेशा इस स्टॉक के लिए दिखाए गए TTM/MRQ आधार से मेल नहीं खा सकती है।
लाभप्रदता सकल, परिचालन और शुद्ध मार्जिन; ROE, ROA, ROIC
| मेट्रिक | 5Y रुझान | HOOD | 5Y औसत | सहकर्मी माध्यिका | निर्णय |
|---|---|---|---|---|---|
| EBITDA Margin (EBITDA मार्जिन) | 1.9%5Y औसत ≈2.8% | ≈2.8% | 1.4% | शीर्ष स्तर | |
| प्रीटैक्स मार्जिन (TTM) | 49.0%5Y औसत ≈-44.8% | ≈-44.8% | 27.0% | शीर्ष स्तर | |
| शुद्ध लाभ मार्जिन (TTM) | 42.0%5Y औसत ≈-43.6% | ≈-43.6% | 20.6% | शीर्ष स्तर | |
| ROA (TTM) | 4.5%5Y औसत ≈-3.7% | ≈-3.7% | 2.1% | शीर्ष स्तर | |
| ROE (TTM) | 23.5%5Y औसत ≈-6.5% | ≈-6.5% | 17.1% | शीर्ष स्तर |
वित्तीय स्वास्थ्य ऋण, तरलता, शोधन क्षमता — बैलेंस शीट की मजबूती
| मेट्रिक | 5Y रुझान | HOOD | 5Y औसत | सहकर्मी माध्यिका | निर्णय |
|---|---|---|---|---|---|
| वर्तमान अनुपात (MRQ) | 1.25Y औसत ≈1.4 | ≈1.4 | · | · | |
| Quick Ratio (त्वरित अनुपात) | 0.15Y औसत ≈0.3 | ≈0.3 | · | · |
विकास राजस्व, EPS और शुद्ध आय वृद्धि: YoY, 3Y CAGR, 5Y CAGR
| मेट्रिक | 5Y रुझान | HOOD | 5Y औसत | सहकर्मी माध्यिका | निर्णय |
|---|---|---|---|---|---|
| Revenue YoY (राजस्व YoY) | 51.6%5Y औसत ≈42.3% | ≈42.3% | · | · | |
| Revenue CAGR 3Y (राजस्व CAGR 3Y) | 48.8%5Y औसत ≈30.4% | ≈30.4% | · | · | |
| Revenue CAGR 5Y (राजस्व CAGR 5Y) | 36.1% | · | · | · | |
| EPS YoY | 31.4% | · | · | · | |
| Net Income YoY (शुद्ध आय YoY) | 33.5% | · | · | · | |
| EPS CAGR 5Y | 190.0% | · | · | · | |
| Net Income CAGR 5Y (शुद्ध आय CAGR 5Y) | 206.2% | · | · | · |
पूंजी दक्षता एसेट टर्नओवर, इन्वेंटरी टर्नओवर, प्राप्य टर्नओवर
| मेट्रिक | 5Y रुझान | HOOD | 5Y औसत | सहकर्मी माध्यिका | निर्णय |
|---|---|---|---|---|---|
| Asset Turnover (परिसंपत्ति टर्नओवर) | 0.15Y औसत ≈0.1 | ≈0.1 | 0.1 | अनुरूप | |
| Revenue / Employee (राजस्व / कर्मचारी (रिपोर्ट की गई हेडकाउंट, यफाइनांस)। व्युत्पन्न — संग्रहीत SEC-XBRL अवधारणा नहीं है।) | ≈$1.5M | · | · | · |
मान · ≈ 5Y औसत · उद्योग माध्य · माध्य के सापेक्ष निर्णय
Earnings History EPS वास्तविक बनाम अनुमान, आश्चर्य %, बीट दर, अगली आय तिथि
| Period | रिपोर्ट | EPS Actual | EPS अनुमान | आश्चर्य |
|---|---|---|---|---|
| 30 जून 2026 | जुल 28, 2026 | $0.62 | $0.45 | 37.8% |
| 31 मार्च 2026 | $0.38 | $0.43 | -12.5% | |
| 31 दिसमबर 2025 | $0.66 | $0.64 | 3.2% | |
| 30 सितमबर 2025 | $0.61 | $0.54 | 12.0% | |
| 30 जून 2025 | $0.42 | $0.32 | 31.8% | |
| 31 मार्च 2025 | $0.37 | $0.34 | 8.5% |
पूर्ण मौलिक सभी मेट्रिक्स प्रति वर्ष — आय विवरण, बैलेंस शीट, नकदी प्रवाह
आय विवरण
| मेट्रिक | रुझान | 2025 | 2024 | 2023 | 2022 | 2021 | 2020 | 2019 |
|---|---|---|---|---|---|---|---|---|
| Revenue | $4.47B | $2.95B | $1.86B | $1.36B | $1.81B | $958M | $278M | |
| R&D Expense | $355M | $323M | $349M | $381M | $438M | $52M | $28M | |
| SG&A Expense | $628M | $455M | $1.17B | $924M | $1.37B | $295M | $86M | |
| Operating Expenses | $2.38B | $1.90B | $2.40B | $2.37B | $3.46B | $945M | $384M | |
| Interest Income | · | · | · | $103M | $1M | $2M | · | |
| Other Non-op | $14M | $10M | $3M | $-16M | $1M | $0 | $-657.0K | |
| Pretax Income | $2.11B | $1.06B | $-533M | $-1.03B | $-3.69B | $13M | $-108M | |
| Income Tax | $225M | $-347M | $8M | $1M | $2M | $6M | $-1M | |
| Net Income | $1.88B | $1.41B | $-541M | $-1.03B | $-3.69B | $7M | $-107M | |
| EPS (Basic) | $2.12 | $1.60 | $-0.61 | $-1.17 | $-7.49 | $0.01 | $-0.48 | |
| EPS (Diluted) | $2.05 | $1.56 | $-0.61 | $-1.17 | $-7.49 | $0.01 | $-0.48 | |
| Shares (Basic) | 888,504,958 | 881,113,156 | 890,857,659 | 878,630,024 | 492,381,190 | 225,748,355 | 221,664,610 | |
| Shares (Diluted) | 918,781,846 | 906,171,504 | 890,857,659 | 878,630,024 | 492,381,190 | 244,997,388 | 221,664,610 | |
| EBITDA | $86M | $77M | $71M | $61M | $25M | · | · |
बैलेंस शीट
| मेट्रिक | रुझान | 2025 | 2024 | 2023 | 2022 | 2021 | 2020 | 2019 |
|---|---|---|---|---|---|---|---|---|
| Cash & Equivalents | $4.26B | $4.33B | $4.83B | $6.34B | $6.25B | $1.40B | $644M | |
| Prepaid Expense | $127M | $75M | $63M | $86M | $92M | $29M | · | |
| Other Current Assets | $798M | $584M | $196M | $72M | $57M | $49M | · | |
| Current Assets | $36.30B | $25.10B | $17.08B | $22.92B | $19.28B | $10.87B | · | |
| PP&E (Net) | $154M | $139M | $120M | $146M | $146M | $46M | · | |
| PP&E (Gross) | $368M | $293M | $231M | $227M | $185M | $63M | · | |
| Accum. Depreciation | $214M | $154M | $111M | $81M | $39M | $17M | · | |
| Goodwill | $385M | $179M | $175M | $100M | $101M | $0 | · | |
| Intangibles | $168M | $38M | $48M | $25M | $34M | $185.0K | · | |
| Other Non-current Assets | $697M | $533M | $107M | $132M | $161M | $63M | · | |
| Total Assets | $38.14B | $26.19B | $17.62B | $23.34B | $19.77B | $10.99B | · | |
| Accounts Payable | $463M | $397M | $384M | $185M | $252M | $105M | · | |
| Current Liabilities | $28.77B | $18.10B | $10.84B | $16.25B | $12.35B | $8.82B | · | |
| Capital Leases | $199M | $110M | $89M | $127M | $129M | $48M | · | |
| Other Non-current Liabilities | $215M | $111M | $91M | $128M | $129M | $48M | · | |
| Total Liabilities | $28.99B | $18.21B | $10.93B | $16.38B | $12.48B | $8.86B | · | |
| Common Stock | · | · | · | · | · | $1.0K | · | |
| Paid-in Capital | $11.28B | $12.01B | $12.14B | $11.86B | $11.17B | $134M | · | |
| Retained Earnings | $-2.15B | $-4.04B | $-5.45B | $-4.91B | $-3.88B | $-190M | · | |
| AOCI | $8M | $-1M | $-3M | $0 | $1M | $473.0K | · | |
| Stockholders' Equity | $9.15B | $7.97B | $6.70B | $6.96B | $7.29B | $-55M | $-97M | |
| Liabilities + Equity | $38.14B | $26.19B | $17.62B | $23.34B | $19.77B | $10.99B | · | |
| Shares Outstanding | 901,000,000 | 884,000,000 | 872,162,664 | 892,751,571 | 863,912,613 | 229,031,546 | 224,802,545 |
नकदी प्रवाह
| मेट्रिक | रुझान | 2025 | 2024 | 2023 | 2022 | 2021 | 2020 | 2019 |
|---|---|---|---|---|---|---|---|---|
| D&A | $86M | $77M | $71M | $61M | $26M | $10M | $5M | |
| Stock-based Comp | $305M | $304M | $871M | $654M | $1.57B | $24M | $27M | |
| Deferred Tax | $181M | $-369M | $0 | $0 | $-3M | $-1M | $-665.0K | |
| Amort. of Intangibles | $23M | $20M | $14M | $9M | $3M | $0 | · | |
| Other Non-cash | $-817M | $-1.58B | $780M | $-539M | $1.21B | · | · | |
| Operating Cash Flow | $1.64B | $-157M | $1.18B | $-852M | $-885M | $1.88B | $1.26B | |
| CapEx | · | · | · | $28M | $63M | $24M | $7M | |
| Investing Cash Flow | $141M | $-148M | $-582M | $-60M | $-238M | $-32M | $-12M | |
| Stock Repurchased | $653M | $257M | $608M | $0 | $0 | · | · | |
| Net Stock Activity | $-653M | $-257M | $-608M | · | · | · | · | |
| Financing Cash Flow | $-590M | $-345M | $-610M | $0 | $5.20B | $1.28B | $375M | |
| Net Change in Cash | $1.20B | $-651M | $-11M | $-913M | $4.08B | $3.12B | $1.62B | |
| Taxes Paid | $95M | $18M | $9M | $4M | $6M | $6M | $1M | |
| Free Cash Flow | · | · | · | $-880M | $-948M | · | · |
लाभप्रदता
| मेट्रिक | रुझान | 2025 | 2024 | 2023 | 2022 | 2021 | 2020 | 2019 |
|---|---|---|---|---|---|---|---|---|
| Net Margin | 42.1% | 47.8% | -29.0% | -75.7% | -203.1% | · | · | |
| Pretax Margin | 47.1% | 36.1% | -28.6% | -75.6% | -203.0% | · | · | |
| EBITDA Margin | 1.9% | 2.6% | 3.8% | 4.5% | 1.4% | · | · | |
| ROA | 5.9% | 6.4% | -1.9% | -4.8% | -24.0% | · | · | |
| ROE | 21.9% | 18.6% | -8.2% | -14.8% | -50.2% | · | · |
तरलता और शोधन क्षमता
| मेट्रिक | रुझान | 2025 | 2024 | 2023 | 2022 | 2021 | 2020 | 2019 |
|---|---|---|---|---|---|---|---|---|
| Current Ratio | 1.3 | 1.4 | 1.2 | 1.4 | 1.6 | · | · | |
| Quick Ratio | 0.1 | 0.2 | 0.2 | 0.4 | 0.5 | · | · |
दक्षता
| मेट्रिक | रुझान | 2025 | 2024 | 2023 | 2022 | 2021 | 2020 | 2019 |
|---|---|---|---|---|---|---|---|---|
| Asset Turnover | 0.1 | 0.1 | 0.1 | 0.1 | 0.1 | · | · |
प्रति शेयर
| मेट्रिक | रुझान | 2025 | 2024 | 2023 | 2022 | 2021 | 2020 | 2019 |
|---|---|---|---|---|---|---|---|---|
| Book Value / Share | $10.15 | $9.01 | $7.68 | $7.79 | · | · | · | |
| Revenue / Share | $4.87 | $3.26 | $2.09 | $1.55 | $3.69 | · | · | |
| Cash Flow / Share | $1.78 | $-0.17 | $1.33 | $-0.97 | $-1.80 | · | · | |
| Cash / Share | $4.73 | $4.90 | $5.54 | $7.10 | · | · | · | |
| EPS (TTM) | $2.05 | $1.56 | $-0.61 | $-1.17 | $-7.49 | · | · |
विकास दरें
| मेट्रिक | रुझान | 2025 | 2024 | 2023 | 2022 | 2021 | 2020 | 2019 |
|---|---|---|---|---|---|---|---|---|
| Revenue YoY | 51.6% | 58.2% | 37.3% | -25.2% | 89.5% | · | · | |
| Revenue CAGR 3Y | 48.8% | 17.6% | 24.9% | · | · | · | · | |
| Revenue CAGR 5Y | 36.1% | · | · | · | · | · | · | |
| EPS YoY | 31.4% | · | · | · | · | · | · | |
| EPS CAGR 5Y | 190.0% | · | · | · | · | · | · | |
| Net Income YoY | 33.5% | · | · | · | · | · | · | |
| Net Income CAGR 5Y | 206.2% | · | · | · | · | · | · |
मूल्यांकन (TTM)
| मेट्रिक | रुझान | 2025 | 2024 | 2023 | 2022 | 2021 | 2020 | 2019 |
|---|---|---|---|---|---|---|---|---|
| Revenue TTM | $4.47B | $2.95B | $1.86B | $1.36B | $1.81B | · | · | |
| Net Income TTM | $1.88B | $1.41B | $-541M | $-1.03B | $-3.69B | · | · | |
| Market Cap | $101.94B | $32.96B | $11.11B | $7.27B | $0 | · | · | |
| P/E | 55.2 | 23.9 | -20.9 | -7.0 | -2.4 | · | · | |
| P/S | 22.8 | 11.2 | 6.0 | 5.4 | 0.0 | · | · | |
| P/B | 11.1 | 4.1 | 1.7 | 1.0 | · | · | · | |
| P / Tangible Book | 11.9 | 4.2 | 1.7 | 1.1 | 0.0 | · | · | |
| P / Cash Flow | 62.2 | -209.9 | 9.4 | -8.5 | 0.0 | · | · | |
| P / FCF | · | · | · | -8.3 | 0.0 | · | · | |
| Earnings Yield | 1.8% | 4.2% | -4.8% | -14.4% | -42.2% | · | · |
आय विवरण
| मेट्रिक | रुझान | Q2 2026 | Q1 2026 | Q4 2025 | Q3 2025 | Q2 2025 | Q1 2025 | Q4 2024 | Q3 2024 | Q2 2024 | Q1 2024 | Q4 2023 | Q3 2023 | Q2 2023 | Q1 2023 | Q4 2022 | Q3 2022 |
|---|---|---|---|---|---|---|---|---|---|---|---|---|---|---|---|---|---|
| Revenue | $1.31B | $1.07B | $1.28B | $1.27B | $989M | $927M | $1.01B | $637M | $682M | $618M | $471M | $467M | $486M | $441M | $380M | $361M | |
| SG&A Expense | $199M | $174M | $178M | $185M | $132M | $133M | $70M | $133M | $134M | $118M | $133M | $230M | $159M | $647M | $197M | $233M | |
| Operating Expenses | $734M | $656M | $633M | $639M | $550M | $557M | $458M | $486M | $493M | $460M | $445M | $540M | $466M | $950M | $534M | $535M | |
| Interest Income | · | · | · | · | · | · | · | · | · | · | · | · | $74M | $68M | · | $29M | |
| Other Non-op | $135M | $0 | $11M | $-1M | $3M | $1M | $2M | $2M | $2M | $4M | $3M | $-2M | $2M | $0 | $-14M | $0 | |
| Pretax Income | $709M | $411M | $661M | $634M | $442M | $371M | $558M | $153M | $191M | $162M | $29M | $-75M | $22M | $-509M | $-168M | $-174M | |
| Income Tax | $136M | $65M | $56M | $78M | $56M | $35M | $-358M | $3M | $3M | $5M | $-1M | $10M | $-3M | $2M | $-2M | $1M | |
| Net Income | $561M | $350M | $605M | $556M | $386M | $336M | $916M | $150M | $188M | $157M | $30M | $-85M | $25M | $-511M | $-166M | $-175M | |
| EPS (Basic) | $0.62 | $0.39 | $0.67 | $0.63 | $0.44 | $0.38 | $1.04 | $0.17 | $0.21 | $0.18 | $0.02 | $-0.09 | $0.03 | $-0.57 | $-0.18 | $-0.20 | |
| EPS (Diluted) | $0.62 | $0.38 | $0.65 | $0.61 | $0.42 | $0.37 | $1.00 | $0.17 | $0.21 | $0.18 | $0.02 | $-0.09 | $0.03 | $-0.57 | $-0.18 | $-0.20 | |
| Shares (Basic) | 899,000,000 | 899,154,939 | · | 889,261,220 | 882,000,000 | 884,577,603 | · | 884,108,545 | 881,076,624 | 875,319,407 | · | 895,108,790 | 904,984,863 | 896,924,695 | · | 882,356,575 | |
| Shares (Diluted) | 912,000,000 | 915,038,823 | · | 917,940,660 | 909,000,000 | 909,241,619 | · | 905,544,750 | 904,490,572 | 895,779,155 | · | 895,108,790 | 921,269,749 | 896,924,695 | · | 882,356,575 | |
| EBITDA | · | $23M | · | · | · | $20M | · | · | · | $17M | · | · | · | $20M | · | · |
बैलेंस शीट
| मेट्रिक | रुझान | Q2 2026 | Q1 2026 | Q4 2025 | Q3 2025 | Q2 2025 | Q1 2025 | Q4 2024 | Q3 2024 | Q2 2024 | Q1 2024 | Q4 2023 | Q3 2023 | Q2 2023 | Q1 2023 | Q4 2022 | Q3 2022 |
|---|---|---|---|---|---|---|---|---|---|---|---|---|---|---|---|---|---|
| Cash & Equivalents | $5.36B | $5.01B | $4.26B | $4.33B | $4.16B | $4.42B | $4.33B | $4.61B | $4.52B | $4.72B | $4.83B | $4.89B | $5.83B | $5.46B | $6.34B | $6.19B | |
| Prepaid Expense | $196M | $182M | $127M | $128M | $108M | $89M | $75M | $86M | $65M | $64M | · | $75M | $88M | $90M | · | $80M | |
| Other Current Assets | $1.42B | $853M | $798M | $326M | $345M | $243M | $584M | $251M | $352M | $348M | · | $130M | $123M | $75M | · | $41M | |
| Current Assets | $54.53B | $43.41B | $36.30B | $39.98B | $33.83B | $26.21B | $25.10B | $42.60B | $40.71B | $45.55B | · | $25.74B | $28.11B | $27.19B | · | $24.14B | |
| PP&E (Net) | $177M | $162M | $154M | $150M | $149M | $140M | $139M | $133M | $123M | $122M | · | $123M | $131M | $137M | · | $151M | |
| PP&E (Gross) | · | · | $368M | · | · | · | $293M | · | · | · | · | · | · | · | · | · | |
| Accum. Depreciation | · | · | $214M | · | · | · | $154M | · | · | · | · | · | · | · | · | · | |
| Goodwill | $516M | $401M | $385M | $386M | $383M | $292M | $179M | $179M | $179M | $175M | $175M | $164M | $100M | $100M | $100M | $100M | |
| Intangibles | $246M | $203M | $168M | $172M | $191M | $109M | $38M | $39M | $45M | $46M | · | $53M | $21M | $23M | · | $27M | |
| Other Non-current Assets | $500M | $773M | $697M | $405M | $501M | $523M | $533M | $130M | $132M | $190M | · | $118M | $131M | $131M | · | $29M | |
| Total Assets | $56.55B | $45.47B | $38.14B | $41.45B | $35.32B | $27.52B | $26.19B | $43.24B | $41.35B | $46.09B | · | $26.32B | $28.66B | $27.79B | · | $24.60B | |
| Accounts Payable | $646M | $522M | $463M | $399M | $369M | $319M | $397M | $443M | $386M | $351M | · | $373M | $236M | $203M | · | $203M | |
| Current Liabilities | $44.58B | $35.55B | $28.77B | $32.76B | $27.12B | $19.43B | $18.10B | $35.96B | $34.14B | $39.11B | · | $19.65B | $21.36B | $20.62B | · | $17.51B | |
| Capital Leases | $199M | $202M | $199M | $108M | $112M | $113M | $110M | $78M | $84M | $89M | · | $95M | $116M | $120M | · | $138M | |
| Other Non-current Liabilities | $263M | $232M | $215M | $123M | $130M | $133M | $111M | $79M | $84M | $90M | · | $96M | $117M | $122M | · | · | |
| Total Liabilities | $47.01B | $35.79B | $28.99B | $32.88B | $27.25B | $19.56B | $18.21B | $36.04B | $34.22B | $39.20B | · | $19.74B | $21.47B | $20.74B | · | $17.65B | |
| Paid-in Capital | $10.73B | $11.12B | $11.28B | $11.32B | $11.38B | $11.65B | $12.01B | $12.16B | $12.22B | $12.18B | · | $12.05B | $12.58B | $12.46B | · | $11.69B | |
| Retained Earnings | $-1.24B | $-1.80B | $-2.15B | $-2.76B | $-3.31B | $-3.70B | $-4.04B | $-4.95B | $-5.10B | $-5.29B | · | $-5.48B | $-5.39B | $-5.42B | · | $-4.74B | |
| AOCI | $-10M | $2M | $8M | $7M | $7M | $0 | $-1M | $1M | $0 | $-2M | · | $-4M | $-3M | · | · | $-1M | |
| Stockholders' Equity | $9.54B | $9.69B | $9.15B | $8.57B | $8.07B | $7.95B | $7.97B | $7.21B | $7.12B | $6.88B | $6.70B | $6.57B | $7.19B | $7.05B | $6.96B | $6.95B | |
| Liabilities + Equity | $56.55B | $45.47B | $38.14B | $41.45B | $35.32B | $27.52B | $26.19B | $43.24B | $41.35B | $46.09B | · | $26.32B | $28.66B | $27.79B | · | $24.60B | |
| Shares Outstanding | 899,000,000 | 901,218,559 | 901,328,432 | 898,668,362 | 888,217,555 | 884,574,785 | 884,492,983 | 883,609,008 | 884,545,769 | 878,360,256 | 872,162,664 | 862,558,666 | 909,694,702 | 900,241,522 | 892,751,571 | 884,713,789 |
नकदी प्रवाह
| मेट्रिक | रुझान | Q2 2026 | Q1 2026 | Q4 2025 | Q3 2025 | Q2 2025 | Q1 2025 | Q4 2024 | Q3 2024 | Q2 2024 | Q1 2024 | Q4 2023 | Q3 2023 | Q2 2023 | Q1 2023 | Q4 2022 | Q3 2022 |
|---|---|---|---|---|---|---|---|---|---|---|---|---|---|---|---|---|---|
| D&A | $23M | $23M | $23M | $22M | $21M | $20M | $22M | $20M | $18M | $17M | $17M | $19M | $15M | $20M | $17M | $15M | |
| Stock-based Comp | $105M | $92M | $76M | $78M | $78M | $73M | $77M | $79M | $86M | $62M | $81M | $83M | $109M | $598M | $160M | $110M | |
| Deferred Tax | $-32M | $34M | · | · | $0 | $0 | · | · | · | · | · | · | · | · | · | · | |
| Amort. of Intangibles | $7M | $7M | $8M | $6M | $5M | $4M | · | · | · | · | $5M | $5M | · | · | · | · | |
| Other Non-cash | · | $1.54B | · | · | · | $213M | · | · | · | $-859M | · | · | · | $721M | · | · | |
| Operating Cash Flow | $720M | $2.04B | $-937M | $-1.58B | $3.51B | $642M | $-1.40B | $1.81B | $54M | $-623M | $960M | $-977M | $370M | $828M | $181M | $-207M | |
| CapEx | · | · | · | · | · | · | · | · | · | · | · | $1M | $0 | $0 | · | $6M | |
| Investing Cash Flow | $-770M | $-284M | $-558M | $-142M | $832M | $9M | $34M | $-123M | $-12M | $-47M | $-3M | $-97M | $-1M | $-481M | $11M | $-11M | |
| Stock Repurchased | $414M | $250M | $100M | $107M | $124M | $322M | $160M | $97M | $0 | $0 | $0 | · | · | · | $0 | · | |
| Net Stock Activity | · | $-250M | · | · | · | $-322M | · | · | · | · | · | · | · | · | · | · | |
| Financing Cash Flow | $1.91B | $180M | $118M | $-5M | $-286M | $-417M | $-178M | $-95M | $-42M | $-30M | $9M | $-615M | $7M | $-11M | $0 | $-1M | |
| Net Change in Cash | $1.85B | $1.93B | $-1.38B | $-1.72B | $4.06B | $235M | $-1.55B | $1.59B | $0 | $-700M | $966M | $-1.69B | $376M | $336M | $193M | $-221M | |
| Taxes Paid | $101M | $70M | $12M | $1M | $53M | $29M | $4M | $8M | $4M | $2M | $0 | $7M | $2M | $0 | $0 | $1M | |
| Free Cash Flow | · | · | · | · | · | · | · | · | · | · | · | · | · | $828M | · | · |
लाभप्रदता
| मेट्रिक | रुझान | Q2 2026 | Q1 2026 | Q4 2025 | Q3 2025 | Q2 2025 | Q1 2025 | Q4 2024 | Q3 2024 | Q2 2024 | Q1 2024 | Q4 2023 | Q3 2023 | Q2 2023 | Q1 2023 | Q4 2022 | Q3 2022 |
|---|---|---|---|---|---|---|---|---|---|---|---|---|---|---|---|---|---|
| Net Margin | 42.9% | 32.8% | · | 43.6% | 39.0% | 36.2% | · | 23.5% | 27.6% | 25.4% | · | -18.2% | 5.1% | -115.9% | · | -48.5% | |
| Pretax Margin | 54.2% | 38.5% | · | 49.8% | 44.7% | 40.0% | · | 24.0% | 28.0% | 26.2% | · | -16.1% | 4.5% | -115.4% | · | -48.2% | |
| EBITDA Margin | · | 2.2% | · | · | · | 2.2% | · | · | · | 2.8% | · | · | · | 4.5% | · | · | |
| ROA | 1.2% | 0.96% | · | 1.3% | 1.0% | 0.91% | · | 0.43% | 0.54% | 0.43% | · | -0.33% | 0.09% | -2.2% | · | -0.80% | |
| ROE | 6.4% | 4.0% | · | 7.0% | 5.1% | 4.5% | · | 2.2% | 2.6% | 2.2% | · | -1.3% | 0.35% | -7.2% | · | -2.4% |
तरलता और शोधन क्षमता
| मेट्रिक | रुझान | Q2 2026 | Q1 2026 | Q4 2025 | Q3 2025 | Q2 2025 | Q1 2025 | Q4 2024 | Q3 2024 | Q2 2024 | Q1 2024 | Q4 2023 | Q3 2023 | Q2 2023 | Q1 2023 | Q4 2022 | Q3 2022 |
|---|---|---|---|---|---|---|---|---|---|---|---|---|---|---|---|---|---|
| Current Ratio | 1.2 | 1.2 | · | 1.2 | 1.2 | 1.3 | · | 1.2 | 1.2 | 1.2 | · | 1.3 | 1.3 | 1.3 | · | 1.4 | |
| Quick Ratio | 0.1 | 0.1 | · | 0.1 | 0.2 | 0.2 | · | 0.1 | 0.1 | 0.1 | · | 0.2 | 0.3 | 0.3 | · | 0.4 |
दक्षता
| मेट्रिक | रुझान | Q2 2026 | Q1 2026 | Q4 2025 | Q3 2025 | Q2 2025 | Q1 2025 | Q4 2024 | Q3 2024 | Q2 2024 | Q1 2024 | Q4 2023 | Q3 2023 | Q2 2023 | Q1 2023 | Q4 2022 | Q3 2022 |
|---|---|---|---|---|---|---|---|---|---|---|---|---|---|---|---|---|---|
| Asset Turnover | 0.0 | 0.0 | · | 0.0 | 0.0 | 0.0 | · | 0.0 | 0.0 | 0.0 | · | 0.0 | 0.0 | 0.0 | · | 0.0 |
प्रति शेयर
| मेट्रिक | रुझान | Q2 2026 | Q1 2026 | Q4 2025 | Q3 2025 | Q2 2025 | Q1 2025 | Q4 2024 | Q3 2024 | Q2 2024 | Q1 2024 | Q4 2023 | Q3 2023 | Q2 2023 | Q1 2023 | Q4 2022 | Q3 2022 |
|---|---|---|---|---|---|---|---|---|---|---|---|---|---|---|---|---|---|
| Book Value / Share | $10.61 | $10.75 | · | $9.53 | $9.09 | $8.99 | · | $8.16 | $8.05 | $7.84 | · | $7.62 | $7.90 | $7.83 | · | $7.86 | |
| Revenue / Share | $1.43 | $1.17 | · | $1.39 | $1.09 | $1.02 | · | $0.70 | $0.75 | $0.69 | · | $0.52 | $0.53 | $0.49 | · | $0.41 | |
| Cash Flow / Share | · | $2.23 | · | · | · | $0.71 | · | · | · | $-0.70 | · | · | · | $0.92 | · | · | |
| Cash / Share | $5.96 | $5.56 | · | $4.82 | $4.69 | $4.99 | · | $5.22 | $5.11 | $5.37 | · | $5.67 | $6.41 | $6.06 | · | $6.99 | |
| EPS (TTM) | $2.26 | $2.06 | · | $2.40 | $1.96 | $1.75 | · | $0.58 | $0.32 | $0.14 | · | $-0.81 | $-0.92 | $-1.29 | · | $2.00 |
मूल्यांकन (TTM)
| मेट्रिक | रुझान | Q2 2026 | Q1 2026 | Q4 2025 | Q3 2025 | Q2 2025 | Q1 2025 | Q4 2024 | Q3 2024 | Q2 2024 | Q1 2024 | Q4 2023 | Q3 2023 | Q2 2023 | Q1 2023 | Q4 2022 | Q3 2022 |
|---|---|---|---|---|---|---|---|---|---|---|---|---|---|---|---|---|---|
| Revenue TTM | $4.93B | $4.61B | · | $4.20B | $3.57B | $3.26B | · | $2.41B | $2.24B | $2.04B | · | $1.77B | $1.67B | $1.50B | · | $1.34B | |
| Net Income TTM | $2.07B | $1.90B | · | $2.19B | $1.79B | $1.59B | · | $525M | $290M | $127M | · | $-737M | $-827M | $-1.15B | · | $-1.28B | |
| Market Cap | $90.15B | $62.45B | · | $128.67B | $83.16B | $36.82B | · | $20.69B | $20.09B | $17.68B | · | $8.46B | $9.08B | $8.74B | · | $8.94B | |
| P/E | 44.4 | 33.6 | · | 59.7 | 47.8 | 23.8 | · | 40.4 | 71.0 | 143.8 | · | -12.1 | -10.8 | -7.5 | · | 5.0 | |
| P/S | 18.3 | 13.5 | · | 30.6 | 23.3 | 11.3 | · | 8.6 | 9.0 | 8.7 | · | 4.8 | 5.4 | 5.8 | · | 6.7 | |
| P/B | 9.4 | 6.4 | · | 15.0 | 10.3 | 4.6 | · | 2.9 | 2.8 | 2.6 | · | 1.3 | 1.3 | 1.2 | · | 1.3 | |
| P / Tangible Book | 10.3 | 6.9 | · | 16.1 | 11.1 | 4.9 | · | 3.0 | 2.9 | 2.7 | · | 1.3 | 1.3 | 1.3 | · | 1.3 | |
| P / Cash Flow | · | 30.6 | · | · | · | 57.3 | · | · | · | -28.4 | · | · | · | 10.6 | · | · | |
| Earnings Yield | 2.2% | 3.0% | · | 1.7% | 2.1% | 4.2% | · | 2.5% | 1.4% | 0.70% | · | -8.3% | -9.2% | -13.3% | · | 19.8% |
सबसे हाल की अवधि बाईं ओर · शून्य मान इस प्रकार दिखाए गए हैं ·
वित्तीय विवरण आय विवरण, बैलेंस शीट, नकदी प्रवाह — वार्षिक, पिछले 5 वर्ष
| मेट्रिक | 2025-12-31 | 2024-12-31 | 2023-12-31 | 2022-12-31 | 2021-12-31 |
|---|---|---|---|---|---|
| राजस्व | $4.47B | $2.95B | $1.86B | $1.36B | $1.81B |
| शुद्ध आय | $1.88B | $1.41B | $-541M | $-1.03B | $-3.69B |
| तनुकरणित EPS | $2.05 | $1.56 | $-0.61 | $-1.17 | $-7.49 |
| मेट्रिक | 2025-12-31 | 2024-12-31 | 2023-12-31 | 2022-12-31 | 2021-12-31 |
|---|---|---|---|---|---|
| वर्तमान अनुपात | 1.3 | 1.4 | 1.2 | 1.4 | 1.6 |
| त्वरित अनुपात | 0.1 | 0.2 | 0.2 | 0.4 | 0.5 |
| मेट्रिक | 2025-12-31 | 2024-12-31 | 2023-12-31 | 2022-12-31 | 2021-12-31 |
|---|---|---|---|---|---|
| फ्री कैश फ्लो | · | · | · | $-880M | $-948M |
संस्थागत मालिक (13F) 1594 फाइलर्स · $83.3B कुल · तिथि अनुसार 30 सितमबर 2026
संस्थान जो अपनी तिमाही SEC फॉर्म 13F में इस स्टॉक को होल्ड करने की रिपोर्ट करते हैं। केवल लॉन्ग पोजीशन; एक ही फाइलर अलग-अलग ऑप्शन लेग्स के लिए दो बार दिखाई दे सकता है। बड़े ऑफसेटिंग पुट/कॉल लेग्स आमतौर पर मार्केट-मेकिंग या हेज्ड इन्वेंट्री को दर्शाते हैं, न कि दिशात्मक विश्वास को।
| नई स्थितियाँ | बाहर निकली पोजीशन | बढ़ाया | घटा हुआ | शुद्ध शेयर परिवर्तन |
|---|---|---|---|---|
| 297 (+39 पिछली तिमाही की तुलना में) | 132 (-176 पिछली तिमाही की तुलना में) | 596 (+61 पिछली तिमाही की तुलना में) | 442 (-22 पिछली तिमाही की तुलना में) | +62.9M |
Q1 2026 की तुलना में। SEC फॉर्म 13F फाइलिंग तिमाही के अंत के 45 दिनों के भीतर देय होती है, साथ ही देर से फाइल करने वालों के लिए एक छोटा बफर भी होता है — उस विंडो के भीतर आने वाली तिमाहियों को सबसे हालिया पूरी तरह से रिपोर्ट की गई जोड़ी के पक्ष में छोड़ दिया जाता है।
| संस्था | मूल्य | शेयर | % ट्रैक किए गए 13F का | प्रकार |
|---|---|---|---|---|
| VANGUARD GROUP INC | $10831756312 | 95771497 | 13.00% | शेयर |
| BlackRock, Inc. | $6797686961 | 67787066 | 8.16% | शेयर |
| VANGUARD CAPITAL MANAGEMENT LLC | $5180013339 | 51655498 | 6.22% | शेयर |
| VANGUARD PORTFOLIO MANAGEMENT LLC | $3741830873 | 37313830 | 4.49% | शेयर |
| STATE STREET CORP | $3476822721 | 34671148 | 4.17% | शेयर |
| FMR LLC | $2999144159 | 29907700 | 3.60% | शेयर |
| Newlands Management Operations LLC | $2422650481 | 24158860 | 2.91% | शेयर |
| GEODE CAPITAL MANAGEMENT, LLC | $2286882680 | 22597737 | 2.74% | शेयर |
| SUSQUEHANNA INTERNATIONAL GROUP, LLP | $2122005024 | 21160800 | 2.55% | कॉल ऑप्शन |
| JPMORGAN CHASE & CO | $1609321182 | 15803996 | 1.93% | शेयर |
| CITADEL ADVISORS LLC | $1432569996 | 14285700 | 1.72% | कॉल ऑप्शन |
| JANE STREET GROUP, LLC | $1409024252 | 14050900 | 1.69% | कॉल ऑप्शन |
| SUSQUEHANNA INTERNATIONAL GROUP, LLP | $1324748940 | 13210500 | 1.59% | पुट ऑप्शन |
| JANE STREET GROUP, LLC | $1277607312 | 12740400 | 1.53% | पुट ऑप्शन |
| CITADEL ADVISORS LLC | $1246731100 | 12432500 | 1.50% | पुट ऑप्शन |
| NORGES BANK | $1143949415 | 11407553 | 1.37% | शेयर |
| Index Venture Associates VI Ltd | $1015588508 | 10127528 | 1.22% | शेयर |
| MORGAN STANLEY | $1013373486 | 10105436 | 1.22% | शेयर |
| BANK OF AMERICA CORP /DE/ | $665865631 | 6640064 | 0.80% | शेयर |
| GOLDMAN SACHS GROUP INC | $659828731 | 6579864 | 0.79% | शेयर |
| Sumitomo Mitsui Trust Group, Inc. | $658744635 | 6569053 | 0.79% | शेयर |
| NORTHERN TRUST CORP | $648909071 | 6470972 | 0.78% | शेयर |
| CHARLES SCHWAB INVESTMENT MANAGEMENT INC | $631998856 | 6302342 | 0.76% | शेयर |
| Invesco Ltd. | $553266058 | 5517212 | 0.66% | शेयर |
| ARK Investment Management LLC | $525069168 | 5236031 | 0.63% | शेयर |
| Capital International Investors | $513144693 | 5117119 | 0.62% | शेयर |
| Amova Asset Management Americas, Inc. | $487099427 | 4857878 | 0.58% | शेयर |
| Jericho Capital Asset Management L.P. | $484653240 | 4833000 | 0.58% | शेयर |
| Paradigm Operations LP | $474787292 | 4734616 | 0.57% | शेयर |
| VANGUARD FIDUCIARY TRUST CO | $453671333 | 4524046 | 0.54% | शेयर |
| DZ BANK AG Deutsche Zentral Genossenschafts Bank, Frankfurt am Main | $434065379 | 4328534 | 0.52% | शेयर |
| Legal & General Group Plc | $425246974 | 4240596 | 0.51% | शेयर |
| WOLVERINE TRADING, LLC | $424884744 | 3107700 | 0.51% | कॉल ऑप्शन |
| Amundi | $396110813 | 3950048 | 0.48% | शेयर |
| Ribbit Management Company, LLC | $393739492 | 3926401 | 0.47% | शेयर |
| Bank of New York Mellon Corp | $379695446 | 3786353 | 0.46% | शेयर |
| UBS Group AG | $348538884 | 3475657 | 0.42% | शेयर |
| MARSHALL WACE, LLP | $343927216 | 3429659 | 0.41% | शेयर |
| Toroso Investments, LLC | $340498860 | 3010600 | 0.41% | कॉल ऑप्शन |
| BARCLAYS PLC | $317393821 | 3165076 | 0.38% | शेयर |
| MASSACHUSETTS FINANCIAL SERVICES CO /MA/ | $315857154 | 3150026 | 0.38% | शेयर |
| NEUBERGER BERMAN GROUP LLC | $288887552 | 2880809 | 0.35% | शेयर |
| Artisan Partners Limited Partnership | $288817746 | 2880113 | 0.35% | शेयर |
| WCM INVESTMENT MANAGEMENT, LLC | $283541765 | 2784462 | 0.34% | शेयर |
| AMERICAN CENTURY COMPANIES INC | $283323228 | 2825315 | 0.34% | शेयर |
| DIMENSIONAL FUND ADVISORS LP | $279832692 | 2789915 | 0.34% | शेयर |
| UBS AM, a distinct business unit of UBS ASSET MANAGEMENT AMERICAS LLC | $273854681 | 3951727 | 0.33% | शेयर |
| D. E. Shaw & Co., Inc. | $272811740 | 2720500 | 0.33% | पुट ऑप्शन |
| D. E. Shaw & Co., Inc. | $263806596 | 2630700 | 0.32% | कॉल ऑप्शन |
| FRANKLIN RESOURCES INC | $260789617 | 2600614 | 0.31% | शेयर |
कार्यकर्ता और 5%+ मालिक 3 होल्डिंग्स
जिन निवेशकों ने SEC शेड्यूल 13D दाखिल किया है — जारीकर्ता को प्रभावित करने के इरादे से 5% से अधिक लाभकारी स्वामित्व (कार्यकर्ता दांव, बोर्ड अभियान, M&A)। प्रत्येक पंक्ति उस फाइलर की स्थिति की सबसे हालिया ज्ञात स्थिति दिखाती है।
| फाइलर | दाखिल किया | दांव | स्थिति | उद्देश्य | फाइलिंग |
|---|---|---|---|---|---|
| Emergent Fidelity Technologies Ltd., Samuel Benjamin Bankman-Fried | 12 मई 2022 | · | प्रारंभिक फाइलिंग | निष्क्रिय निवेश | SEC |
| 5 मई 2022 | · | प्रारंभिक फाइलिंग | · | SEC | |
| New Enterprise Associates 17, L.P., NEA Partners 17, L.P., NEA 17 GP, LLC, New Enterprise Associates 15, L.P., NEA Partners 15, L.P., NEA 15 GP, LLC, Forest Baskett, Anthony A. Florence, Jr., Mohamad H. Makhzoumi, Scott D. Sandell, Peter W. Sonsini ×2 फाइलिंग | 9 फ़रवरी 2022 | · | प्रारंभिक फाइलिंग | निष्क्रिय निवेश | SEC |
Purpose is an automated classification of the filer's own stated purpose (SEC Item 4) — not investment advice. "—" means no clear purpose was stated or the text could not be classified.
कंपनी के अंदरूनी सूत्र 27 इनसाइडर्स · 9 अधिकारी · 17 निदेशक
| अंदरूनी | भूमिका | अंतिम गतिविधि | शेयरों का स्वामित्व | खरीद 12m | बिक्री 12m | नेट 12m |
|---|---|---|---|---|---|---|
| Vladimir Tenev | Chief Executive Officer | 22 सितमबर 2026 C | 0 | 0 | 19 | $-178089080 |
| Shiv Verma | Chief Financial Officer | 15 सितमबर 2026 S | 56858 | 0 | 25 | $-4202299 |
| Gretchen Howard | Chief Operating Officer | 1 अप्रैल 2023 M | 703057 | 0 | 0 | $0 |
| Daniel Martin Gallagher Jr | Chief Legal Officer | 3 सितमबर 2026 S | 509943 | 0 | 78 | $-38844142 |
| Steven M. Quirk | Chief Brokerage Officer | 3 सितमबर 2026 S | 77839 | 0 | 37 | $-24880501 |
| Dara Bazzano | Chief Accounting Officer | 1 सितमबर 2026 M | 4473 | 0 | 0 | $0 |
| Jeffrey Tsvi Pinner | Chief Technology Officer | 27 अप्रैल 2026 S | 12171 | 0 | 43 | $-6346706 |
| Aparna Chennapragada | Chief Product Officer | 1 जुलाई 2022 M | 265336 | 0 | 0 | $0 |
| Christina Smedley | Chief Marketing Officer | 28 जुलाई 2021 M | 0 | 0 | 0 | $0 |
| Baiju Bhatt | निदेशक | 1 अक्टूबर 2026 M | 4636 | 0 | 55 | $-314594939 |
| Paula Loop | निदेशक | 1 अक्टूबर 2026 M | 64496 | 0 | 1 | $-1000320 |
| Oluwadara Johnson Treseder | निदेशक | 1 अक्टूबर 2026 M | 71389 | 0 | 3 | $-675000 |
| Robert B. Zoellick | निदेशक | 1 अक्टूबर 2026 M | 102872 | 0 | 0 | $0 |
| Malka Meyer | निदेशक | 1 अक्टूबर 2026 M | 2940 | 3 | 3 | $-66628434 |
| Jonathan Rubinstein | निदेशक | 1 अक्टूबर 2026 M | 1155 | 0 | 4 | $-5611817 |
| John William Hegeman | निदेशक | 30 सितमबर 2026 A | 144 | 0 | 0 | $0 |
| Christopher D Payne | निदेशक | 30 सितमबर 2026 A | 221 | 0 | 0 | $0 |
| Susan Segal | निदेशक | 30 सितमबर 2026 A | 216 | 0 | 0 | $0 |
| Frances X Frei | निदेशक | 25 जून 2024 M | 90440 | 0 | 0 | $0 |
| Scott D. Sandell | निदेशक | 12 मई 2022 S | 0 | 0 | 0 | $0 |
| Mohamad Makhzoumi | निदेशक | 3 मई 2022 S | 0 | 0 | 0 | $0 |
| Anthony A. Florence, Jr. | निदेशक | 3 मई 2022 S | 0 | 0 | 0 | $0 |
| Peter W. Sonsini | निदेशक | 2 मई 2022 J | 270 | 0 | 0 | $0 |
| Forest Baskett | निदेशक | 2 मई 2022 J | 36688 | 0 | 0 | $0 |
| Jan Hammer | निदेशक | 2 अगस्त 2021 C | 1874816 | 0 | 0 | $0 |
| Robinhood Markets, Inc. | 10% मालिक | 31 अगस्त 2026 S | 12984209 | 0 | 71 | $-11063960 |
| Jason Warnick | · | 9 फ़रवरी 2026 S | 402370 | 0 | 5 | $-50477969 |
SEC फॉर्म 3/4/5 फाइलिंग से अंदरूनी सूत्र; नेट = केवल ओपन-मार्केट P/S
ईटीएफ स्वामित्व 127 ETFs द्वारा धारित
वजन केवल प्रत्यक्ष इक्विटी होल्डिंग्स (N-PORT) को दर्शाता है; लीवरेज्ड या डेरिवेटिव-आधारित फंड में अतिरिक्त स्वैप एक्सपोजर हो सकता है जो नहीं दिखाया गया है।
| फंड | भार | इकाइयाँ | तिथि अनुसार | स्रोत |
|---|---|---|---|---|
| ARKF · ARK ETF Trust | 5.36% | 433692 NS | 31 जुलाई 2026 | N-PORT |
| ARKW · ARK ETF Trust | 4.56% | 846608 NS | 31 जुलाई 2026 | N-PORT |
| ULTY · Tidal Trust II | 4.31% | 369100 NS | 31 जुलाई 2026 | N-PORT |
| CEPI · ETF Opportunities Trust | 3.98% | 50678 NS | 31 जुलाई 2026 | N-PORT |
| ARKK · ARK ETF Trust | 3.64% | 2336206 NS | 31 जुलाई 2026 | N-PORT |
| DECO · SSGA Active Trust | 3.25% | 7704 NS | 31 जुलाई 2026 | N-PORT |
| HECO · SSGA Active Trust | 3.24% | 30703 NS | 31 जुलाई 2026 | N-PORT |
| GIAX · Tidal Trust II | 2.77% | 32642 NS | 31 जुलाई 2026 | N-PORT |
| TEKX · SSGA Active Trust | 2.76% | 5078 NS | 31 जुलाई 2026 | N-PORT |
| BLOX · Tidal Trust II | 2.33% | 76521 NS | 31 जुलाई 2026 | N-PORT |
| PFI · Invesco Exchange-Traded Fund Trust | 2.23% | 11156 SH | 2 अक्टूबर 2026 | दैनिक |
| IWP · iShares Trust | 2.12% | 3586481 SH | 11 सितमबर 2026 | दैनिक |
| JXX · Janus Detroit Street Trust | 2.02% | 6216 NS | 31 जुलाई 2026 | N-PORT |
| ALTL · Pacer Funds Trust | 1.88% | 19984 NS | 31 जुलाई 2026 | N-PORT |
| PDP · Invesco Exchange-Traded Fund Trust | 1.86% | 248493 SH | 2 अक्टूबर 2026 | दैनिक |
| SPHB · Invesco Exchange-Traded Fund Trust … | 1.80% | 156141 SH | 2 अक्टूबर 2026 | दैनिक |
| VOT · VANGUARD INDEX FUNDS | 1.74% | 6061374 SH | 19 अगस्त 2026 | दैनिक |
| THNQ · EXCHANGE TRADED CONCEPTS TRUST | 1.70% | 81846 NS | 31 जुलाई 2026 | N-PORT |
| RPG · Invesco Exchange-Traded Fund Trust | 1.50% | 262860 SH | 2 अक्टूबर 2026 | दैनिक |
| IBLC · iShares Trust | 1.43% | 10758 SH | 11 सितमबर 2026 | दैनिक |
| RSPF · Invesco Exchange-Traded Fund Trust | 1.35% | 45237 SH | 2 अक्टूबर 2026 | दैनिक |
| IYF · iShares Trust | 1.33% | 512110 SH | 11 सितमबर 2026 | दैनिक |
| HIBL · Direxion Shares ETF Trust | 1.27% | 10998 NS | 31 जुलाई 2026 | N-PORT |
| IYG · iShares Trust | 1.24% | 239956 SH | 11 सितमबर 2026 | दैनिक |
| IMCG · iShares Trust | 1.22% | 430107 SH | 11 सितमबर 2026 | दैनिक |
| VFH · VANGUARD WORLD FUND | 0.88% | 1222595 SH | 19 अगस्त 2026 | दैनिक |
| VO · VANGUARD INDEX FUNDS | 0.77% | 17145949 SH | 19 अगस्त 2026 | दैनिक |
| PALC · Pacer Funds Trust | 0.76% | 18486 NS | 31 जुलाई 2026 | N-PORT |
| SATO · Invesco Exchange-Traded Fund Trust … | 0.76% | 579 SH | 2 अक्टूबर 2026 | दैनिक |
| FNCL · FIDELITY COVINGTON TRUST | 0.72% | 197124 NS | 31 जुलाई 2026 | N-PORT |
| IWR · iShares Trust | 0.64% | 3148619 SH | 11 सितमबर 2026 | दैनिक |
| IMCB · iShares Trust | 0.61% | 91120 SH | 11 सितमबर 2026 | दैनिक |
| FAS · Direxion Shares ETF Trust | 0.57% | 155904 NS | 31 जुलाई 2026 | N-PORT |
| IXG · iShares Trust | 0.56% | 34363 SH | 11 सितमबर 2026 | दैनिक |
| XOEF · iShares Trust | 0.50% | 990 SH | 11 सितमबर 2026 | दैनिक |
| FFLC · FIDELITY COVINGTON TRUST | 0.45% | 62914 NS | 31 जुलाई 2026 | N-PORT |
| FFLG · FIDELITY COVINGTON TRUST | 0.45% | 30685 NS | 31 जुलाई 2026 | N-PORT |
| WINN · Harbor ETF Trust | 0.36% | 46997 NS | 31 जुलाई 2026 | N-PORT |
| USXF · iShares Trust | 0.34% | 44652 SH | 11 सितमबर 2026 | दैनिक |
| FTC · First Trust Exchange-Traded AlphaDE… | 0.34% | 51261 NS | 31 जुलाई 2026 | N-PORT |
| FBCG · FIDELITY COVINGTON TRUST | 0.33% | 265031 NS | 31 जुलाई 2026 | N-PORT |
| IETC · iShares U.S. ETF Trust | 0.28% | 17158 SH | 11 सितमबर 2026 | दैनिक |
| SIZE · iShares Trust | 0.28% | 10647 SH | 11 सितमबर 2026 | दैनिक |
| ILCG · iShares Trust | 0.28% | 75715 SH | 11 सितमबर 2026 | दैनिक |
| JMOM · J.P. Morgan Exchange-Traded Fund Tr… | 0.26% | 75911 NS | 31 जुलाई 2026 | N-PORT |
| FXO · First Trust Exchange-Traded AlphaDE… | 0.26% | 33770 NS | 31 जुलाई 2026 | N-PORT |
| IVW · iShares Trust | 0.25% | 1687402 SH | 11 सितमबर 2026 | दैनिक |
| EUSA · iShares, Inc. | 0.24% | 40742 SH | 11 सितमबर 2026 | दैनिक |
| IUSG · iShares Trust | 0.24% | 697820 SH | 11 सितमबर 2026 | दैनिक |
| JMID · Janus Detroit Street Trust | 0.24% | 648 NS | 31 जुलाई 2026 | N-PORT |
| VUG · VANGUARD INDEX FUNDS | 0.23% | 8852166 SH | 19 अगस्त 2026 | दैनिक |
| EGUS · iShares Trust | 0.22% | 538 SH | 11 सितमबर 2026 | दैनिक |
| VOOG · VANGUARD ADMIRAL FUNDS | 0.22% | 587846 SH | 19 अगस्त 2026 | दैनिक |
| IWF · iShares Trust | 0.22% | 2391027 SH | 11 सितमबर 2026 | दैनिक |
| RSP · Invesco Exchange-Traded Fund Trust | 0.20% | 1694750 SH | 2 अक्टूबर 2026 | दैनिक |
| ACIO · ETF Series Solutions | 0.19% | 51873 NS | 31 जुलाई 2026 | N-PORT |
| ADME · ETF Series Solutions | 0.19% | 6449 NS | 31 जुलाई 2026 | N-PORT |
| VONG · VANGUARD SCOTTSDALE FUNDS | 0.19% | 1007578 SH | 19 अगस्त 2026 | दैनिक |
| HEQQ · J.P. Morgan Exchange-Traded Fund Tr… | 0.18% | 639 NS | 31 जुलाई 2026 | N-PORT |
| FAD · First Trust Exchange-Traded AlphaDE… | 0.17% | 11142 NS | 31 जुलाई 2026 | N-PORT |
| TOPC · iShares Trust | 0.16% | 477 SH | 11 सितमबर 2026 | दैनिक |
| USCL · iShares Trust | 0.16% | 39634 SH | 11 सितमबर 2026 | दैनिक |
| EGLE · Global X Funds | 0.16% | 40 NS | 31 जुलाई 2026 | N-PORT |
| GLBL · Pacer Funds Trust | 0.16% | 20 NS | 31 जुलाई 2026 | N-PORT |
| FEX · First Trust Exchange-Traded AlphaDE… | 0.16% | 28103 NS | 31 जुलाई 2026 | N-PORT |
| XVV · iShares Trust | 0.15% | 9106 SH | 11 सितमबर 2026 | दैनिक |
| IWS · iShares Trust | 0.15% | 197912 SH | 11 सितमबर 2026 | दैनिक |
| GARP · iShares Trust | 0.15% | 39146 SH | 11 सितमबर 2026 | दैनिक |
| LRGF · iShares Trust | 0.14% | 46124 SH | 11 सितमबर 2026 | दैनिक |
| IVV · iShares Trust | 0.14% | 9972358 SH | 11 सितमबर 2026 | दैनिक |
| PBP · Invesco Exchange-Traded Fund Trust | 0.13% | 4703 SH | 2 अक्टूबर 2026 | दैनिक |
| ILCB · iShares Trust | 0.13% | 15056 SH | 11 सितमबर 2026 | दैनिक |
| VV · VANGUARD INDEX FUNDS | 0.13% | 924019 SH | 19 अगस्त 2026 | दैनिक |
| ESGV · VANGUARD WORLD FUND | 0.13% | 173729 SH | 19 अगस्त 2026 | दैनिक |
| IYY · iShares Trust | 0.13% | 33886 SH | 11 सितमबर 2026 | दैनिक |
| PBUS · Invesco Exchange-Traded Fund Trust … | 0.13% | 130223 SH | 2 अक्टूबर 2026 | दैनिक |
| IWB · iShares Trust | 0.12% | 531192 SH | 11 सितमबर 2026 | दैनिक |
| ACVF · ETF Opportunities Trust | 0.12% | 2156 NS | 31 जुलाई 2026 | N-PORT |
| ITOT · iShares Trust | 0.12% | 1030051 SH | 11 सितमबर 2026 | दैनिक |
| CATH · Global X Funds | 0.12% | 18201 NS | 31 जुलाई 2026 | N-PORT |
| VOO · VANGUARD INDEX FUNDS | 0.12% | 20552801 SH | 19 अगस्त 2026 | दैनिक |
| ESGU · iShares Trust | 0.12% | 189191 SH | 11 सितमबर 2026 | दैनिक |
| IWV · iShares Trust | 0.12% | 211229 SH | 11 सितमबर 2026 | दैनिक |
| PHDG · Invesco Actively Managed Exchange-T… | 0.11% | 623 SH | 2 अक्टूबर 2026 | दैनिक |
| CHRI · Global X Funds | 0.11% | 102 NS | 31 जुलाई 2026 | N-PORT |
| VTI · VANGUARD INDEX FUNDS | 0.11% | 25121101 SH | 19 अगस्त 2026 | दैनिक |
| VONE · VANGUARD SCOTTSDALE FUNDS | 0.11% | 127128 SH | 19 अगस्त 2026 | दैनिक |
| VTHR · VANGUARD SCOTTSDALE FUNDS | 0.11% | 64691 SH | 19 अगस्त 2026 | दैनिक |
| XYLG · Global X Funds | 0.11% | 811 NS | 31 जुलाई 2026 | N-PORT |
| XYLD · Global X Funds | 0.11% | 39758 NS | 31 जुलाई 2026 | N-PORT |
| PTLC · Pacer Funds Trust | 0.11% | 39989 NS | 31 जुलाई 2026 | N-PORT |
| XTR · Global X Funds | 0.10% | 58 NS | 31 जुलाई 2026 | N-PORT |
| BBUS · J.P. Morgan Exchange-Traded Fund Tr… | 0.10% | 107169 NS | 31 जुलाई 2026 | N-PORT |
| XCLR · Global X Funds | 0.10% | 43 NS | 31 जुलाई 2026 | N-PORT |
| VOTE · TCW ETF Trust | 0.10% | 13145 NS | 31 जुलाई 2026 | N-PORT |
| XRMI · Global X Funds | 0.10% | 598 NS | 31 जुलाई 2026 | N-PORT |
| BKLC · BNY Mellon ETF Trust | 0.10% | 64546 NS | 31 जुलाई 2026 | N-PORT |
| TOV · EA Series Trust | 0.10% | 3057 NS | 31 जुलाई 2026 | N-PORT |
| DFAU · Dimensional ETF Trust | 0.10% | 141317 NS | 31 जुलाई 2026 | N-PORT |
| SPUU · Direxion Shares ETF Trust | 0.10% | 2985 NS | 31 जुलाई 2026 | N-PORT |
| QDPL · Pacer Funds Trust | 0.10% | 19061 NS | 31 जुलाई 2026 | N-PORT |
| TOK · iShares Trust | 0.10% | 2016 SH | 11 सितमबर 2026 | दैनिक |
| DFUS · Dimensional ETF Trust | 0.10% | 229513 NS | 31 जुलाई 2026 | N-PORT |
| URTH · iShares, Inc. | 0.09% | 67333 SH | 11 सितमबर 2026 | दैनिक |
| DFSU · Dimensional ETF Trust | 0.09% | 22927 NS | 31 जुलाई 2026 | N-PORT |
| HCMT · Direxion Shares ETF Trust | 0.08% | 5504 NS | 31 जुलाई 2026 | N-PORT |
| ACWI · iShares Trust | 0.08% | 242122 SH | 11 सितमबर 2026 | दैनिक |
| DYNF · BlackRock ETF Trust | 0.08% | 304206 SH | 11 सितमबर 2026 | दैनिक |
| DFAC · Dimensional ETF Trust | 0.08% | 457848 NS | 31 जुलाई 2026 | N-PORT |
| VOXP · Advisors Series Trust | 0.08% | 54 NS | 31 जुलाई 2026 | N-PORT |
| SPXL · Direxion Shares ETF Trust | 0.08% | 61853 NS | 31 जुलाई 2026 | N-PORT |
| CRBN · iShares Trust | 0.08% | 7876 SH | 11 सितमबर 2026 | दैनिक |
| PABU · iShares Trust | 0.07% | 15996 SH | 11 सितमबर 2026 | दैनिक |
| VT · VANGUARD INTERNATIONAL EQUITY INDEX… | 0.07% | 641913 SH | 19 अगस्त 2026 | दैनिक |
| TILT · FlexShares Trust | 0.07% | 17538 NS | 31 जुलाई 2026 | N-PORT |
| EQAL · Invesco Exchange-Traded Fund Trust … | 0.06% | 4650 SH | 2 अक्टूबर 2026 | दैनिक |
| DFVX · Dimensional ETF Trust | 0.05% | 3103 NS | 31 जुलाई 2026 | N-PORT |
| PEVC · Pacer Funds Trust | 0.05% | 14 NS | 31 जुलाई 2026 | N-PORT |
| DCOR · Dimensional ETF Trust | 0.04% | 16720 NS | 31 जुलाई 2026 | N-PORT |
| IWD · iShares Trust | 0.04% | 293137 SH | 11 सितमबर 2026 | दैनिक |
| VONV · VANGUARD SCOTTSDALE FUNDS | 0.04% | 79772 SH | 19 अगस्त 2026 | दैनिक |
| GLOF · iShares Trust | 0.04% | 679 SH | 11 सितमबर 2026 | दैनिक |
| PRF · Invesco Exchange-Traded Fund Trust | 0.03% | 22601 SH | 2 अक्टूबर 2026 | दैनिक |
| RWL · Invesco Exchange-Traded Fund Trust … | 0.02% | 21561 SH | 2 अक्टूबर 2026 | दैनिक |
| OMFL · Invesco Exchange-Traded Self-Indexe… | 0.02% | 8731 SH | 2 अक्टूबर 2026 | दैनिक |
| DXUV · Dimensional ETF Trust | 0.01% | 449 NS | 31 जुलाई 2026 | N-PORT |
| IAI · iShares Trust | · | 684310 SH | 11 सितमबर 2026 | दैनिक |
HOOD विश्लेषक सर्वसम्मति तेजी और मंदी के विश्लेषक राय, 12-महीने का मूल्य लक्ष्य, अपसाइड
12-महीने का मूल्य लक्ष्य
27 विश्लेषक · 2026-09-29माध्य लक्ष्य $131.08 +16.3%
सहकर्मी तुलना (GICS उप-उद्योग) प्रमुख मेट्रिक्स बनाम सेक्टर के साथी
वित्तीय वर्ष के आधार पर, प्रत्येक कंपनी के पिछले वित्तीय वर्ष के अंत के बंद भाव के अनुसार कीमतें।
| टिकर | मार्केट कैप | P/E | राजस्व YoY | शुद्ध मार्जिन | ROE | सकल मार्जिन |
|---|---|---|---|---|---|---|
| HOOD | $101.94B | 55.2 | 51.6% | 42.1% | 21.9% | · |
| MS | $281.00B | 17.4 | 14.4% | 23.9% | 15.6% | · |
| GS | $260.60B | 17.1 | 8.9% | 29.5% | 13.9% | · |
| SCHW | $207.21B | 21.5 | 22.0% | 37.0% | 17.9% | · |
| IBKR | · | 29.0 | 23.4% | · | · | · |
| RJF | $34.20B | 16.8 | 6.6% | 13.4% | 17.7% | · |
| LPLA | · | 32.7 | 37.2% | 5.1% | 16.6% | · |
| FRHC | $8.88B | 57.7 | 9.3% | 7.0% | 11.3% | · |
| JEF | · | 20.3 | 2.9% | 6.3% | 6.6% | · |
| SF | · | 14.2 | 6.7% | 10.8% | 11.7% | · |
| EVR | · | 24.2 | 29.5% | 15.3% | 31.7% | · |
ताज़ा समाचार इस कंपनी का उल्लेख करने वाली हालिया सुर्खियां
HOOD एआई विश्लेषक पैनल — तेजी और मंदी के विचार स्टॉक की संभावनाओं पर 2026Q2 बहस: क्लॉड, ग्रोक, जेमिनी, चैटजीपीटी
रॉबिनहुड का स्टॉक इस बात पर एक उच्च-दांव वाला दांव है कि खुदरा ट्रेडिंग वॉल्यूम अपनी वर्तमान गति को बनाए रख सकता है या नहीं। क्लाउड और मिथुन चेतावनी देते हैं कि 46x P/E अनुपात त्रुटि के लिए कोई जगह नहीं छोड़ता है, खासकर भुगतान-के-लिए-ऑर्डर-फ्लो राजस्व पर नियामक खतरों के साथ। इसके विपरीत, ग्रोक का तर्क है कि कंपनी का 27% ROE एक स्केलेबल डिजिटल लीडर के रूप में प्रीमियम मूल्यांकन को उचित ठहराता है। पैनल गहराई से विभाजित रहता है, अधिकांश विश्लेषक तब तक होल्ड का पक्ष लेते हैं जब तक कि कंपनी यह साबित नहीं कर देती कि उसका विकास संरचनात्मक है न कि चक्रीय।
राउंड 1 — शुरुआती विचार
मुझे रॉबिनहुड खुदरा निवेशकों के लिए एक कैश-प्रिंटिंग मशीन के रूप में विकसित होता हुआ दिखाई देता है यदि क्रिप्टो और स्टॉक ट्रेडिंग वॉल्यूम 2026Q2 में बढ़ते रहते हैं। 95% सकल मार्जिन दिखाता है कि उनके डिजिटल प्लेटफॉर्म पर बेचे गए माल की लागत लगभग शून्य है, जिससे वे अधिकांश राजस्व को लाभ के रूप में पॉकेट कर सकते हैं। ROE 27% पर पहुंच गया, SCHW के 18% जैसे साथियों के मध्यिका को पार कर गया और विरासत दलालों की तुलना में बेहतर पूंजी दक्षता साबित हुई। EPS $2.40 TTM तक दोगुना हो गया, जिसने $40 से $98 तक 140% स्टॉक वृद्धि को बढ़ावा दिया जो वास्तविक गति का संकेत देता है।
रॉबिनहुड खुदरा सट्टेबाजी पर एक उच्च-बीटा दांव बना हुआ है जो बाजारों के ठंडा होने और वॉल्यूम सूखने पर बिखर जाता है। 46x पर P/E साथियों जैसे MS को 16x पर बौना कर देता है, जिससे कठिन 2026 में कमाई की चूक के लिए कोई गुंजाइश नहीं बचती है। ऋण/इक्विटी 183% तक बढ़ गया, जिससे लीवरेज जोखिम बढ़ गया जो अस्थिरता के दौरान नुकसान को बढ़ा सकता है। ARKK ETF बहिर्वाह ने 13 अप्रैल को HOOD को चिह्नित किया, जो विकास नामों से दूर रोटेशन के बीच नाजुक भावना को रेखांकित करता है।
रॉबिनहुड ने एक खुदरा निवेश खाई का निर्माण किया है जो बड़े पैमाने पर नकदी छापती है - 52% शुद्ध मार्जिन और 95% सकल मार्जिन मूल्य निर्धारण शक्ति दिखाते हैं जिसे अधिकांश ब्रोकर छू नहीं सकते हैं। स्टॉक मई के निचले स्तर से 110% बढ़कर $98 हो गया है, जो संस्थागत विश्वास का संकेत देता है कि खुदरा ट्रेडिंग बूम संरचनात्मक है, चक्रीय नहीं। EPS साल-दर-साल 22% बढ़कर $2.40 हो गया, और 27% ROE पर, प्रबंधन अनुशासन के साथ शेयरधारक पूंजी तैनात कर रहा है। यदि खुदरा भागीदारी 2026 के माध्यम से ऊंची बनी रहती है, तो आय के पैमाने के रूप में यह मूल्यांकन स्वाभाविक रूप से संपीड़ित हो जाता है।
रॉबिनहुड पिछले आय पर 46 गुना पर कारोबार करता है - मॉर्गन स्टेनली और गोल्डमैन सैक्स से तीन गुना, और चार्ल्स श्वाब से लगभग तीन गुना। यह प्रीमियम ऐसे बाजार में निर्दोष निष्पादन मानता है जहां खुदरा व्यापार रातोंरात वाष्पित हो सकता है। 183% का ऋण-से-इक्विटी अनुपात चिंताजनक है; कंपनी आंखों तक लीवरेज्ड है, जिसका अर्थ है कि एक तेज बाजार में गिरावट या ट्रेडिंग वॉल्यूम में गिरावट तरलता को तेजी से निचोड़ सकती है। 1.22 का वर्तमान अनुपात थोड़ा कुशन छोड़ता है। मेरा पढ़ना यह है कि स्टॉक पहले से ही एक दशक के विकास को मूल्यवान बना रहा है - वॉल्यूम या मार्जिन पर एक चूक और कई संपीड़न कठिन हो जाता है।
रॉबिनहुड ने सफलतापूर्वक एक विशिष्ट ट्रेडिंग ऐप से एक अत्यधिक कुशल वित्तीय पावरहाउस में संक्रमण किया है। कंपनी 26.95% इक्विटी पर रिटर्न उत्पन्न कर रही है। इसका मतलब है कि वे शेयरधारक पूंजी को वास्तविक लाभ में बदलने में असाधारण रूप से प्रभावी हैं, जो मॉर्गन स्टेनली जैसे पारंपरिक बैंकिंग दिग्गजों से बहुत आगे निकल जाते हैं। इसके अलावा, उनका 52.19% शुद्ध लाभ मार्जिन एक ब्रोकरेज के लिए चौंकाने वाला है। यह इंगित करता है कि वे जो राजस्व लाते हैं उसके प्रत्येक डॉलर के लिए, आधे से अधिक सीधे नीचे की रेखा तक गिर जाता है, जो वित्तीय सेवा क्षेत्र में दुर्लभ परिचालन लीवरेज का स्तर दिखाता है।
मूल्यांकन वर्तमान में पूर्णता का मूल्य निर्धारण कर रहा है, जिससे अस्थिर बाजार में निष्पादन त्रुटियों के लिए कोई जगह नहीं बचती है। स्टॉक 46.35 के मूल्य-से-आय अनुपात पर कारोबार करता है। यह बताता है कि निवेशक भविष्य के विकास के लिए एक भारी प्रीमियम का भुगतान कर रहे हैं जो साकार नहीं हो सकता है यदि खुदरा गतिविधि ठंडी हो जाती है। इसके अतिरिक्त, उनका ऋण-से-इक्विटी अनुपात 182.86 पर है। लीवरेज का यह उच्च स्तर का मतलब है कि कंपनी अपने अधिक रूढ़िवादी साथियों की तुलना में ब्याज दर में उतार-चढ़ाव और क्रेडिट कसने के प्रति काफी अधिक संवेदनशील है, जिससे बाजार की स्थितियों में अचानक गिरावट आने पर एक अनिश्चित बैलेंस शीट बनती है।
मुझे लगता है कि 2026Q2 में HOOD के लिए सबसे मजबूत तेजी का मामला यह है कि यह केवल सामयिक लाभ के बजाय टिकाऊ लाभप्रदता में पैमाने को परिवर्तित कर रहा है। ROE TTM: 26.95%। यह दर्शाता है कि कंपनी इक्विटी को मजबूत दर पर लाभ में बदल रही है। नेट मार्जिन TTM: 52.19%। इसका मतलब है कि राजस्व का आधा से अधिक लाभ बन जाता है, जो ठोस कमाई की शक्ति का समर्थन करता है। EPS TTM: 2.402। यह संभावित कई विस्तार के लिए एक विश्वसनीय कमाई आधार प्रदान करता है यदि विकास बना रहता है।
मुझे लगता है कि सबसे मजबूत मंदी का मामला यह है कि मूल्यांकन अमीर दिखता है और लीवरेज अधिक है, जिससे विकास धीमा होने पर नीचे की ओर जोखिम पैदा होता है। P/E TTM: 46.35। यह साथियों से काफी ऊपर है और वास्तविक कमाई की शक्ति के मुकाबले महंगी अपेक्षाओं को चिह्नित करता है। ऋण/इक्विटी: 182.86। इसका मतलब है कि भारी लीवरेज वित्तीय जोखिम और दर चालों के प्रति संवेदनशीलता को बढ़ाता है। P/S: 24.19। यह उपयोगकर्ता वृद्धि या मुद्रीकरण नरम होने पर थोड़ा कुशन छोड़ता है।
राउंड 2 — प्रतिक्रियाएं और खंडन
राउंड 2 — प्रतिक्रियाएं और खंडन
क्लाउड, MS और GS को 16x पर आपका मंदी वाला P/E तुलना IBKR के 119x मल्टीपल को वास्तविक डिजिटल सहकर्मी बेंचमार्क के रूप में अनदेखा करता है। वह प्रीमियम साबित करता है कि निवेशक कुशल इक्विटी को लाभ में बदलने वाले स्केलेबल ब्रोकर्स के लिए भुगतान करते हैं, ठीक रॉबिनहुड के 27% ROE की तरह जो IBKR के 20% को शीर्ष पर रखता है। यह HOOD के 46x को ऐसा बनाता है जैसे कि यह अभी भी पकड़ रहा है, अधिक पकाया नहीं गया है।
मैं ग्रोक की उस ऋण-से-इक्विटी संख्या की रीडिंग पर वापस जाना चाहता हूं। हाँ, 183% अकेले चिंताजनक लगता है, लेकिन रॉबिनहुड एक पारंपरिक बैंक नहीं है - यह एक प्लेटफॉर्म व्यवसाय है जिसमें लगभग शून्य बेचे गए माल की लागत और 52% शुद्ध मार्जिन है। वह लीवरेज कार्यशील पूंजी और विकास को निधि देता है, न कि जोखिम भरी संपत्ति की स्थिति को। असली सवाल यह है कि क्या कंपनी परिचालन नकदी प्रवाह से उस ऋण का भुगतान कर सकती है, और 27% ROE मुझे बताता है कि यह ठीक वही कर रहा है। ग्रोक, आप D/E अनुपात को ऐसे मान रहे हैं जैसे कि यह एक बैंक बैलेंस शीट है जब यह वास्तव में एक टेक-स्केल्ड व्यवसाय है। वह एक श्रेणी त्रुटि है, लाल झंडा नहीं।
क्लाउड, ऋण-से-इक्विटी अनुपात पर आपका ध्यान यहां संरचनात्मक नाजुकता की पहचान करता है, लेकिन मुझे लगता है कि आप वर्तमान मूल्यांकन के जोखिम को कम आंक रहे हैं। स्टॉक पिछले आय पर 46 गुना पर कारोबार करता है। यह मल्टीपल बताता है कि बाजार निरंतर, आक्रामक विकास का मूल्य निर्धारण कर रहा है जो खुदरा गतिविधि के ठंडा होने की एक भी तिमाही के लिए बिल्कुल भी जगह नहीं छोड़ता है। जबकि परिचालन मार्जिन प्रभावशाली हैं, मैं असहमत हूं कि वर्तमान मूल्य पूर्णता से कम कुछ भी मानता है; इस विकास पथ से कोई भी विचलन उस प्रीमियम में हिंसक संकुचन का कारण बनेगा।
मुझे लगता है कि क्लाउड, D/E के बारे में आपका बिंदु इस तरह से चूक जाता है कि HOOD लीवरेज के साथ भी टिकाऊ लाभ उत्पन्न करने के लिए पैमाने का उपयोग करता है। ऋण/इक्विटी 183% है, जो उच्च वित्तीय जोखिम और दर चालों के प्रति संवेदनशीलता का संकेत देता है। सीधे शब्दों में कहें, एक तेज फंडिंग लागत या वॉल्यूम में गिरावट HOOD के मार्जिन और तरलता को निचोड़ सकती है। फिर भी, यदि वॉल्यूम मजबूत बने रहते हैं और मुद्रीकरण में सुधार होता है, तो नकदी प्रवाह उस ऋण का भुगतान करने और कमाई की शक्ति का समर्थन करने में मदद करेगा, जो एक प्रीमियम मल्टीपल को उचित ठहराता है - हालांकि एक मुफ्त पास नहीं।
राउंड 3 — अंतिम खंडन
राउंड 3 — अंतिम खंडन
मिथुन, मैं इस बात से असहमत हूं कि 46x P/E ठंडा गतिविधि के लिए कोई जगह नहीं छोड़ता है। IBKR 119x आय पर कारोबार करता है। यह साबित करता है कि डिजिटल ब्रोकर्स HOOD के 27% ROE जैसी पूंजी दक्षता प्रदान करते समय अत्यधिक मल्टीपल कमांड करते हैं, जो 16-18% सहकर्मी मध्यिका को कुचलते हैं और विरासत खिलाड़ियों पर संरचनात्मक बढ़त का संकेत देते हैं। $40 से $98 तक 260-390 मिलियन शेयर सप्ताहों पर पैराबोलिक रैली से पता चलता है कि संस्थाएं पूर्णता पर दांव लगाने के बजाय अंदर ढेर हो रही हैं।
मैं ग्रोक की IBKR तुलना पर वापस जाना चाहता हूं - यह एक वास्तविक त्रुटि है। इंटरैक्टिव ब्रोकर्स 119 गुना आय पर कारोबार करता है क्योंकि यह परिष्कृत व्यापारियों के लिए एक विशिष्ट, उच्च-स्पर्श वाला प्लेटफॉर्म है जिसमें रॉबिनहुड की तुलना में संरचनात्मक रूप से भिन्न इकाई अर्थशास्त्र है। रॉबिनहुड के 27% की तुलना में IBKR का 20% ROE वास्तव में बिंदु साबित करता है: रॉबिनहुड अधिक कुशल है, फिर भी IBKR के मल्टीपल के आधे से भी कम पर कारोबार करता है। वह अंतर मौजूद है क्योंकि बाजार रॉबिनहुड के खुदरा उपयोगकर्ता आधार को IBKR के संस्थागत आधार की तुलना में अधिक चक्रीय और वॉल्यूम-निर्भर मानता है। ग्रोक, आप मूल्यांकन को सही ठहराने के लिए एक आउटलायर सहकर्मी का उपयोग कर रहे हैं जब वास्तविक कंप सेट - मॉर्गन स्टेनली 16x पर, श्वाब 18x पर - आपको बताता है कि HOOD अभी भी शून्य सुरक्षा मार्जिन के लिए कीमत पर है। 46x मल्टीपल "पकड़ रहा" नहीं है। यह एक खुदरा बूम का मूल्य निर्धारण कर रहा है जो कभी ठंडा नहीं होता है।
मैं यहां फ्रेम को चौड़ा करना चाहता हूं, क्योंकि हम कमरे में हाथी को अनदेखा कर रहे हैं: भुगतान के लिए ऑर्डर फ्लो, या PFOF की SEC की चल रही जांच। यह राजस्व मॉडल रॉबिनहुड के 52.19% शुद्ध मार्जिन का एक बड़ा हिस्सा है। यदि नियामक इस प्रथा को प्रतिबंधित या प्रतिबंधित करने के लिए आगे बढ़ते हैं, तो कंपनी के पूरे लाभ इंजन को एक अस्तित्वगत खतरा सामना करना पड़ता है जिसे कोई भी ROE या परिचालन दक्षता ठीक नहीं कर सकती है। ग्रोक और क्लाउड मूल्यांकन पर बहस कर रहे हैं, लेकिन वे नियामक पूंछ जोखिम को याद कर रहे हैं जो उन आय गुणकों को रातोंरात अप्रासंगिक बना सकता है। यहां एक नीतिगत बदलाव एक मल्टीपल संपीड़न के लिए सबसे बड़ा उत्प्रेरक है।
मुझे लगता है कि हमें नियामक और मैक्रो गतिशीलता तक फ्रेम को चौड़ा करना चाहिए जो HOOD को स्थानांतरित कर सकता है, न कि केवल अनुपात। P/E TTM 46.35x। वह उच्च मल्टीपल पहले से ही निरंतर विकास का मूल्य निर्धारण कर रहा है; भुगतान-के-लिए-ऑर्डर-फ्लो नियमों में एक विश्वसनीय बदलाव आय को संपीड़ित कर सकता है और मल्टीपल को नीचे खींच सकता है। ROE TTM 26.95%। वह लाभप्रदता वर्तमान मुद्रीकरण पर निर्भर करती है; यदि नीति परिवर्तन PFOF या संबंधित राजस्व में कटौती करते हैं, तो ROE कम हो सकता है।
मूल्य पूर्वानुमान
| मॉडल | 3M लक्ष्य | 6M लक्ष्य | तर्क |
|---|---|---|---|
| Grok | $105.00 | $115.00 | मुझे लगता है कि रॉबिनहुड स्टॉक 3-6 महीनों में $105-$115 की ओर बढ़ेगा यदि ट्रेडिंग वॉल्यूम सट्टा ऐप से स्केलेबल लाभ इंजन में इसके बदलाव की पुष्टि करते हैं। मुख्य उत्प्रेरक 7 अगस्त, 2026 को Q2 2026 की कमाई है, जहां क्रिप्टो/विकल्प उछाल पर $0.65 से ऊपर EPS बीट रैली को मान्य कर सकता है। बड़ा जोखिम सितंबर 2026 तक एक SEC PFOF नियम परिवर्तन है, जो रातोंरात 52% शुद्ध मार्जिन को खत्म कर देगा। $98 क्लोज से 46x पिछले P/E पर, यह 25% EPS वृद्धि के तीन साल का मूल्य निर्धारण कर रहा है - यदि वॉल्यूम बना रहता है तो संभव है, लेकिन संपीड़न किसी भी चूक की प्रतीक्षा करता है। |
| Claude | $72.00 | $85.00 | रॉबिनहुड का 52% शुद्ध मार्जिन और 27% ROE वास्तविक हैं, लेकिन 46x P/E मल्टीपल खुदरा बूम का मूल्य निर्धारण कर रहा है जिसमें त्रुटि के लिए शून्य मार्जिन है - और मुझे लगता है कि यह धारणा 2026Q2 में टूट जाती है। मेरा थीसिस: जैसे ही खुदरा ट्रेडिंग सामान्य हो जाती है और बाजार विकास को "संरचनात्मक" से "चक्रीय" में पुनर्मूल्यांकन करता है, स्टॉक 18-22x आय की ओर संपीड़ित हो जाता है। ठोस उत्प्रेरक Q2 2026 की कमाई है; यदि ट्रेडिंग वॉल्यूम या PFOF राजस्व निराश करता है, तो मल्टीपल तेजी से ढह जाता है। इसे तोड़ने का जोखिम एक आश्चर्यजनक क्रिप्टो या मीम-स्टॉक उछाल है जो खुदरा भागीदारी को फिर से प्रज्वलित करता है। 46x आय पर, रॉबिनहुड वर्तमान लाभ के प्रत्येक $1 के लिए $46 का भुगतान कर रहा है - जब तक कि वॉल्यूम पैराबोलिक न रहें तब तक अस्थिर। मैं क्रैश नहीं, बल्कि मामूली संपीड़न का पूर्वानुमान लगा रहा हूं, क्योंकि मार्जिन बचाव योग्य हैं। लेकिन 183% का ऋण-से-इक्विटी अनुपात का मतलब है कि कोई भी वॉल्यूम झटका कठिन होता है। |
| Gemini | $55.00 | $62.00 | मेरा थीसिस यह है कि रॉबिनहुड खुदरा गति से लाभान्वित होता रहेगा, लेकिन स्टॉक तब तक संघर्ष करेगा जब तक वे भुगतान के लिए ऑर्डर फ्लो से परे राजस्व में विविधता लाने में सक्षम साबित नहीं हो जाते। प्राथमिक उत्प्रेरक 2026Q3 आय रिपोर्ट है; यदि वे बाजार की अस्थिरता के बावजूद निरंतर उपयोगकर्ता वृद्धि दिखाते हैं, तो यह वर्तमान प्रीमियम को मान्य करेगा। इसके विपरीत, भुगतान के लिए ऑर्डर फ्लो को प्रतिबंधित करने के लिए एक औपचारिक SEC निर्णय एक विनाशकारी जोखिम होगा जो मेरे थीसिस को तोड़ देगा। वर्तमान में, स्टॉक पिछले आय के 46.35 गुना पर कारोबार करता है। यह उच्च मल्टीपल का मतलब है कि निवेशक भविष्य के विकास के वर्षों के लिए भुगतान कर रहे हैं, अगर खुदरा गतिविधि नरम हो जाती है तो त्रुटि के लिए बहुत कम जगह छोड़ते हैं। |
| Chatgpt | $54.00 | $60.00 | मेरा थीसिस यह है कि HOOD लाभप्रदता के पैमाने और भावना में सुधार के रूप में 3-6 महीनों में उच्चतर रुझान कर सकता है। उत्प्रेरक: मुद्रीकरण स्थिरता (विशेष रूप से PFOF) की पुष्टि के साथ एक ठोस 2026Q2 आय प्रिंट स्टॉक को 3-महीने के लक्ष्य की ओर धकेल देगा। जोखिम: PFOF में नियामक परिवर्तन या एक नरम वॉल्यूम पृष्ठभूमि उस प्रीमियम को कम कर सकती है और ऊपर की ओर कैप कर सकती है। आज 49.45 से, मैं 3 महीनों में 54 और 6 महीनों में 60 देखता हूं। |
मेरे मेट्रिक्स आपकी व्यक्तिगत वॉचलिस्ट — पूर्ण फंडामेंटल से चयनित पंक्तियाँ
उन मेट्रिक्स को चुनें जो आपके लिए मायने रखते हैं — ऊपर फुल फंडामेंटल्स में किसी भी पंक्ति के बगल में + पर क्लिक करें।
आपका चयन सहेजा गया है और यह सभी टिकर में आपके साथ रहता है।