
ETN Eaton Corporation, PLC Ordinary Shares
NYSE · Electrical Equipment · Lihat di SEC EDGAR ↗ 10-K/10-Q Jul 31, 2026ETN Cuplikan Saham Harga, kapitalisasi pasar, P/E, EPS, ROE, utang/ekuitas, kisaran 52 minggu
ETN Grafik Harga Saham OHLCV harian dengan indikator teknis — geser, perbesar, dan sesuaikan tampilan Anda
Granularitas batang menyesuaikan dengan periode yang dipilih — arahkan kursor ke bagan untuk melihat buka/tinggi/rendah/tutup untuk sebuah batang.
| Tanggal ex-dividen | Pemecahan | Tipe |
|---|---|---|
| 1 Maret 2011 | 2-for-1 | Maju |
| 24 Feb. 2004 | 2-for-1 | Maju |
| 2 Jan. 2001 | 839-for-728 | Maju |
| 29 Juni 1993 | 2-for-1 | Maju |
| 20 Sep. 1988 | 3-for-2 | Maju |
| 3 Okt. 1979 | 3-for-2 | Maju |
Tentang Eaton Corporation, PLC Ordinary Shares Tinjauan perusahaan dari Wikipedia
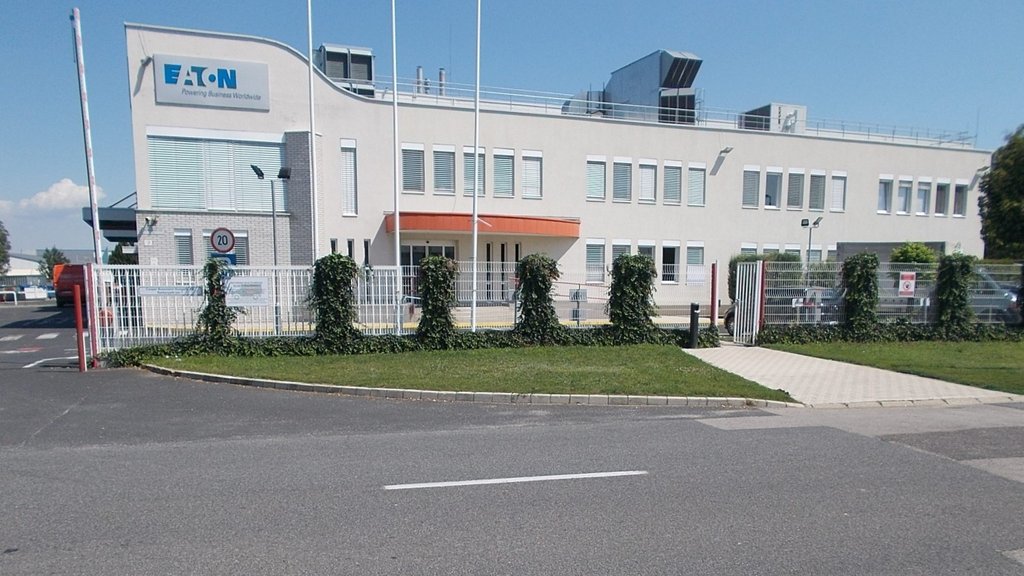
Eaton Corp. adalah sebuah perusahaan asal Irlandia yang bergerak di sektor manufaktur. Fokus utama Eaton adalah industri peralatan industri. Pada tahun 2014, Eaton mendapatkan penjualan sebesar AS$22 miliar dengan total keuntungan AS$1,9 miliar.
Pada tahun yang sama, Eaton menempati peringkat ke-299 dalam daftar Global 2000, sebuah daftar perusahaan terbesar di dunia yang diperingkat oleh majalah bisnis Forbes, dengan total nilai pasar sebanyak AS$36,1 miliar dan total aset sebesar AS$35,5 miliar.
Referensi
Lihat pula
Global 2000
New York Stock Exchange
Forbes
Pranala luar
Profil Eaton di situs Forbes
Sumber: Wikipedia, CC BY-SA 4.0 · Lihat di Wikipedia ↗
Kinerja 10 Tahun Tren Pendapatan, laba bersih, margin, dan EPS
Valuasi Rasio P/E, P/S, P/B, EV/EBITDA — apakah sahamnya mahal atau murah?
| Metrik | Tren 5 Tahun | ETN | rata-rata 5T | Median Rekan | Kesimpulan |
|---|---|---|---|---|---|
| P/E (TTM) | 37.3rata-rata 5T ≈30.7 | ≈30.7 | · | · | |
| P/S (TTM) | 4.7rata-rata 5T ≈4.1 | ≈4.1 | · | · | |
| P/B (MRQ) | 7.0rata-rata 5T ≈5.3 | ≈5.3 | · | · | |
| EV / EBITDA | 140.4rata-rata 5T ≈100.3 | ≈100.3 | · | · | |
| Harga / FCF (TTM) | 36.1rata-rata 5T ≈36.2 | ≈36.2 | · | · | |
| Harga / Arus Kas (TTM) | 28.7rata-rata 5T ≈28.2 | ≈28.2 | · | · | |
| EV / Pendapatan (TTM) | 4.8rata-rata 5T ≈4.0 | ≈4.0 | · | · | |
| EV / FCF (TTM) | 36.5rata-rata 5T ≈35.8 | ≈35.8 | · | · | |
| Harga / Nilai Buku Berwujud (MRQ) | 18.6 | · | · | · | |
| PEG Ratio (Rasio PEG) | ≈1.5 | · | · | · |
Median rekan dihitung berdasarkan basis standar per metrik dan mungkin tidak selalu cocok dengan basis TTM/MRQ yang ditampilkan untuk saham ini.
Profitabilitas Margin kotor, operasional, dan bersih; ROE, ROA, ROIC
| Metrik | Tren 5 Tahun | ETN | rata-rata 5T | Median Rekan | Kesimpulan |
|---|---|---|---|---|---|
| EBITDA Margin (Margin EBITDA) | 3.7%rata-rata 5T ≈4.1% | ≈4.1% | · | · | |
| Margin Sebelum Pajak (TTM) | 16.1%rata-rata 5T ≈16.3% | ≈16.3% | · | · | |
| Margin Laba Bersih (TTM) | 12.7%rata-rata 5T ≈13.4% | ≈13.4% | · | · | |
| ROA (TTM) | 7.9%rata-rata 5T ≈8.5% | ≈8.5% | · | · | |
| ROE (TTM) | 19.7%rata-rata 5T ≈17.6% | ≈17.6% | · | · |
Kesehatan Keuangan Utang, likuiditas, solvabilitas — kekuatan neraca
| Metrik | Tren 5 Tahun | ETN | rata-rata 5T | Median Rekan | Kesimpulan |
|---|---|---|---|---|---|
| Utang / Ekuitas (MRQ) | 0.1rata-rata 5T ≈0.0 | ≈0.0 | · | · | |
| Rasio Lancar (MRQ) | 1.2rata-rata 5T ≈1.3 | ≈1.3 | · | · | |
| Rasio Cepat (MRQ) | 0.6rata-rata 5T ≈0.7 | ≈0.7 | · | · |
Pertumbuhan Pertumbuhan Pendapatan, EPS, dan Laba Bersih: YoY, CAGR 3T, CAGR 5T
| Metrik | Tren 5 Tahun | ETN | rata-rata 5T | Median Rekan | Kesimpulan |
|---|---|---|---|---|---|
| Revenue YoY (Pendapatan YoY) | 10.3%rata-rata 5T ≈9.0% | ≈9.0% | · | · | |
| Revenue CAGR 3Y (CAGR Pendapatan 3T) | 9.8%rata-rata 5T ≈9.0% | ≈9.0% | · | · | |
| Revenue CAGR 5Y (CAGR Pendapatan 5T) | 9.0% | · | · | · | |
| EPS YoY | 10.0%rata-rata 5T ≈25.4% | ≈25.4% | · | · | |
| Net Income YoY (Laba Bersih YoY) | 7.7%rata-rata 5T ≈24.6% | ≈24.6% | · | · | |
| EPS CAGR 3Y (CAGR EPS 3T) | 19.4%rata-rata 5T ≈24.2% | ≈24.2% | · | · | |
| EPS CAGR 5Y (CAGR EPS 5T) | 24.5% | · | · | · | |
| Net Income CAGR 3Y (CAGR Laba Bersih 3T) | 18.4%rata-rata 5T ≈23.7% | ≈23.7% | · | · | |
| Net Income CAGR 5Y (CAGR Laba Bersih 5T) | 23.7% | · | · | · |
Efisiensi Modal Perputaran aset, perputaran persediaan, perputaran piutang
| Metrik | Tren 5 Tahun | ETN | rata-rata 5T | Median Rekan | Kesimpulan |
|---|---|---|---|---|---|
| Asset Turnover (Perputaran Aset) | 0.7rata-rata 5T ≈0.6 | ≈0.6 | · | · | |
| Inventory Turnover (Perputaran Persediaan) | 3.8rata-rata 5T ≈4.3 | ≈4.3 | · | · | |
| Receivables Turnover (Perputaran Piutang) | 5.5rata-rata 5T ≈5.7 | ≈5.7 | · | · | |
| Revenue / Employee (Pendapatan Tahunan ÷ karyawan (jumlah karyawan, yfinance). Turunan — bukan konsep SEC-XBRL yang tersimpan.) | ≈$282.1K | · | · | · |
nilai · ≈ rata-rata 5T · median industri · penilaian relatif terhadap median
Dividen Yield, rasio pembayaran, riwayat dividen, CAGR 5 tahun
| Tanggal ex-dividen | Jumlah | Mata Uang | Imbal Hasil |
|---|---|---|---|
| Agu 7, 2026 | $1,10 | USD | ≈0.97% |
| Mei 8, 2026 | $1,10 | USD | ≈1.1% |
| Mar 10, 2026 | $1,10 | USD | ≈1.2% |
| Nov 5, 2025 | $1,04 | USD | ≈1.1% |
| Agu 7, 2025 | $1,04 | USD | ≈1.1% |
| Mei 5, 2025 | $1,04 | USD | ≈1.3% |
| Mar 10, 2025 | $1,04 | USD | ≈1.4% |
| Nov 4, 2024 | $0,94 | USD | ≈1.1% |
| Agu 5, 2024 | $0,94 | USD | ≈1.4% |
| Mei 3, 2024 | $0,94 | USD | ≈1.1% |
| Mar 8, 2024 | $0,94 | USD | ≈1.2% |
| Nov 3, 2023 | $0,86 | USD | ≈1.6% |
| Agu 4, 2023 | $0,86 | USD | ≈1.6% |
| Mei 5, 2023 | $0,86 | USD | ≈2.0% |
| Mar 3, 2023 | $0,86 | USD | ≈1.9% |
| Nov 9, 2022 | $0,81 | USD | ≈2.1% |
| Agu 11, 2022 | $0,81 | USD | ≈2.1% |
| Mei 12, 2022 | $0,81 | USD | ≈2.2% |
| Mar 10, 2022 | $0,81 | USD | ≈2.1% |
| Nov 10, 2021 | $0,76 | USD | ≈1.8% |
Riwayat Pendapatan EPS aktual vs perkiraan, kejutan %, tingkat keberhasilan, tanggal pendapatan berikutnya
| Periode | Laporan | EPS Aktual | EPS Estimasi | Kejutan |
|---|---|---|---|---|
| 30 Juni 2026 | Agu 3, 2026 | $3.15 | $3.10 | 1.6% |
| 31 Maret 2026 | $2.81 | $2.77 | 1.5% | |
| 31 Des. 2025 | $3.33 | $3.33 | 0.09% | |
| 30 Sep. 2025 | $3.07 | $3.08 | -0.42% | |
| 30 Juni 2025 | $2.95 | $2.95 | 0.03% | |
| 31 Maret 2025 | $2.72 | $2.73 | -0.48% |
Fundamental Lengkap Semua metrik per tahun — laporan laba rugi, neraca, arus kas
Laporan Laba Rugi
| Metrik | Tren | 2025 | 2024 | 2023 | 2022 | 2021 | 2020 | 2019 | 2018 | 2017 | 2016 | 2015 | 2014 |
|---|---|---|---|---|---|---|---|---|---|---|---|---|---|
| Revenue | $27.45B | $24.88B | $23.20B | $20.75B | $19.63B | $17.86B | $21.39B | $21.61B | $20.40B | $19.75B | $20.86B | $0 | |
| Cost of Revenue | $17.13B | $15.38B | $14.76B | $13.87B | $13.29B | $12.41B | $14.34B | $14.51B | $13.76B | $13.40B | $14.30B | $15.65B | |
| R&D Expense | $797M | $794M | $754M | $665M | $616M | $551M | $606M | $584M | $584M | $587M | $625M | $647M | |
| SG&A Expense | $4.31B | $4.08B | $3.79B | $3.23B | $3.26B | $3.08B | $3.58B | $3.55B | $3.53B | $3.46B | $3.60B | $3.81B | |
| Operating Income | · | · | · | · | · | · | $3.67B | $3.63B | $3.21B | $2.96B | $3.13B | $3.31B | |
| Interest Expense | · | · | · | · | $144M | $149M | $199M | · | · | · | · | · | |
| Other Non-op | $-37M | $64M | $93M | $36M | $-40M | $-150M | $-73M | $-9M | $-1M | $51M | $35M | $183M | |
| Pretax Income | $4.93B | $4.57B | $3.83B | $2.91B | $2.90B | $1.75B | $2.59B | $2.42B | $3.37B | $2.12B | $2.13B | $1.76B | |
| Income Tax | $841M | $768M | $604M | $445M | $750M | $331M | $378M | $278M | $382M | $199M | $159M | $-42M | |
| Net Income | $4.09B | $3.79B | $3.22B | $2.46B | $2.14B | $1.41B | $2.21B | $2.15B | $2.99B | $1.92B | $1.97B | $1.80B | |
| EPS (Basic) | $10.48 | $9.54 | $8.06 | $6.17 | $5.38 | $3.51 | $5.28 | $4.93 | $6.71 | $4.21 | $4.23 | $3.78 | |
| EPS (Diluted) | $10.45 | $9.50 | $8.02 | $6.14 | $5.34 | $3.49 | $5.25 | $4.91 | $6.68 | $4.20 | $4.22 | $3.76 | |
| Shares (Basic) | 389,900,000 | 397,600,000 | 399,100,000 | 398,700,000 | 398,700,000 | 402,200,000 | 419,000,000 | 434,300,000 | 444,500,000 | 455,000,000 | 465,500,000 | 474,100,000 | |
| Shares (Diluted) | 391,200,000 | 399,400,000 | 401,100,000 | 400,800,000 | 401,600,000 | 404,000,000 | 420,800,000 | 436,900,000 | 447,000,000 | 456,500,000 | 467,100,000 | 476,800,000 | |
| EBITDA | $1.01B | $921M | $926M | $954M | $922M | $811M | $4.56B | $4.53B | $4.13B | $3.89B | $4.06B | $4.29B |
Neraca
| Metrik | Tren | 2025 | 2024 | 2023 | 2022 | 2021 | 2020 | 2019 | 2018 | 2017 | 2016 | 2015 | 2014 |
|---|---|---|---|---|---|---|---|---|---|---|---|---|---|
| Cash & Equivalents | $622M | $555M | $488M | $294M | $297M | $438M | $370M | $283M | $561M | $543M | $268M | $781M | |
| Short-term Investments | $181M | $1.52B | $2.12B | $261M | $271M | $664M | $221M | $157M | $534M | $203M | $177M | $245M | |
| Receivables | $5.39B | $4.62B | $4.47B | $4.08B | $3.30B | $2.90B | $3.44B | $3.86B | $3.94B | $3.56B | $3.48B | $3.67B | |
| Inventory | $4.72B | $4.23B | $3.74B | $3.43B | $2.97B | $2.11B | $2.81B | $2.79B | $2.62B | $2.35B | $2.32B | $2.43B | |
| Prepaid Expense | $1.44B | $874M | $851M | $685M | $677M | $576M | $518M | $507M | $679M | $381M | $369M | $386M | |
| Current Assets | $12.36B | $11.80B | $11.68B | $8.75B | $7.51B | $9.18B | $8.73B | $7.59B | $8.34B | $7.03B | $6.62B | $8.10B | |
| PP&E (Net) | $4.32B | $3.73B | $3.53B | $3.15B | $3.06B | $2.96B | $3.50B | $3.47B | $3.50B | $3.44B | $3.56B | $3.75B | |
| PP&E (Gross) | $10.03B | $9.06B | $8.74B | $8.01B | $7.82B | $7.59B | $8.71B | $8.57B | $8.51B | $8.04B | $7.88B | $7.96B | |
| Accum. Depreciation | $5.71B | $5.33B | $5.21B | $4.87B | $4.75B | $4.62B | $5.21B | $5.11B | $5.00B | $4.60B | $4.32B | $4.21B | |
| Goodwill | $15.77B | $14.71B | $14.98B | $14.80B | $14.75B | $12.90B | $13.46B | $13.33B | $13.57B | $13.20B | $13.48B | $13.89B | |
| Intangibles | $5.05B | $4.66B | $5.09B | $5.49B | $5.86B | $4.17B | $4.64B | $4.85B | $5.26B | $5.51B | $6.01B | $6.56B | |
| Other Non-current Assets | $2.28B | $2.07B | $2.05B | $1.94B | $2.01B | $1.75B | $1.68B | $1.57B | $1.70B | $960M | $960M | $1.00B | |
| Total Assets | $41.25B | $38.38B | $38.43B | $35.01B | $34.03B | $31.82B | $32.80B | $31.09B | $32.62B | $30.48B | $31.06B | $33.49B | |
| Accounts Payable | $4.17B | $3.68B | $3.37B | $3.07B | $2.80B | $1.99B | $2.11B | $2.13B | $2.17B | $1.72B | $1.76B | $1.94B | |
| Short-term Debt | $1M | $0 | $8M | $324M | $13M | $1M | $255M | $414M | $6M | $14M | $426M | $2M | |
| Current Liabilities | $9.37B | $7.86B | $7.75B | $6.36B | $7.21B | $5.88B | $5.13B | $5.15B | $5.08B | $5.49B | $4.62B | $5.36B | |
| Capital Leases | $637M | $669M | $533M | $459M | $337M | $326M | $331M | $0 | · | · | · | · | |
| Deferred Tax | $265M | $275M | $402M | $530M | $559M | $277M | $396M | $349M | $538M | $321M | $390M | $901M | |
| Other Non-current Liabilities | $1.89B | $1.67B | $1.49B | $1.44B | $1.50B | $1.44B | $1.20B | $1.05B | $965M | $934M | $978M | $1.08B | |
| Long-term Debt | $9.89B | $9.15B | $9.26B | $8.33B | $8.57B | $8.06B | $8.07B | $7.11B | $7.75B | $8.26B | $7.99B | $9.03B | |
| Total Debt | $1M | $0 | $8M | $324M | $13M | $1M | $255M | $414M | $6M | $14M | $426M | $8.03B | |
| Retained Earnings | $10.70B | $10.10B | $10.30B | $8.47B | $7.59B | $6.79B | $8.17B | $8.16B | $8.67B | $7.55B | $7.35B | $7.08B | |
| AOCI | $-4.12B | $-4.34B | $-3.91B | $-3.95B | $-3.63B | $-4.20B | $-4.29B | $-4.14B | $-3.40B | $-4.45B | $-3.86B | $-2.90B | |
| Stockholders' Equity | $19.43B | $18.49B | $19.04B | $17.04B | $16.41B | $14.93B | $16.08B | $16.11B | $17.25B | $14.95B | $15.19B | $15.79B | |
| Liabilities + Equity | $41.25B | $38.38B | $38.43B | $35.01B | $34.03B | $31.82B | $32.80B | $31.09B | $32.62B | $30.48B | $31.00B | $33.53B | |
| Shares Outstanding | 387,900,000 | 392,900,000 | 399,400,000 | 397,800,000 | 398,800,000 | 398,100,000 | 413,300,000 | 423,600,000 | 439,900,000 | 449,400,000 | 458,800,000 | 467,900,000 |
Arus Kas
| Metrik | Tren | 2025 | 2024 | 2023 | 2022 | 2021 | 2020 | 2019 | 2018 | 2017 | 2016 | 2015 | 2014 |
|---|---|---|---|---|---|---|---|---|---|---|---|---|---|
| D&A | $1.01B | $921M | $926M | $954M | $922M | $811M | $884M | $903M | $914M | $929M | $925M | $983M | |
| Deferred Tax | $45M | $-154M | $-182M | $-128M | $-30M | $-125M | $-58M | $-139M | $24M | $-105M | $-199M | $-396M | |
| Amort. of Intangibles | · | · | $432M | $483M | $431M | $342M | $354M | $368M | $383M | $392M | $401M | $424M | |
| Restructuring | $133M | $202M | $57M | $33M | $78M | $214M | $0 | $0 | $116M | $211M | $129M | $54M | |
| Other Non-cash | $-666M | $-234M | $-338M | $-755M | $-873M | $848M | $412M | $-251M | $-1.26B | $-200M | $-341M | $-512M | |
| Operating Cash Flow | $4.47B | $4.33B | $3.62B | $2.53B | $2.16B | $2.94B | $3.45B | $2.66B | $2.67B | $2.57B | $2.41B | $1.88B | |
| CapEx | $919M | $808M | $757M | $598M | $575M | $389M | $587M | $565M | $520M | $497M | $506M | $632M | |
| Investing Cash Flow | $-1.10B | $-271M | $-2.58B | $-1.20B | $-1.76B | $397M | $-1.87B | $-398M | $-217M | $-529M | $-575M | $143M | |
| Stock Repurchased | $1.86B | $2.49B | $0 | $286M | $122M | $1.61B | $1.03B | $1.27B | $850M | $730M | $682M | $650M | |
| Net Stock Activity | $-1.86B | $-2.49B | $0 | $-286M | $-122M | $-1.61B | $-1.03B | $-1.27B | $-850M | $-730M | $-682M | $-650M | |
| Dividends Paid | $1.63B | $1.50B | $1.38B | $1.30B | $1.22B | $1.18B | $1.20B | $1.15B | $1.07B | $1.04B | $1.03B | $929M | |
| Financing Cash Flow | $-3.17B | $-3.94B | $-871M | $-1.34B | $-535M | $-3.26B | $-1.49B | $-2.58B | $-2.44B | $-1.74B | $-2.31B | $-2.13B | |
| Net Change in Cash | $67M | $67M | $194M | $-3M | $-141M | $68M | $87M | $-278M | $18M | $275M | $-513M | $-134M | |
| Free Cash Flow | $3.55B | $3.52B | $2.87B | $1.94B | $1.59B | $2.56B | $2.86B | $2.09B | $2.15B | $2.06B | $1.86B | $1.25B | |
| Levered FCF | · | · | · | · | $1.48B | $2.43B | $2.66B | · | · | · | · | · |
Profitabilitas
| Metrik | Tren | 2025 | 2024 | 2023 | 2022 | 2021 | 2020 | 2019 | 2018 | 2017 | 2016 | 2015 | 2014 |
|---|---|---|---|---|---|---|---|---|---|---|---|---|---|
| Operating Margin | · | · | · | · | · | · | 17.2% | 16.8% | 15.8% | · | · | · | |
| Net Margin | 14.9% | 15.2% | 13.9% | 11.9% | 10.9% | 7.9% | 10.3% | 9.9% | 14.6% | · | · | · | |
| Pretax Margin | 18.0% | 18.4% | 16.5% | 14.0% | 14.8% | 9.8% | 12.1% | 11.2% | 16.5% | · | · | · | |
| EBITDA Margin | 3.7% | 3.7% | 4.0% | 4.6% | 4.7% | 4.5% | 21.3% | 21.0% | 20.2% | · | · | · | |
| ROA | 10.3% | 9.9% | 8.8% | 7.1% | 6.5% | 4.4% | 6.9% | 6.7% | 9.5% | 6.3% | 6.1% | 5.2% | |
| ROE | 21.6% | 20.2% | 17.8% | 14.7% | 13.7% | 9.1% | 13.8% | 12.9% | 18.5% | 12.8% | 12.8% | 11.1% | |
| ROIC | · | · | · | · | · | · | 19.2% | 19.4% | 16.5% | 17.9% | 18.5% | 14.2% |
Likuiditas & Solvabilitas
| Metrik | Tren | 2025 | 2024 | 2023 | 2022 | 2021 | 2020 | 2019 | 2018 | 2017 | 2016 | 2015 | 2014 |
|---|---|---|---|---|---|---|---|---|---|---|---|---|---|
| Current Ratio | 1.3 | 1.5 | 1.5 | 1.4 | 1.0 | 1.6 | 1.7 | 1.5 | 1.6 | 1.3 | 1.4 | 1.5 | |
| Quick Ratio | 0.7 | 0.9 | 0.9 | 0.7 | 0.5 | 0.7 | 0.8 | 0.8 | 1.0 | 0.8 | 0.8 | 0.9 | |
| Debt / Equity | 0.0 | 0.0 | 0.0 | 0.0 | 0.0 | 0.0 | 0.0 | 0.0 | 0.0 | 0.0 | 0.0 | 0.5 | |
| LT Debt / Equity | · | · | · | · | · | · | · | · | · | · | · | 0.5 | |
| Interest Coverage | · | · | · | · | · | · | 15.6 | · | · | · | · | · |
Efisiensi
| Metrik | Tren | 2025 | 2024 | 2023 | 2022 | 2021 | 2020 | 2019 | 2018 | 2017 | 2016 | 2015 | 2014 |
|---|---|---|---|---|---|---|---|---|---|---|---|---|---|
| Asset Turnover | 0.7 | 0.6 | 0.6 | 0.6 | 0.6 | 0.6 | 0.7 | 0.7 | 0.6 | 0.0 | 0.0 | 0.0 | |
| Inventory Turnover | 3.8 | 3.9 | 4.1 | 4.3 | 5.2 | 5.1 | 5.1 | 5.4 | 5.5 | 5.9 | 6.0 | 6.5 | |
| Receivables Turnover | 5.5 | 5.5 | 5.4 | 5.6 | 6.3 | 5.6 | 5.9 | 5.6 | 5.4 | 0.0 | 0.0 | 0.0 |
Per Saham
| Metrik | Tren | 2025 | 2024 | 2023 | 2022 | 2021 | 2020 | 2019 | 2018 | 2017 | 2016 | 2015 | 2014 |
|---|---|---|---|---|---|---|---|---|---|---|---|---|---|
| Book Value / Share | $50.08 | $47.06 | $47.66 | $42.83 | $41.16 | $37.50 | $38.91 | $38.02 | $39.22 | $33.15 | $33.10 | $33.74 | |
| Revenue / Share | $70.16 | $62.29 | $57.83 | $51.78 | $48.87 | $44.20 | $50.83 | $49.46 | $45.65 | $0.00 | $0.00 | $0.00 | |
| Cash Flow / Share | $11.43 | $10.83 | $9.04 | $6.32 | $5.39 | $7.29 | $8.20 | $6.08 | $5.96 | $5.59 | $5.08 | $3.94 | |
| Cash / Share | $1.60 | $1.41 | $1.22 | $0.74 | $0.74 | $1.10 | $0.90 | $0.67 | $1.28 | $1.21 | $0.58 | $1.67 | |
| Dividend / Share | $4.16 | $3.76 | $3.44 | $3.24 | $3.04 | $2.92 | $2.84 | $2.64 | $2.40 | $2.28 | $2.20 | $1.96 | |
| EPS (TTM) | $10.45 | $9.50 | $8.02 | $6.14 | $5.34 | $3.49 | $5.25 | $4.91 | $6.68 | $4.20 | $4.22 | $3.76 |
Tingkat Pertumbuhan
| Metrik | Tren | 2025 | 2024 | 2023 | 2022 | 2021 | 2020 | 2019 | 2018 | 2017 | 2016 | 2015 | 2014 |
|---|---|---|---|---|---|---|---|---|---|---|---|---|---|
| Revenue YoY | 10.3% | 7.2% | 11.8% | 5.7% | 9.9% | · | · | · | · | · | · | · | |
| Revenue CAGR 3Y | 9.8% | 8.2% | 9.1% | · | · | · | · | · | · | · | · | · | |
| Revenue CAGR 5Y | 9.0% | · | · | · | · | · | · | · | · | · | · | · | |
| EPS YoY | 10.0% | 18.4% | 30.6% | 15.0% | 53.0% | · | · | · | · | · | · | · | |
| EPS CAGR 3Y | 19.4% | 21.2% | 32.0% | · | · | · | · | · | · | · | · | · | |
| EPS CAGR 5Y | 24.5% | · | · | · | · | · | · | · | · | · | · | · | |
| Net Income YoY | 7.7% | 17.9% | 30.7% | 14.8% | 52.1% | · | · | · | · | · | · | · | |
| Net Income CAGR 3Y | 18.4% | 21.0% | 31.7% | · | · | · | · | · | · | · | · | · | |
| Net Income CAGR 5Y | 23.7% | · | · | · | · | · | · | · | · | · | · | · | |
| Dividends Paid CAGR 5Y | 6.7% | · | · | · | · | · | · | · | · | · | · | · |
Valuasi (TTM)
| Metrik | Tren | 2025 | 2024 | 2023 | 2022 | 2021 | 2020 | 2019 | 2018 | 2017 | 2016 | 2015 | 2014 |
|---|---|---|---|---|---|---|---|---|---|---|---|---|---|
| Revenue TTM | $27.45B | $24.88B | $23.20B | $20.75B | $19.63B | $17.86B | $21.39B | $21.61B | $20.40B | $19.75B | $20.86B | $0 | |
| Net Income TTM | $4.09B | $3.79B | $3.22B | $2.46B | $2.14B | $1.41B | $2.21B | $2.15B | $2.99B | $1.92B | $1.97B | $1.80B | |
| Market Cap | $123.55B | $130.39B | $96.18B | $62.43B | $68.92B | $47.83B | $39.15B | $29.08B | $34.76B | $30.15B | $23.88B | $31.80B | |
| Enterprise Value | $122.75B | $128.31B | $93.58B | $62.20B | $68.37B | $46.73B | $38.81B | $29.06B | $33.67B | $29.42B | $23.86B | $38.80B | |
| P/E | 30.5 | 34.9 | 30.0 | 25.6 | 32.4 | 34.4 | 18.0 | 14.0 | 11.8 | 16.0 | 12.3 | 18.1 | |
| P/S | 4.5 | 5.2 | 4.1 | 3.0 | 3.5 | 2.7 | 1.8 | 1.3 | 1.7 | 1.5 | 1.1 | · | |
| P/B | 6.4 | 7.1 | 5.1 | 3.7 | 4.2 | 3.2 | 2.4 | 1.8 | 2.0 | 2.0 | 1.6 | 2.0 | |
| P / Cash Flow | 27.6 | 30.1 | 26.5 | 24.6 | 31.9 | 16.2 | 11.3 | 10.9 | 13.0 | 11.8 | 10.1 | 16.9 | |
| P / FCF | 34.8 | 37.1 | 33.5 | 32.3 | 43.4 | 18.7 | 13.7 | 13.9 | 16.2 | 14.7 | 12.8 | 25.5 | |
| EV / EBITDA | 122.0 | 139.3 | 101.1 | 65.2 | 74.1 | 57.6 | 8.5 | 6.4 | 8.2 | 7.6 | 5.9 | 9.0 | |
| EV / FCF | 34.5 | 36.5 | 32.6 | 32.1 | 43.1 | 18.3 | 13.6 | 13.9 | 15.7 | 14.3 | 12.8 | 31.1 | |
| EV / Revenue | 4.5 | 5.2 | 4.0 | 3.0 | 3.5 | 2.6 | 1.8 | 1.3 | 1.6 | 1.5 | 1.1 | · | |
| Dividend Yield | 1.3% | 1.1% | 1.4% | 2.1% | 1.8% | 2.5% | 3.1% | 4.0% | 3.1% | 3.4% | 4.3% | 2.9% | |
| Earnings Yield | 3.3% | 2.9% | 3.3% | 3.9% | 3.1% | 2.9% | 5.5% | 7.1% | 8.5% | 6.3% | 8.1% | 5.5% | |
| Payout Ratio | 39.8% | 39.5% | 42.9% | 52.8% | 56.9% | 83.3% | 54.3% | 53.6% | 35.8% | 53.9% | 51.8% | 51.5% | |
| Annual Payout | $1.63B | $1.50B | $1.38B | $1.30B | $1.22B | $1.18B | $1.20B | $1.15B | $1.07B | $1.04B | $1.03B | $929M |
Laporan Laba Rugi
| Metrik | Tren | Q2 2026 | Q1 2026 | Q4 2025 | Q3 2025 | Q2 2025 | Q1 2025 | Q4 2024 | Q3 2024 | Q2 2024 | Q1 2024 | Q4 2023 | Q3 2023 | Q2 2023 | Q1 2023 | Q4 2022 | Q3 2022 |
|---|---|---|---|---|---|---|---|---|---|---|---|---|---|---|---|---|---|
| Revenue | $8.53B | $7.45B | $7.05B | $6.99B | $7.03B | $6.38B | $6.24B | $6.34B | $6.35B | $5.94B | $5.97B | $5.88B | $5.87B | $5.48B | $5.38B | $5.31B | |
| Cost of Revenue | $5.68B | $4.80B | $4.46B | $4.31B | $4.43B | $3.93B | $3.81B | $3.90B | $3.94B | $3.73B | $3.73B | $3.68B | $3.75B | $3.60B | $3.55B | $3.54B | |
| R&D Expense | $227M | $211M | $204M | $203M | $192M | $198M | $202M | $207M | $196M | $189M | $201M | $187M | $187M | $179M | $167M | $165M | |
| SG&A Expense | $1.24B | $1.27B | $1.01B | $1.10B | $1.15B | $1.05B | $1.00B | $1.03B | $1.02B | $1.02B | $956M | $949M | $986M | $904M | $796M | $813M | |
| Other Non-op | $-47M | · | $-22M | $-25M | $1M | · | $-16M | $22M | $32M | $26M | $37M | $52M | $-7M | $11M | · | $-34M | |
| Pretax Income | $1.14B | $1.11B | $1.29B | $1.27B | $1.19B | $1.18B | $1.17B | $1.20B | $1.20B | $1.00B | $1.09B | $1.08B | $898M | $762M | $852M | $720M | |
| Income Tax | $321M | $240M | $162M | $264M | $203M | $212M | $195M | $193M | $201M | $179M | $141M | $187M | $153M | $123M | $128M | $112M | |
| Net Income | $821M | $866M | $1.13B | $1.01B | $982M | $964M | $971M | $1.01B | $993M | $821M | $945M | $891M | $744M | $638M | $722M | $607M | |
| EPS (Basic) | $2.11 | $2.23 | $2.90 | $2.60 | $2.52 | $2.46 | $2.46 | $2.54 | $2.49 | $2.05 | $2.37 | $2.23 | $1.86 | $1.60 | $1.81 | $1.52 | |
| EPS (Diluted) | $2.11 | $2.22 | $2.90 | $2.59 | $2.51 | $2.45 | $2.45 | $2.53 | $2.48 | $2.04 | $2.35 | $2.22 | $1.86 | $1.59 | $1.79 | $1.52 | |
| Shares (Basic) | 388,500,000 | 388,200,000 | · | 388,800,000 | 390,300,000 | 392,200,000 | · | 397,100,000 | 399,200,000 | 399,900,000 | · | 399,400,000 | 398,900,000 | 398,500,000 | · | 398,400,000 | |
| Shares (Diluted) | 389,500,000 | 389,200,000 | · | 390,100,000 | 391,400,000 | 393,600,000 | · | 398,900,000 | 401,000,000 | 401,900,000 | · | 401,600,000 | 400,700,000 | 400,500,000 | · | 400,300,000 | |
| EBITDA | · | $272M | · | · | · | $232M | · | · | · | $225M | · | · | · | $238M | · | · |
Neraca
| Metrik | Tren | Q2 2026 | Q1 2026 | Q4 2025 | Q3 2025 | Q2 2025 | Q1 2025 | Q4 2024 | Q3 2024 | Q2 2024 | Q1 2024 | Q4 2023 | Q3 2023 | Q2 2023 | Q1 2023 | Q4 2022 | Q3 2022 |
|---|---|---|---|---|---|---|---|---|---|---|---|---|---|---|---|---|---|
| Cash & Equivalents | $483M | $565M | $622M | $328M | $398M | $1.78B | $555M | $473M | $540M | $473M | · | $348M | $353M | $235M | · | $231M | |
| Short-term Investments | $212M | $186M | $181M | $237M | $186M | $162M | $1.52B | $1.52B | $2.24B | $1.97B | · | $1.56B | $977M | $289M | · | $287M | |
| Receivables | $6.67B | $6.37B | $5.39B | $5.56B | $5.49B | $5.09B | $4.62B | $4.89B | $4.86B | $4.67B | · | $4.46B | $4.40B | $4.24B | · | $3.82B | |
| Inventory | $5.42B | $5.15B | $4.72B | $4.61B | $4.58B | $4.39B | $4.23B | $4.18B | $3.96B | $3.87B | · | $3.71B | $3.67B | $3.60B | · | $3.43B | |
| Prepaid Expense | $1.99B | $1.74B | $1.44B | $1.40B | $1.25B | $1.01B | $874M | $1.09B | $1.05B | $870M | · | $904M | $904M | $772M | · | $778M | |
| Current Assets | $14.77B | $14.01B | $12.36B | $12.13B | $11.90B | $12.43B | $11.80B | $12.15B | $12.65B | $11.85B | · | $10.98B | $10.30B | $9.14B | · | $8.54B | |
| PP&E (Net) | $4.70B | $4.57B | $4.32B | $4.07B | $4.03B | $3.77B | $3.73B | $3.71B | $3.60B | $3.56B | $3.53B | $3.34B | $3.27B | $3.21B | $3.15B | $2.97B | |
| PP&E (Gross) | $10.54B | $10.32B | $10.03B | $9.72B | $9.63B | $9.16B | $9.06B | $9.11B | $8.85B | $8.79B | · | $8.40B | $8.34B | $8.20B | · | $7.67B | |
| Accum. Depreciation | $5.83B | $5.74B | $5.71B | $5.66B | $5.59B | $5.39B | $5.33B | $5.39B | $5.25B | $5.23B | · | $5.06B | $5.07B | $4.99B | · | $4.70B | |
| Goodwill | $20.23B | $21.40B | $15.77B | $15.81B | $15.79B | $14.85B | $14.71B | $15.04B | $14.85B | $14.88B | $14.98B | $14.78B | $14.91B | $14.89B | $14.80B | $14.48B | |
| Intangibles | $12.61B | $11.26B | $5.05B | $5.14B | $5.23B | $4.59B | $4.66B | $4.81B | $4.88B | $4.97B | $5.09B | $5.16B | $5.29B | $5.39B | $5.49B | $5.49B | |
| Other Non-current Assets | $2.42B | $2.42B | $2.28B | $2.25B | $2.23B | $2.15B | $2.07B | $2.15B | $2.11B | $2.07B | · | $2.08B | $2.06B | $1.98B | · | $1.95B | |
| Total Assets | $56.18B | $55.09B | $41.25B | $40.65B | $40.51B | $39.21B | $38.38B | $39.24B | $39.38B | $38.53B | $38.43B | $37.29B | $36.77B | $35.52B | $35.01B | $34.36B | |
| Accounts Payable | $5.42B | $4.91B | $4.17B | $3.83B | $3.76B | $3.65B | $3.68B | $3.61B | $3.50B | $3.40B | · | $3.25B | $3.19B | $3.12B | · | $2.94B | |
| Short-term Debt | $2.09B | $2.51B | $1M | $761M | $1.11B | $805M | $0 | $3M | $4M | $1M | · | $24M | $94M | $87M | · | $903M | |
| Current Liabilities | $11.91B | $11.74B | $9.37B | $9.47B | $9.59B | $9.52B | $7.86B | $7.94B | $8.12B | $7.61B | · | $7.56B | $6.72B | $6.09B | · | $6.65B | |
| Capital Leases | $715M | $704M | $637M | $568M | $587M | $669M | $669M | $681M | $656M | $601M | · | $486M | $482M | $466M | · | $447M | |
| Deferred Tax | $2.14B | $1.60B | $265M | $289M | $280M | $267M | $275M | $387M | $429M | $419M | · | $460M | $531M | $537M | · | $527M | |
| Other Non-current Liabilities | $1.85B | $1.91B | $1.89B | $1.77B | $1.73B | $1.70B | $1.67B | $1.50B | $1.48B | $1.48B | · | $1.43B | $1.43B | $1.42B | · | $1.49B | |
| Long-term Debt | $18.52B | $18.62B | $9.89B | $9.89B | $9.88B | $9.28B | $9.15B | $9.39B | $9.83B | $9.19B | · | $9.12B | $9.21B | $8.71B | · | $8.11B | |
| Total Debt | $2.09B | $2.51B | · | $761M | $1.11B | $805M | · | $3M | $4M | $1M | · | $24M | $94M | $87M | · | $903M | |
| Retained Earnings | $11.53B | $11.14B | $10.70B | $10.17B | $9.92B | $10.04B | $10.10B | $10.37B | $10.62B | $10.61B | · | $9.70B | $9.16B | $8.76B | · | $8.07B | |
| AOCI | $-4.15B | $-4.24B | $-4.12B | $-4.14B | $-4.09B | $-4.25B | $-4.34B | $-3.95B | $-4.07B | $-3.95B | · | $-3.93B | $-3.76B | $-3.81B | · | $-4.48B | |
| Stockholders' Equity | $20.25B | $19.72B | $19.43B | $18.84B | $18.61B | $18.51B | $18.49B | $19.12B | $19.22B | $19.29B | · | $18.38B | $17.95B | $17.45B | · | $16.07B | |
| Liabilities + Equity | $56.18B | $55.09B | $41.25B | $40.65B | $40.51B | $39.21B | $38.38B | $39.24B | $39.38B | $38.53B | · | $37.29B | $36.77B | $35.52B | · | $34.36B | |
| Shares Outstanding | 388,400,000 | 388,300,000 | 387,900,000 | 388,400,000 | 389,300,000 | 391,300,000 | 392,900,000 | 395,200,000 | 398,100,000 | 399,800,000 | · | 399,300,000 | 399,000,000 | 398,600,000 | · | 397,700,000 |
Arus Kas
| Metrik | Tren | Q2 2026 | Q1 2026 | Q4 2025 | Q3 2025 | Q2 2025 | Q1 2025 | Q4 2024 | Q3 2024 | Q2 2024 | Q1 2024 | Q4 2023 | Q3 2023 | Q2 2023 | Q1 2023 | Q4 2022 | Q3 2022 |
|---|---|---|---|---|---|---|---|---|---|---|---|---|---|---|---|---|---|
| D&A | $399M | $272M | $255M | $258M | $261M | $232M | $234M | $235M | $227M | $225M | $231M | $229M | $228M | $238M | $238M | $237M | |
| Amort. of Intangibles | · | · | · | · | · | · | · | $106M | $106M | $106M | · | $107M | $113M | $124M | · | $124M | |
| Restructuring | $24M | $39M | $238M | $55M | $24M | $18M | $70M | $54M | $15M | $63M | $11M | $7M | $29M | $10M | $-17M | $22M | |
| Other Non-cash | · | $-631M | · | · | · | $-958M | · | · | · | $-571M | · | · | · | $-541M | · | · | |
| Operating Cash Flow | $1.13B | $507M | $1.97B | $1.35B | $918M | $238M | $1.60B | $1.31B | $946M | $475M | $1.30B | $1.14B | $850M | $335M | $1.19B | $965M | |
| CapEx | $253M | $193M | $392M | $178M | $202M | $147M | $255M | $183M | $187M | $183M | $243M | $228M | $160M | $126M | $209M | $135M | |
| Investing Cash Flow | $-286M | $-11.38B | $-318M | $-293M | $-1.72B | $1.23B | $-271M | $511M | $-544M | $33M | $-793M | $-752M | $-906M | $-124M | $-217M | $-161M | |
| Stock Repurchased | $0 | $0 | $193M | $362M | $692M | $615M | $877M | $877M | $600M | $138M | $0 | $0 | $0 | $0 | $0 | $100M | |
| Net Stock Activity | · | $0 | · | · | · | $-615M | · | · | · | $-138M | · | · | · | $0 | · | · | |
| Dividends Paid | $443M | $415M | $404M | $404M | $421M | $397M | $370M | $374M | $388M | $368M | $344M | $343M | $358M | $334M | $322M | $323M | |
| Financing Cash Flow | $-922M | $10.80B | $-1.36B | $-1.11B | $-453M | $-244M | $-1.24B | $-1.85B | $-303M | $-536M | $-364M | $-394M | $168M | $-281M | $-895M | $-937M | |
| Net Change in Cash | $-81M | $-58M | $294M | $-70M | $-1.38B | $1.22B | $81M | $-66M | $67M | $-15M | $140M | $-5M | $118M | $-59M | $64M | $-133M | |
| Free Cash Flow | · | $314M | · | · | · | $91M | · | · | · | $292M | · | · | · | $209M | · | · |
Profitabilitas
| Metrik | Tren | Q2 2026 | Q1 2026 | Q4 2025 | Q3 2025 | Q2 2025 | Q1 2025 | Q4 2024 | Q3 2024 | Q2 2024 | Q1 2024 | Q4 2023 | Q3 2023 | Q2 2023 | Q1 2023 | Q4 2022 | Q3 2022 |
|---|---|---|---|---|---|---|---|---|---|---|---|---|---|---|---|---|---|
| Net Margin | 9.6% | 11.6% | · | 14.4% | 14.0% | 15.1% | · | 15.9% | 15.6% | 13.8% | · | 15.2% | 12.7% | 11.6% | · | 11.4% | |
| Pretax Margin | 13.4% | 14.9% | · | 18.2% | 16.9% | 18.5% | · | 19.0% | 18.8% | 16.8% | · | 18.4% | 15.3% | 13.9% | · | 13.6% | |
| EBITDA Margin | · | 3.6% | · | · | · | 3.6% | · | · | · | 3.8% | · | · | · | 4.3% | · | · | |
| ROA | 1.7% | 1.8% | · | 2.5% | 2.5% | 2.5% | · | 2.6% | 2.6% | 2.2% | · | 2.5% | 2.1% | 1.8% | · | 1.8% | |
| ROE | 4.2% | 4.5% | · | 5.3% | 5.2% | 5.1% | · | 5.4% | 5.3% | 4.5% | · | 5.2% | 4.3% | 3.8% | · | 3.8% |
Likuiditas & Solvabilitas
| Metrik | Tren | Q2 2026 | Q1 2026 | Q4 2025 | Q3 2025 | Q2 2025 | Q1 2025 | Q4 2024 | Q3 2024 | Q2 2024 | Q1 2024 | Q4 2023 | Q3 2023 | Q2 2023 | Q1 2023 | Q4 2022 | Q3 2022 |
|---|---|---|---|---|---|---|---|---|---|---|---|---|---|---|---|---|---|
| Current Ratio | 1.2 | 1.2 | · | 1.3 | 1.2 | 1.3 | · | 1.5 | 1.6 | 1.6 | · | 1.5 | 1.5 | 1.5 | · | 1.3 | |
| Quick Ratio | 0.6 | 0.6 | · | 0.6 | 0.6 | 0.7 | · | 0.9 | 0.9 | 0.9 | · | 0.8 | 0.9 | 0.8 | · | 0.7 | |
| Debt / Equity | 0.1 | 0.1 | · | 0.0 | 0.1 | 0.0 | · | 0.0 | 0.0 | 0.0 | · | 0.0 | 0.0 | 0.0 | · | 0.1 |
Efisiensi
| Metrik | Tren | Q2 2026 | Q1 2026 | Q4 2025 | Q3 2025 | Q2 2025 | Q1 2025 | Q4 2024 | Q3 2024 | Q2 2024 | Q1 2024 | Q4 2023 | Q3 2023 | Q2 2023 | Q1 2023 | Q4 2022 | Q3 2022 |
|---|---|---|---|---|---|---|---|---|---|---|---|---|---|---|---|---|---|
| Asset Turnover | 0.2 | 0.2 | · | 0.2 | 0.2 | 0.2 | · | 0.2 | 0.2 | 0.2 | · | 0.2 | 0.2 | 0.2 | · | 0.2 | |
| Inventory Turnover | 1.1 | 1.0 | · | 1.0 | 1.0 | 1.0 | · | 1.0 | 1.0 | 1.0 | · | 1.0 | 1.1 | 1.0 | · | 1.1 | |
| Receivables Turnover | 1.4 | 1.3 | · | 1.3 | 1.4 | 1.3 | · | 1.4 | 1.4 | 1.3 | · | 1.4 | 1.4 | 1.4 | · | 1.5 |
Per Saham
| Metrik | Tren | Q2 2026 | Q1 2026 | Q4 2025 | Q3 2025 | Q2 2025 | Q1 2025 | Q4 2024 | Q3 2024 | Q2 2024 | Q1 2024 | Q4 2023 | Q3 2023 | Q2 2023 | Q1 2023 | Q4 2022 | Q3 2022 |
|---|---|---|---|---|---|---|---|---|---|---|---|---|---|---|---|---|---|
| Book Value / Share | $52.15 | $50.79 | · | $48.51 | $47.79 | $47.29 | · | $48.37 | $48.28 | $48.25 | · | $46.04 | $44.99 | $43.78 | · | $40.40 | |
| Revenue / Share | $21.90 | $19.14 | · | $17.91 | $17.96 | $16.20 | · | $15.91 | $15.84 | $14.79 | · | $14.64 | $14.64 | $13.69 | · | $13.27 | |
| Cash Flow / Share | · | $1.30 | · | · | · | $0.60 | · | · | · | $1.18 | · | · | · | $0.84 | · | · | |
| Cash / Share | $1.24 | $1.46 | · | $0.84 | $1.02 | $4.54 | · | $1.20 | $1.36 | $1.18 | · | $0.87 | $0.88 | $0.59 | · | $0.58 | |
| Dividend / Share | $1.10 | $1.10 | $1.04 | $1.04 | $1.04 | $1.04 | $0.94 | $0.94 | $0.94 | $0.94 | $0.86 | $0.86 | $0.86 | $0.86 | $0.81 | $0.81 | |
| EPS (TTM) | $9.82 | $10.22 | · | $10.00 | $9.94 | $9.91 | · | $9.40 | $9.09 | $8.47 | · | $7.46 | $6.76 | $6.40 | · | $5.72 |
Valuasi (TTM)
| Metrik | Tren | Q2 2026 | Q1 2026 | Q4 2025 | Q3 2025 | Q2 2025 | Q1 2025 | Q4 2024 | Q3 2024 | Q2 2024 | Q1 2024 | Q4 2023 | Q3 2023 | Q2 2023 | Q1 2023 | Q4 2022 | Q3 2022 |
|---|---|---|---|---|---|---|---|---|---|---|---|---|---|---|---|---|---|
| Revenue TTM | $30.02B | $28.52B | · | $26.63B | $25.99B | $25.31B | · | $24.61B | $24.14B | $23.66B | · | $22.61B | $22.05B | $21.39B | · | $20.17B | |
| Net Income TTM | $3.83B | $3.99B | · | $3.93B | $3.93B | $3.94B | · | $3.77B | $3.65B | $3.40B | · | $3.00B | $2.71B | $2.57B | · | $2.29B | |
| Market Cap | $165.51B | $138.88B | · | $145.36B | $138.98B | $106.37B | · | $130.99B | $124.82B | $125.01B | · | $85.16B | $80.24B | $68.30B | · | $53.04B | |
| Enterprise Value | $166.90B | $140.64B | · | $145.55B | $139.50B | $105.23B | · | $128.99B | $122.05B | $122.57B | · | $83.28B | $79.00B | $67.86B | · | $53.42B | |
| P/E | 43.4 | 35.0 | · | 37.4 | 35.9 | 27.4 | · | 35.3 | 34.5 | 36.9 | · | 28.6 | 29.7 | 26.8 | · | 23.3 | |
| P/S | 5.5 | 4.9 | · | 5.5 | 5.3 | 4.2 | · | 5.3 | 5.2 | 5.3 | · | 3.8 | 3.6 | 3.2 | · | 2.6 | |
| P/B | 8.2 | 7.0 | · | 7.7 | 7.5 | 5.7 | · | 6.9 | 6.5 | 6.5 | · | 4.6 | 4.5 | 3.9 | · | 3.3 | |
| P / Cash Flow | · | 273.9 | · | · | · | 446.9 | · | · | · | 263.2 | · | · | · | 203.9 | · | · | |
| EV / Revenue | 5.6 | 4.9 | · | 5.5 | 5.4 | 4.2 | · | 5.2 | 5.1 | 5.2 | · | 3.7 | 3.6 | 3.2 | · | 2.6 | |
| Dividend Yield | 1.0% | 1.2% | · | 1.1% | 1.1% | 1.4% | · | 1.1% | 1.2% | 1.1% | · | 1.6% | 1.7% | 1.9% | · | 2.4% | |
| Earnings Yield | 2.3% | 2.9% | · | 2.7% | 2.8% | 3.6% | · | 2.8% | 2.9% | 2.7% | · | 3.5% | 3.4% | 3.7% | · | 4.3% | |
| Payout Ratio | · | 47.9% | · | · | · | 41.2% | · | · | · | 44.8% | · | · | · | 52.3% | · | · | |
| Annual Payout | $1.67B | $1.64B | · | $1.59B | $1.56B | $1.53B | · | $1.47B | $1.44B | $1.41B | · | $1.36B | $1.34B | $1.31B | · | $1.28B |
Periode terbaru di sebelah kiri · nilai null ditampilkan sebagai ·
Laporan Keuangan Laporan laba rugi, neraca, arus kas — tahunan, 5 tahun terakhir
| Metrik | 2025-12-31 | 2024-12-31 | 2023-12-31 | 2022-12-31 | 2021-12-31 |
|---|---|---|---|---|---|
| Pendapatan | $27.45B | $24.88B | $23.20B | $20.75B | $19.63B |
| Laba Bersih | $4.09B | $3.79B | $3.22B | $2.46B | $2.14B |
| EPS Dilusian | $10.45 | $9.50 | $8.02 | $6.14 | $5.34 |
| Metrik | 2025-12-31 | 2024-12-31 | 2023-12-31 | 2022-12-31 | 2021-12-31 |
|---|---|---|---|---|---|
| Utang / Ekuitas | 0.0 | 0.0 | 0.0 | 0.0 | 0.0 |
| Rasio Lancar | 1.3 | 1.5 | 1.5 | 1.4 | 1.0 |
| Rasio Cepat | 0.7 | 0.9 | 0.9 | 0.7 | 0.5 |
| Metrik | 2025-12-31 | 2024-12-31 | 2023-12-31 | 2022-12-31 | 2021-12-31 |
|---|---|---|---|---|---|
| Arus Kas Bebas | $3.55B | $3.52B | $2.87B | $1.94B | $1.59B |
Pemilik institusional (13F) 2.888 pengaju · $153.7B total · Per tanggal 30 Sep. 2026
Institusi yang melaporkan kepemilikan saham ini dalam SEC Form 13F triwulanan mereka. Hanya posisi panjang; satu pengaju dapat muncul dua kali untuk leg opsi terpisah. Kaki put/call offset yang besar biasanya mencerminkan pembuatan pasar atau inventaris yang dilindungi, bukan keyakinan arah.
| Posisi baru | Posisi yang keluar | Meningkat | Menurun | Perubahan bersih saham |
|---|---|---|---|---|
| 282 (-14 vs Kuartal sebelumnya) | 103 (-41 vs Kuartal sebelumnya) | 1.130 (+63 vs Kuartal sebelumnya) | 914 (+42 vs Kuartal sebelumnya) | +6.8M |
Dibandingkan dengan Q1 2026. Pengajuan Formulir 13F SEC jatuh tempo dalam waktu 45 hari setelah akhir kuartal ditambah kelonggaran singkat untuk pengaju terlambat — kuartal yang masih dalam jangka waktu tersebut dilewati demi pasangan terakhir yang dilaporkan sepenuhnya.
| Institusi | Nilai | Saham | % dari 13F yang dilacak | Tipe |
|---|---|---|---|---|
| BlackRock, Inc. | $13.071.633.412 | 30.675.945 | 8,51% | Saham |
| VANGUARD GROUP INC | $12.086.679.246 | 37.947.566 | 7,87% | Saham |
| VANGUARD CAPITAL MANAGEMENT LLC | $10.808.202.704 | 25.364.223 | 7,03% | Saham |
| STATE STREET CORP | $7.449.064.230 | 17.479.372 | 4,85% | Saham |
| JPMORGAN CHASE & CO | $6.852.689.843 | 16.785.110 | 4,46% | Saham |
| MORGAN STANLEY | $5.646.150.871 | 13.250.139 | 3,67% | Saham |
| BANK OF AMERICA CORP /DE/ | $4.719.725.602 | 11.076.048 | 3,07% | Saham |
| VANGUARD PORTFOLIO MANAGEMENT LLC | $4.007.415.285 | 9.404.429 | 2,61% | Saham |
| GEODE CAPITAL MANAGEMENT, LLC | $3.799.043.491 | 8.956.719 | 2,47% | Saham |
| FMR LLC | $3.550.231.669 | 8.331.531 | 2,31% | Saham |
| WELLINGTON MANAGEMENT GROUP LLP | $2.909.234.587 | 6.827.266 | 1,89% | Saham |
| RAYMOND JAMES FINANCIAL INC | $2.345.527.936 | 5.504.383 | 1,53% | Saham |
| UBS Group AG | $2.234.214.486 | 5.243.158 | 1,45% | Saham |
| Nuveen, LLC | $2.184.373.563 | 5.126.194 | 1,42% | Saham |
| GOLDMAN SACHS GROUP INC | $2.145.307.991 | 5.034.516 | 1,40% | Saham |
| COATUE MANAGEMENT LLC | $2.117.140.999 | 4.968.415 | 1,38% | Saham |
| MASSACHUSETTS FINANCIAL SERVICES CO /MA/ | $2.115.435.860 | 4.880.412 | 1,38% | Saham |
| NORGES BANK | $2.095.434.447 | 4.917.475 | 1,36% | Saham |
| NORTHERN TRUST CORP | $1.848.108.861 | 4.337.062 | 1,20% | Saham |
| JANUS HENDERSON GROUP PLC | $1.805.530.800 | 5.092.361 | 1,18% | Saham |
| ALLIANCEBERNSTEIN L.P. | $1.648.372.269 | 4.608.640 | 1,07% | Saham |
| Invesco Ltd. | $1.520.239.977 | 3.567.633 | 0,99% | Saham |
| UBS AM, a distinct business unit of UBS ASSET MANAGEMENT AMERICAS LLC | $1.394.068.897 | 3.897.640 | 0,91% | Saham |
| WELLS FARGO & COMPANY/MN | $1.335.979.731 | 3.135.220 | 0,87% | Saham |
| FIRST TRUST ADVISORS LP | $1.331.921.397 | 3.125.697 | 0,87% | Saham |
| Bank of New York Mellon Corp | $1.137.263.869 | 2.668.882 | 0,74% | Saham |
| AMERIPRISE FINANCIAL INC | $1.132.003.739 | 2.656.634 | 0,74% | Saham |
| Clearbridge Investments, LLC | $1.129.035.455 | 2.649.571 | 0,73% | Saham |
| ROYAL BANK OF CANADA | $1.061.733.000 | 2.491.633 | 0,69% | Saham |
| CHARLES SCHWAB INVESTMENT MANAGEMENT INC | $1.010.231.234 | 2.370.767 | 0,66% | Saham |
| Legal & General Group Plc | $970.540.292 | 2.277.622 | 0,63% | Saham |
| VANGUARD FIDUCIARY TRUST CO | $932.469.447 | 2.188.279 | 0,61% | Saham |
| Amundi | $924.408.449 | 2.169.404 | 0,60% | Saham |
| DEUTSCHE BANK AG\ | $871.307.168 | 2.044.746 | 0,57% | Saham |
| ENVESTNET ASSET MANAGEMENT INC | $643.326.690 | 1.509.735 | 0,42% | Saham |
| Fayez Sarofim & Co | $631.962.691 | 1.483.063 | 0,41% | Saham |
| NEUBERGER BERMAN GROUP LLC | $625.415.422 | 1.467.698 | 0,41% | Saham |
| JANE STREET GROUP, LLC | $607.604.508 | 1.425.900 | 0,40% | Opsi jual |
| STIFEL FINANCIAL CORP | $606.707.210 | 1.423.712 | 0,39% | Saham |
| Sumitomo Mitsui Trust Group, Inc. | $573.283.525 | 1.345.357 | 0,37% | Saham |
| VICTORY CAPITAL MANAGEMENT INC | $568.525.631 | 1.334.139 | 0,37% | Saham |
| MIRAE ASSET GLOBAL ETFS HOLDINGS Ltd. | $560.333.038 | 1.315.571 | 0,36% | Saham |
| SCHRODER INVESTMENT MANAGEMENT GROUP | $557.653.356 | 1.365.927 | 0,36% | Saham |
| FRANKLIN RESOURCES INC | $514.082.154 | 1.206.426 | 0,33% | Saham |
| DIMENSIONAL FUND ADVISORS LP | $511.233.110 | 1.200.251 | 0,33% | Saham |
| 1832 Asset Management L.P. | $497.591.829 | 1.167.727 | 0,32% | Saham |
| Swiss National Bank | $466.311.638 | 1.094.320 | 0,30% | Saham |
| VOYA INVESTMENT MANAGEMENT LLC | $449.795.227 | 1.055.560 | 0,29% | Saham |
| Pictet Asset Management Holding SA | $437.130.941 | 1.025.840 | 0,28% | Saham |
| SUSQUEHANNA INTERNATIONAL GROUP, LLP | $422.668.428 | 991.900 | 0,28% | Opsi beli |
Orang dalam perusahaan 54 orang dalam · 31 pejabat · 23 direktur
| Orang Dalam | Peran | Aktivitas terakhir | Saham dimiliki | Beli 12m | Jual 12m | Bersih 12m |
|---|---|---|---|---|---|---|
| Sternadt Paulo Ruiz | Chief Executive Officer of Eaton Corporation, a subsidiary of the Issuer. | 20 Maret 2026 A | 33.508 | 0 | 1 | $-4.178.514 |
| Craig Arnold | Chief Executive Officer of Eaton Corporation, a subsidiary of the Issuer. | 12 Mei 2025 M | 490.208 | 0 | 0 | $0 |
| Alexander M Cutler | Chief Executive Officer of Eaton Corporation, a subsidiary of the Issuer | 11 Mei 2016 M | 497.177 | 0 | 0 | $0 |
| David B Foster | Executive Vice President and Chief Financial Officer of Eaton Corporation, a subsidiary of the Issuer. | 1 April 2026 A | · | 0 | 0 | $0 |
| Olivier Leonetti | Former Executive Vice President and Chief Financial Officer of Eaton Corporation, a subsidiary of the Issuer. | 27 Feb. 2026 M | 3.511 | 0 | 0 | $0 |
| Shawn M Black | President - Aerospace Group of Eaton Corporation, a subsidiary of the Issuer. | 1 Sep. 2026 A | · | 0 | 0 | $0 |
| Antonio Galvao | President - Mobility Group of Eaton Corporation, a subsidiary of the Issuer. | 13 Mei 2026 S | 9.175 | 0 | 1 | $-200.495 |
| Peter Denk | President and Chief Operating Officer - Industrial Sector of Eaton Corporation, a subsidiary of the Issuer. | 6 Mei 2026 S | 7.102 | 0 | 1 | $-835.880 |
| John Sapp | President - Aerospace Group of Eaton Corporation, a subsidiary of the Issuer. | 28 Feb. 2025 M | 725 | 0 | 0 | $0 |
| Nandakumar Cheruvatath | President - Aerospace Group of Eaton Corporation, a subsidiary of the Issuer. | 19 Maret 2024 I | 2.407 | 0 | 0 | $0 |
| Joao V Faria | President - Vehicle Group of Eaton Corporation, a subsidiary of the Issuer. | 9 Maret 2023 S | 68.814 | 0 | 0 | $0 |
| Brian S Brickhouse | President - Americas Region, Electrical Sector of Eaton Corporation, a subsidiary of the Issuer. | 3 Maret 2023 M | 16.358 | 0 | 0 | $0 |
| Uday Yadav | President and Chief Operating Officer - Electrical Sector of Eaton Corporation, a subsidiary of the Issuer. | 25 Feb. 2022 M | 38.831 | 0 | 0 | $0 |
| Curtis J Hutchins | President - Hydraulics Group of Eaton Corporation, a subsidiary of the Issuer. | 13 Maret 2019 S | 19.645 | 0 | 0 | $0 |
| Richard M. Eubanks | President - Electrical Products Group of Eaton Corporation, a subsidiary of the Issuer. | 12 Maret 2019 M | 20.974 | 0 | 0 | $0 |
| Revathi Advaithi | President and Chief Operating Officer - Electrical Sector of Eaton Corporation, a subsidiary of the Issuer. | 30 Agu 2018 S | 24.715 | 0 | 0 | $0 |
| William J Vanlandingham II | President - Electrical Systems and Services Group of Eaton Corporation, a subsidiary of the Issuer. | 15 Juni 2018 F | 13.390 | 0 | 0 | $0 |
| Thomas Gross | Vice Chairman and Chief Operating Officer - Electrical Sector of Eaton Corporation, a subsidiary of the Issuer | 23 Juli 2015 M | 34.942 | 0 | 0 | $0 |
| Adam A Wadecki | Former Senior Vice President and Controller of Eaton Corporation, a subsidiary of the Issuer. | 2 Okt. 2026 M | 1.661 | 0 | 1 | $-231.284 |
| Dougherty Lucy Clark | Executive Vice President and Chief Legal Officer of Eaton Corporation, a subsidiary of the Issuer. | 26 Feb. 2026 M | 1.340 | 0 | 0 | $0 |
| Kaled Awada | Executive Vice President and Chief Human Resources Officer of Eaton Corporation, a subsidiary of the Issuer. | 25 Feb. 2026 A | · | 0 | 0 | $0 |
| Ernest W Marshall JR | Executive Vice President and Chief Human Resources Officer of Eaton Corporation, a subsidiary of the Issuer. | 7 Mei 2025 M | 36.021 | 0 | 0 | $0 |
| Taras G. Szmagala Jr. | Executive Vice President and Chief Legal Officer of Eaton Corporation, a subsidiary of the Issuer. | 28 Feb. 2025 M | 14.248 | 0 | 0 | $0 |
| Daniel Roy Hopgood | Senior Vice President and Controller of Eaton Corporation of Eaton Corporation, a subsidiary of the Issuer. | 28 Feb. 2024 A | 10.321 | 0 | 0 | $0 |
| Boise April Miller | Executive Vice President, Chief Legal Officer and Secretary of Eaton Corporation, a subsidiary of the Issuer. | 27 Mei 2022 M | 11.900 | 0 | 0 | $0 |
| Richard H Fearon | Vice Chairman and Chief Financial and Planning Officer of Eaton Corporation, a subsidiary of the Issuer. | 4 Maret 2021 M | 147.692 | 0 | 0 | $0 |
| Ken D Semelsberger | Senior Vice President and Controller of Eaton Corporation, a subsidiary of the Issuer. | 26 Feb. 2021 M | 57.162 | 0 | 0 | $0 |
| Thomas E. Moran | Sr VP and Secretary | 27 Feb. 2019 A | 14.219 | 0 | 0 | $0 |
| Cynthia K Brabander | Executive Vice President & Chief Human Resources Officer of Eaton Corporation, a subsidiary of the Issuer | 27 Feb. 2018 A | 21.459 | 0 | 0 | $0 |
| Mark M Mcguire | Executive Vice President, General Counsel and Secretary of Eaton Corporation, a subsidiary of the Issuer | 24 Feb. 2017 M | 35.325 | 0 | 0 | $0 |
| Billie K Rawot | Senior Vice President and Controller of Eaton Corporation, a subsidiary of the Issuer | 23 Juli 2013 M | 100.353 | 0 | 0 | $0 |
| Dorothy C Thompson | Direktur | 22 Mei 2026 S | 1.096 | 0 | 1 | $-64.295 |
| Andre Schulten | Direktur | 6 Mei 2026 A | 666 | 0 | 0 | $0 |
| Silvio Napoli | Direktur | 6 Mei 2026 A | 1.756 | 0 | 0 | $0 |
| Darryl L. Wilson | Direktur | 6 Mei 2026 A | 1.788 | 0 | 0 | $0 |
| Sandra Pianalto | Direktur | 6 Mei 2026 A | 2.488 | 0 | 0 | $0 |
| Robert V Pragada | Direktur | 6 Mei 2026 A | 1.688 | 0 | 0 | $0 |
| Lori Ryerkerk | Direktur | 6 Mei 2026 A | 2.288 | 0 | 0 | $0 |
| Karenann K Terrell | Direktur | 6 Mei 2026 A | 1.285 | 0 | 0 | $0 |
| Gregory R Page | Direktur | 6 Mei 2026 A | 44.090 | 0 | 0 | $0 |
| Gerald B Smith | Direktur | 6 Mei 2025 A | 3.006 | 0 | 0 | $0 |
| Deborah L Mccoy | Direktur | 5 Agu 2022 S | 12.856 | 0 | 0 | $0 |
| Christopher M Connor | Direktur | 27 April 2022 A | 15.590 | 0 | 0 | $0 |
| Michael J Critelli | Direktur | 23 Feb. 2021 A | 28.066 | 0 | 0 | $0 |
| Todd M Bluedorn | Direktur | 25 Feb. 2020 A | 6.536 | 0 | 0 | $0 |
| Charles E Golden | Direktur | 26 Feb. 2019 A | 18.103 | 0 | 0 | $0 |
| Arthur E Johnson | Direktur | 26 Feb. 2019 A | 9.590 | 0 | 0 | $0 |
| Linda A Hill | Direktur | 21 Feb. 2017 A | 7.410 | 0 | 0 | $0 |
| Ned C Lautenbach | Direktur | 23 Feb. 2016 A | 70.738 | 0 | 0 | $0 |
| George S Barrett | Direktur | 28 Jan. 2015 A | 4.288 | 0 | 0 | $0 |
| Gerald Johnson | · | 13 Agu 2026 P | 1.829 | 6 | 0 | $588.771 |
| Heath B. Monesmith | · | 11 Agu 2026 M | 51.174 | 0 | 2 | $-15.775.332 |
| Michael Yelton | · | 6 Agu 2026 M | 2.533 | 0 | 1 | $-1.307.245 |
| Thomas B Okray | · | 1 Feb. 2024 M | 12.977 | 0 | 0 | $0 |
Orang dalam dari pengajuan SEC Form 3/4/5; bersih = hanya P/S pasar terbuka
Kepemilikan ETF Dimiliki oleh 124 ETF
Bobot mencerminkan kepemilikan ekuitas langsung (N-PORT) saja; dana berbasis leverage atau derivatif mungkin memiliki eksposur swap tambahan yang tidak ditampilkan.
| Dana | Bobot | Unit | Per tanggal | Sumber |
|---|---|---|---|---|
| POWR · iShares, Inc. | 6,73% | 75.062 SH | 11 Sep. 2026 | Harian |
| SUPP · TCW ETF Trust | 6,37% | 1.831 NS | 31 Juli 2026 | N-PORT |
| MADE · iShares Trust | 4,45% | 6.443 SH | 11 Sep. 2026 | Harian |
| ZAP · Global X Funds | 4,21% | 46.833 NS | 31 Juli 2026 | N-PORT |
| GRW · TCW ETF Trust | 3,79% | 5.910 NS | 31 Juli 2026 | N-PORT |
| IBAT · iShares Trust | 3,53% | 5.954 SH | 11 Sep. 2026 | Harian |
| AIFD · TCW ETF Trust | 2,66% | 8.034 NS | 31 Juli 2026 | N-PORT |
| VIS · VANGUARD WORLD FUND | 2,21% | 471.133 SH | 19 Agu 2026 | Harian |
| DUSL · Direxion Shares ETF Trust | 2,11% | 2.869 NS | 31 Juli 2026 | N-PORT |
| IYJ · iShares Trust | 1,99% | 92.310 SH | 11 Sep. 2026 | Harian |
| NUDV · Nushares ETF Trust | 1,78% | 2.146 NS | 31 Juli 2026 | N-PORT |
| PPA · Invesco Exchange-Traded Fund Trust | 1,76% | 349.078 SH | 23 Okt. 2026 | Harian |
| RUNN · Strategic Trust | 1,62% | 16.798 NS | 31 Agu 2026 | N-PORT |
| EXI · iShares Trust | 1,61% | 55.787 SH | 11 Sep. 2026 | Harian |
| NULV · Nushares ETF Trust | 1,52% | 80.783 NS | 31 Juli 2026 | N-PORT |
| NULC · Nushares ETF Trust | 1,42% | 2.406 NS | 31 Juli 2026 | N-PORT |
| PWRD · TCW ETF Trust | 1,34% | 46.777 NS | 31 Juli 2026 | N-PORT |
| NPFE · Elevation Series Trust | 1,20% | 18.856 NS | 31 Juli 2026 | N-PORT |
| RSPN · Invesco Exchange-Traded Fund Trust | 1,07% | 21.082 SH | 23 Okt. 2026 | Harian |
| NUGO · Nushares ETF Trust | 1,04% | 60.984 NS | 31 Juli 2026 | N-PORT |
| XOEF · iShares Trust | 0,90% | 488 SH | 11 Sep. 2026 | Harian |
| MGV · VANGUARD WORLD FUND | 0,78% | 244.061 SH | 19 Agu 2026 | Harian |
| SPHB · Invesco Exchange-Traded Fund Trust … | 0,78% | 16.971 SH | 23 Okt. 2026 | Harian |
| VIG · VANGUARD SPECIALIZED FUNDS | 0,72% | 2.193.691 SH | 19 Agu 2026 | Harian |
| PDP · Invesco Exchange-Traded Fund Trust | 0,70% | 26.731 SH | 23 Okt. 2026 | Harian |
| VYM · VANGUARD WHITEHALL FUNDS | 0,69% | 1.551.092 SH | 19 Agu 2026 | Harian |
| GTOS · Invesco Actively Managed Exchange-T… | 0,67% | 857.000 | 23 Okt. 2026 | Harian |
| USXF · iShares Trust | 0,64% | 23.067 SH | 11 Sep. 2026 | Harian |
| VTV · VANGUARD INDEX FUNDS | 0,62% | 3.692.785 SH | 19 Agu 2026 | Harian |
| ACVF · ETF Opportunities Trust | 0,59% | 2.161 NS | 31 Juli 2026 | N-PORT |
| VOOV · VANGUARD ADMIRAL FUNDS | 0,57% | 89.426 SH | 19 Agu 2026 | Harian |
| IVE · iShares Trust | 0,53% | 645.072 SH | 11 Sep. 2026 | Harian |
| HIBL · Direxion Shares ETF Trust | 0,53% | 961 NS | 31 Juli 2026 | N-PORT |
| IUSV · iShares Trust | 0,50% | 339.491 SH | 11 Sep. 2026 | Harian |
| PFM · Invesco Exchange-Traded Fund Trust | 0,50% | 11.023 SH | 23 Okt. 2026 | Harian |
| IWX · iShares Trust | 0,50% | 47.463 SH | 11 Sep. 2026 | Harian |
| SUSL · iShares Trust | 0,47% | 13.705 SH | 11 Sep. 2026 | Harian |
| DYNF · BlackRock ETF Trust | 0,46% | 464.992 SH | 11 Sep. 2026 | Harian |
| BSCS · Invesco Exchange-Traded Self-Indexe… | 0,46% | 16.223.000 | 23 Okt. 2026 | Harian |
| DSI · iShares Trust | 0,45% | 59.348 SH | 11 Sep. 2026 | Harian |
| XT · iShares Trust | 0,44% | 41.861 SH | 11 Sep. 2026 | Harian |
| AQLT · iShares Trust | 0,42% | 3.378 SH | 11 Sep. 2026 | Harian |
| LRGF · iShares Trust | 0,41% | 36.890 SH | 11 Sep. 2026 | Harian |
| VONV · VANGUARD SCOTTSDALE FUNDS | 0,39% | 198.342 SH | 19 Agu 2026 | Harian |
| EGLE · Global X Funds | 0,38% | 20 NS | 31 Juli 2026 | N-PORT |
| DGRO · iShares Trust | 0,38% | 394.177 SH | 11 Sep. 2026 | Harian |
| OMFL · Invesco Exchange-Traded Self-Indexe… | 0,37% | 47.420 SH | 23 Okt. 2026 | Harian |
| IWD · iShares Trust | 0,36% | 730.067 SH | 11 Sep. 2026 | Harian |
| BSCT · Invesco Exchange-Traded Self-Indexe… | 0,33% | 10.351.000 | 23 Okt. 2026 | Harian |
| CATH · Global X Funds | 0,32% | 9.982 NS | 31 Juli 2026 | N-PORT |
| MGC · VANGUARD WORLD FUND | 0,31% | 77.698 SH | 19 Agu 2026 | Harian |
| USCL · iShares Trust | 0,30% | 20.550 SH | 11 Sep. 2026 | Harian |
| EVUS · iShares Trust | 0,30% | 2.749 SH | 11 Sep. 2026 | Harian |
| TOPC · iShares Trust | 0,29% | 235 SH | 11 Sep. 2026 | Harian |
| DFVX · Dimensional ETF Trust | 0,29% | 3.684 NS | 31 Juli 2026 | N-PORT |
| IWL · iShares Trust | 0,28% | 15.108 SH | 11 Sep. 2026 | Harian |
| ILCV · iShares Trust | 0,28% | 9.203 SH | 11 Sep. 2026 | Harian |
| CHRI · Global X Funds | 0,28% | 54 NS | 31 Juli 2026 | N-PORT |
| XVV · iShares Trust | 0,27% | 4.469 SH | 11 Sep. 2026 | Harian |
| VOO · VANGUARD INDEX FUNDS | 0,26% | 10.085.661 SH | 19 Agu 2026 | Harian |
| VV · VANGUARD INDEX FUNDS | 0,26% | 453.499 SH | 19 Agu 2026 | Harian |
| XTR · Global X Funds | 0,26% | 30 NS | 31 Juli 2026 | N-PORT |
| XCLR · Global X Funds | 0,26% | 22 NS | 31 Juli 2026 | N-PORT |
| XYLD · Global X Funds | 0,25% | 19.753 NS | 31 Juli 2026 | N-PORT |
| XRMI · Global X Funds | 0,25% | 303 NS | 31 Juli 2026 | N-PORT |
| VOTE · TCW ETF Trust | 0,25% | 6.572 NS | 31 Juli 2026 | N-PORT |
| XYLG · Global X Funds | 0,25% | 383 NS | 31 Juli 2026 | N-PORT |
| IVV · iShares Trust | 0,24% | 4.894.108 SH | 11 Sep. 2026 | Harian |
| VONE · VANGUARD SCOTTSDALE FUNDS | 0,24% | 64.260 SH | 19 Agu 2026 | Harian |
| ILCB · iShares Trust | 0,24% | 7.546 SH | 11 Sep. 2026 | Harian |
| DFUS · Dimensional ETF Trust | 0,24% | 118.160 NS | 31 Juli 2026 | N-PORT |
| ESGU · iShares Trust | 0,23% | 101.918 SH | 11 Sep. 2026 | Harian |
| QVML · Invesco Exchange-Traded Fund Trust … | 0,23% | 10.751 SH | 23 Okt. 2026 | Harian |
| SPUU · Direxion Shares ETF Trust | 0,23% | 1.465 NS | 31 Juli 2026 | N-PORT |
| VTI · VANGUARD INDEX FUNDS | 0,23% | 12.329.586 SH | 19 Agu 2026 | Harian |
| VTHR · VANGUARD SCOTTSDALE FUNDS | 0,23% | 32.721 SH | 19 Agu 2026 | Harian |
| IYY · iShares Trust | 0,23% | 16.685 SH | 11 Sep. 2026 | Harian |
| IWB · iShares Trust | 0,23% | 268.865 SH | 11 Sep. 2026 | Harian |
| PFIG · Invesco Exchange-Traded Fund Trust … | 0,22% | 300.000 | 23 Okt. 2026 | Harian |
| GLOF · iShares Trust | 0,22% | 1.084 SH | 11 Sep. 2026 | Harian |
| SUSA · iShares Trust | 0,22% | 21.567 SH | 11 Sep. 2026 | Harian |
| PBP · Invesco Exchange-Traded Fund Trust | 0,22% | 2.329 SH | 23 Okt. 2026 | Harian |
| IWV · iShares Trust | 0,22% | 107.224 SH | 11 Sep. 2026 | Harian |
| PBUS · Invesco Exchange-Traded Fund Trust … | 0,22% | 62.237 SH | 23 Okt. 2026 | Harian |
| ITOT · iShares Trust | 0,22% | 505.122 SH | 11 Sep. 2026 | Harian |
| HCMT · Direxion Shares ETF Trust | 0,20% | 2.700 NS | 31 Juli 2026 | N-PORT |
| SIZE · iShares Trust | 0,20% | 2.053 SH | 11 Sep. 2026 | Harian |
| EUSA · iShares, Inc. | 0,20% | 9.186 SH | 11 Sep. 2026 | Harian |
| ILCG · iShares Trust | 0,20% | 14.856 SH | 11 Sep. 2026 | Harian |
| SPXL · Direxion Shares ETF Trust | 0,19% | 30.360 NS | 31 Juli 2026 | N-PORT |
| TOK · iShares Trust | 0,19% | 1.076 SH | 11 Sep. 2026 | Harian |
| CRBN · iShares Trust | 0,18% | 5.263 SH | 11 Sep. 2026 | Harian |
| PHDG · Invesco Actively Managed Exchange-T… | 0,18% | 306 SH | 23 Okt. 2026 | Harian |
| URTH · iShares, Inc. | 0,17% | 34.848 SH | 11 Sep. 2026 | Harian |
| RSP · Invesco Exchange-Traded Fund Trust | 0,17% | 472.914 SH | 23 Okt. 2026 | Harian |
| IUS · Invesco Exchange-Traded Self-Indexe… | 0,17% | 4.700 SH | 23 Okt. 2026 | Harian |
| DFAU · Dimensional ETF Trust | 0,17% | 50.317 NS | 31 Juli 2026 | N-PORT |
| BSCR · Invesco Exchange-Traded Self-Indexe… | 0,16% | 7.272.000 | 23 Okt. 2026 | Harian |
| ACWI · iShares Trust | 0,15% | 123.680 SH | 11 Sep. 2026 | Harian |
| DFSU · Dimensional ETF Trust | 0,14% | 7.708 NS | 31 Juli 2026 | N-PORT |
| VT · VANGUARD INTERNATIONAL EQUITY INDEX… | 0,14% | 326.075 SH | 19 Agu 2026 | Harian |
| BSCU · Invesco Exchange-Traded Self-Indexe… | 0,13% | 3.784.000 | 22 Okt. 2026 | Harian |
| RWL · Invesco Exchange-Traded Fund Trust … | 0,13% | 36.737 SH | 23 Okt. 2026 | Harian |
| PRF · Invesco Exchange-Traded Fund Trust | 0,13% | 35.488 SH | 23 Okt. 2026 | Harian |
| GTO · Invesco Actively Managed Exchange-T… | 0,11% | 3.470.000 | 23 Okt. 2026 | Harian |
| DCOR · Dimensional ETF Trust | 0,11% | 8.503 NS | 31 Juli 2026 | N-PORT |
| EGUS · iShares Trust | 0,10% | 66 SH | 11 Sep. 2026 | Harian |
| IWY · iShares Trust | 0,09% | 33.004 SH | 11 Sep. 2026 | Harian |
| DFAC · Dimensional ETF Trust | 0,08% | 93.222 NS | 31 Juli 2026 | N-PORT |
| VONG · VANGUARD SCOTTSDALE FUNDS | 0,08% | 95.234 SH | 19 Agu 2026 | Harian |
| IWF · iShares Trust | 0,07% | 225.754 SH | 11 Sep. 2026 | Harian |
| DFLV · Dimensional ETF Trust | 0,07% | 11.067 NS | 31 Juli 2026 | N-PORT |
| DXUV · Dimensional ETF Trust | 0,05% | 612 NS | 31 Juli 2026 | N-PORT |
| EQAL · Invesco Exchange-Traded Fund Trust … | 0,04% | 854 SH | 23 Okt. 2026 | Harian |
| DFUV · Dimensional ETF Trust | 0,03% | 9.594 NS | 31 Juli 2026 | N-PORT |
| BIV · VANGUARD BOND INDEX FUNDS | · | · | 15 Juli 2026 | Harian |
| BLV · VANGUARD BOND INDEX FUNDS | · | · | 15 Juli 2026 | Harian |
| BSV · VANGUARD BOND INDEX FUNDS | · | · | 15 Juli 2026 | Harian |
| BND · VANGUARD BOND INDEX FUNDS | · | · | 15 Juli 2026 | Harian |
| VCSH · VANGUARD SCOTTSDALE FUNDS | · | · | 15 Juli 2026 | Harian |
| VCIT · VANGUARD SCOTTSDALE FUNDS | · | · | 15 Juli 2026 | Harian |
| VCLT · VANGUARD SCOTTSDALE FUNDS | · | · | 15 Juli 2026 | Harian |
| VTC · VANGUARD SCOTTSDALE FUNDS | · | · | 30 Juli 2026 | Harian |
| BNDW · VANGUARD SCOTTSDALE FUNDS | · | · | 30 Juli 2026 | Harian |
ETN Konsensus Analis Opini analis bullish dan bearish, target harga 12 bulan, potensi kenaikan
Target Harga 12 Bulan
26 analis · 2026-10-21Target rata-rata $485.47 +32,6%
Perbandingan rekan (sub-industri GICS) Metrik utama vs rekan sektor
Dasar FY, harga per penutupan akhir tahun fiskal terakhir setiap perusahaan.
Berita Terbaru Berita utama terbaru yang menyebutkan perusahaan ini
Metrik Saya Daftar pantauan pribadi Anda — baris yang dipilih dari Fundamental Lengkap
Pilih metrik yang penting bagi Anda — klik + di sebelah baris mana pun di Fundamental Lengkap di atas.
Pilihan Anda disimpan dan mengikuti Anda di semua ticker.