
VMRK Vivmark Residential Common Shares of Beneficial Interest
NYSE · Lihat di SEC EDGAR ↗ 10-K/10-Q Apr 30, 2025VMRK Cuplikan Saham Harga, kapitalisasi pasar, P/E, EPS, ROE, utang/ekuitas, kisaran 52 minggu
VMRK Grafik Harga Saham OHLCV harian dengan indikator teknis — geser, perbesar, dan sesuaikan tampilan Anda
Granularitas batang menyesuaikan dengan periode yang dipilih — arahkan kursor ke bagan untuk melihat buka/tinggi/rendah/tutup untuk sebuah batang.
| Tanggal ex-dividen | Pemecahan | Tipe |
|---|---|---|
| 12 Okt. 2001 | 2-for-1 | Maju |
Tentang Vivmark Residential Common Shares of Beneficial Interest Tinjauan perusahaan dari Wikipedia
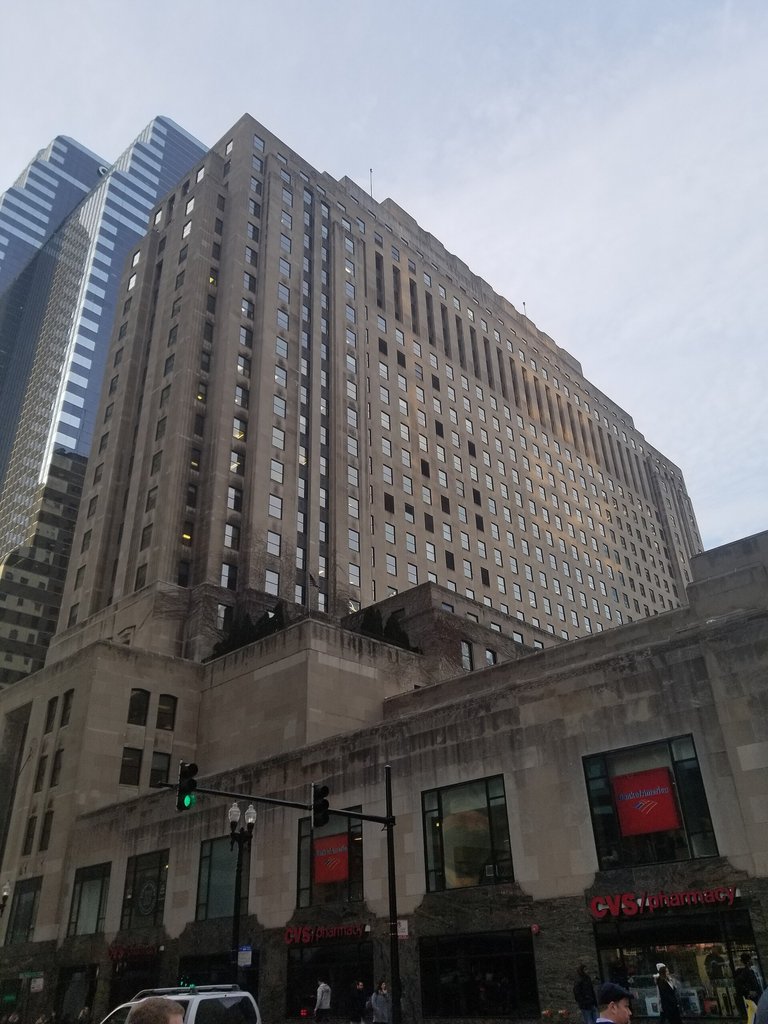
Vivmark Residential (formerly Equity Residential), based in Arlington, Virginia, and Chicago, Illinois, is a real estate investment trust that invests in apartments. As of August 2026, the company owned or had investments in 184,000 rental apartments and had over 11,100 apartments under construction.
It is the largest owner of apartments in the United States and the 18th largest apartment property manager in the United States.
History
The company had its origins in Equity Finance and Management Company, founded in 1969 by Sam Zell. In 1993, the company acquired a large portfolio of properties from Starwood Capital Group, owned by Barry Sternlicht and Bob Faith, in exchange for a 20% stake in the company. Starwood had acquired the properties via government auctions after the savings and loan crisis. In August 1993, the company became a public company via an initial public offering. At that time, the company owned 22,000 apartments.
In 1997, the company acquired Wellsford Residential Property Trust for $620 million in stock and the assumption of $346 million of debt. It also acquired Evans Withycombe Residential for $625 million in stock and the assumption of $432 million in debt.
In 1998, the company acquired a portfolio of 5,774 apartments from Lincoln Property Company for $465 million. It also acquired Merry Land, which owned 34,990 units in the southeast United States, for $1.17 billion in stock as well as $656 million in debt and $270 million in preferred stock.
In 1999, the company acquired Lexford Residential Trust for $203 million in stock and the assumption of $530 million of debt. Lexford owned mainly one-story affordable housing units, rented to households with incomes between $25,000 and $35,000.
In January 2003, CEO Douglas Crocker retired. During his tenure, the company increased its ownership from 22,000 apartments to 227,000 apartments. In 2006, the company sold its Lexford affordable housing division, which included 27,115 apartment units, for $1.09 billion.
In February 2013, the company and AvalonBay Communities closed a $9 billion deal to acquire Archstone from Lehman Brothers. In 2013, the company sold 8,010 apartment units to a joint venture of Goldman Sachs and Greystar Real Estate Partners for $1.5 billion. In 2016, the company sold 23,262 apartments to Starwood Capital Group for $5.365 billion.
In August 2026, the company acquired AvalonBay Communities and changed its name to Vivmark Residential.
Legal issues
In 2022, the company agreed to pay approximately $2 million to settle a lawsuit filed by Attorney General for the District of Columbia Karl Racine alleging that the company offered misleading rent discounts on a rent-controlled building in Washington, D.C.
The company was sued in a class action due to allegations that the late payment fees that it charged, including a $50 minimum fee even if rent was just one day late, and compounding fees and penalties, were in violation of California law. In a settlement finalized in 2026, the company agreed to pay $43 million to over 200,000 tenants in California as reimbursement of excessive fees.
In a multi-district class action lawsuit, the company and 10 other large landlords were accused of engaging in an unlawful conspiracy to use RealPage's revenue management software to share competitively sensitive data and coordinate rent increases. In 2026, as part of a settlement with all of the defendants, the company agreed to pay $56 million to settle the allegations.
Sumber: Wikipedia (English), CC BY-SA 4.0 · Lihat di Wikipedia ↗
Kinerja 10 Tahun Tren Pendapatan, laba bersih, margin, dan EPS
Valuasi Rasio P/E, P/S, P/B, EV/EBITDA — apakah sahamnya mahal atau murah?
Data fundamental belum cukup untuk menghitung grup rasio ini.
Profitabilitas Margin kotor, operasional, dan bersih; ROE, ROA, ROIC
Data fundamental belum cukup untuk menghitung grup rasio ini.
Kesehatan Keuangan Utang, likuiditas, solvabilitas — kekuatan neraca
Data fundamental belum cukup untuk menghitung grup rasio ini.
Pertumbuhan Pertumbuhan Pendapatan, EPS, dan Laba Bersih: YoY, CAGR 3T, CAGR 5T
Data fundamental belum cukup untuk menghitung grup rasio ini.
Efisiensi Modal Perputaran aset, perputaran persediaan, perputaran piutang
Data fundamental belum cukup untuk menghitung grup rasio ini.
nilai · ≈ rata-rata 5T · median industri · penilaian relatif terhadap median
Dividen Yield, rasio pembayaran, riwayat dividen, CAGR 5 tahun
| Tanggal ex-dividen | Jumlah | Mata Uang | Imbal Hasil |
|---|---|---|---|
| Okt 5, 2026 | $0,70 | USD | ≈4.7% |
| Jun 29, 2026 | $0,70 | USD | ≈4.1% |
| Mar 30, 2026 | $0,70 | USD | ≈4.7% |
| Jan 2, 2026 | $0,69 | USD | ≈4.5% |
| Sep 25, 2025 | $0,69 | USD | ≈4.3% |
| Jun 24, 2025 | $0,69 | USD | ≈4.1% |
| Mar 31, 2025 | $0,69 | USD | ≈3.8% |
| Jan 2, 2025 | $0,68 | USD | ≈3.9% |
| Sep 24, 2024 | $0,68 | USD | ≈3.6% |
| Jul 1, 2024 | $0,68 | USD | ≈3.9% |
| Mar 22, 2024 | $0,68 | USD | ≈4.3% |
| Des 29, 2023 | $0,66 | USD | ≈4.3% |
| Sep 25, 2023 | $0,66 | USD | ≈4.4% |
| Jun 23, 2023 | $0,66 | USD | ≈4.1% |
| Mar 24, 2023 | $0,66 | USD | ≈4.5% |
| Des 30, 2022 | $0,63 | USD | ≈4.2% |
| Sep 23, 2022 | $0,63 | USD | ≈3.6% |
| Jun 24, 2022 | $0,63 | USD | ≈3.4% |
| Mar 25, 2022 | $0,63 | USD | ≈2.7% |
| Des 31, 2021 | $0,60 | USD | ≈2.7% |
Riwayat Pendapatan EPS aktual vs perkiraan, kejutan %, tingkat keberhasilan, tanggal pendapatan berikutnya
| Periode | Laporan | EPS Aktual | EPS Estimasi | Kejutan |
|---|---|---|---|---|
| 30 Juni 2026 | $0.31 | $0.44 | -29.7% | |
| 31 Maret 2026 | $0.24 | $0.32 | -24.7% | |
| 31 Des. 2025 | $1.00 | $0.40 | 153.2% | |
| 30 Sep. 2025 | $0.76 | $0.45 | 70.1% |
Fundamental Lengkap Semua metrik per tahun — laporan laba rugi, neraca, arus kas
Kami belum memiliki pengajuan SEC untuk ticker ini.
Per Saham
| Metrik | Tren | Q4 2025 |
|---|---|---|
| EPS (TTM) | $2.29 |
Valuasi (TTM)
| Metrik | Tren | Q4 2025 |
|---|---|---|
| Revenue TTM | $2.70B | |
| Net Income TTM | $873M |
Periode terbaru di sebelah kiri · nilai null ditampilkan sebagai ·
Orang dalam perusahaan 31 orang dalam · 15 pejabat · 17 direktur
| Orang Dalam | Peran | Aktivitas terakhir | Saham dimiliki | Beli 12m | Jual 12m | Bersih 12m |
|---|---|---|---|---|---|---|
| Benjamin Schall | President & CEO | 17 Agu 2026 A | · | 0 | 0 | $0 |
| Kevin P. O'Shea | Executive Vice President & CFO | 17 Agu 2026 A | · | 0 | 0 | $0 |
| Michael L Manelis | Executive Vice President & COO | 17 Agu 2026 A | 44.713 | 0 | 1 | $-503.226 |
| Sean Thomas Willson | Senior Vice President & CAO | 21 Agu 2026 S | 17.988 | 0 | 2 | $-35.973 |
| Matthew H. Birenbaum | Executive Vice President & CDO | 20 Agu 2026 G | 272.749 | 0 | 0 | $0 |
| Pamela Rogers Thomas | EVP, Portfolio & Asset Mgmt | 17 Agu 2026 A | 85.543 | 0 | 0 | $0 |
| Alaine Susan Walsh | EVP, Human Capital & Admin | 17 Agu 2026 A | · | 0 | 0 | $0 |
| Scott Fenster | EVP & General Counsel | 17 Agu 2026 A | · | 0 | 0 | $0 |
| Sean J. Breslin | EVP & CI & GO | 17 Agu 2026 A | · | 0 | 0 | $0 |
| Edward M Schulman | EVP, Legal Affairs | 17 Agu 2026 A | 48.776 | 0 | 1 | $-1.066.893 |
| Ian Kaufman | Chief Accounting Officer | 14 Agu 2026 A | 29.657 | 0 | 0 | $0 |
| Christa L Sorenson | Executive Vice President | 10 Feb. 2020 S | 3.939 | 0 | 0 | $0 |
| Bruce C Strohm | EVP & General Counsel | 22 Des. 2014 M | 2.179 | 0 | 0 | $0 |
| Gregory H Smith | Executive Vice President | 8 Feb. 2006 S | 46.064 | 0 | 0 | $0 |
| Edward J Geraghty | Executive Vice President | 19 Agu 2003 S | 78.797 | 0 | 0 | $0 |
| Ann Hoff | Direktur | 17 Agu 2026 A | 6.330 | 0 | 0 | $0 |
| Nina P Jones | Direktur | 17 Agu 2026 A | 3.404 | 0 | 0 | $0 |
| Christopher B. Howard | Direktur | 17 Agu 2026 A | 12.730 | 0 | 1 | $-543.104 |
| Chris Carr | Direktur | 17 Agu 2026 A | 5.591 | 0 | 0 | $0 |
| Susan Swanezy | Direktur | 17 Agu 2026 A | 28.934 | 0 | 1 | $-1.001.660 |
| Terry S. Brown | Direktur | 17 Agu 2026 A | · | 0 | 0 | $0 |
| Conor C Flynn | Direktur | 17 Agu 2026 A | · | 0 | 0 | $0 |
| Angela M Aman | Direktur | 17 Agu 2026 A | · | 0 | 0 | $0 |
| Stephen E Sterrett | Direktur | 17 Agu 2026 A | 20.773 | 0 | 0 | $0 |
| David J Neithercut | Direktur | 17 Agu 2026 A | · | 0 | 0 | $0 |
| Timothy J Naughton | Direktur | 17 Agu 2026 A | 314.301 | 0 | 0 | $0 |
| Charles E Mueller JR | Direktur | 17 Agu 2026 A | 16.084 | 0 | 1 | $-511.200 |
| Mary Kay Haben | Direktur | 17 Agu 2026 A | 9.477 | 0 | 0 | $0 |
| Gerald A Spector | Direktur | 28 Feb. 2013 A | 282.191 | 0 | 0 | $0 |
| Stephen O Evans | Direktur | 28 Feb. 2006 A | 7.644 | 0 | 0 | $0 |
| Michael N Thompson | Direktur | 27 Feb. 2004 A | 12.777 | 0 | 0 | $0 |
Orang dalam dari pengajuan SEC Form 3/4/5; bersih = hanya P/S pasar terbuka
Kepemilikan ETF Dimiliki oleh 59 ETF
Bobot mencerminkan kepemilikan ekuitas langsung (N-PORT) saja; dana berbasis leverage atau derivatif mungkin memiliki eksposur swap tambahan yang tidak ditampilkan.
| Dana | Bobot | Unit | Per tanggal | Sumber |
|---|---|---|---|---|
| REZ · iShares Trust | 8,65% | 1.095.687 SH | 11 Sep. 2026 | Harian |
| ICF · iShares Trust | 4,77% | 1.448.479 SH | 11 Sep. 2026 | Harian |
| USRT · iShares Trust | 4,28% | 2.912.473 SH | 11 Sep. 2026 | Harian |
| IYR · iShares Trust | 3,59% | 2.258.051 SH | 11 Sep. 2026 | Harian |
| RSPR · Invesco Exchange-Traded Fund Trust | 3,27% | 43.465 | 28 Okt. 2026 | Harian |
| REET · iShares Trust | 2,78% | 2.075.131 SH | 11 Sep. 2026 | Harian |
| ERET · iShares Trust | 2,73% | 5.650 SH | 11 Sep. 2026 | Harian |
| SPHD · Invesco Exchange-Traded Fund Trust … | 1,75% | 936.925 | 28 Okt. 2026 | Harian |
| PABU · iShares Trust | 1,44% | 554.426 SH | 11 Sep. 2026 | Harian |
| IIGD · Invesco Exchange-Traded Self-Indexe… | 1,27% | 326.000 | 28 Okt. 2026 | Harian |
| SPLV · Invesco Exchange-Traded Fund Trust … | 0,97% | 1.140.817 | 28 Okt. 2026 | Harian |
| RDIV · Invesco Exchange-Traded Fund Trust … | 0,57% | 131.054 | 28 Okt. 2026 | Harian |
| IWS · iShares Trust | 0,49% | 1.136.811 SH | 11 Sep. 2026 | Harian |
| IMCV · iShares Trust | 0,40% | 70.805 SH | 11 Sep. 2026 | Harian |
| SIZE · iShares Trust | 0,38% | 24.910 SH | 11 Sep. 2026 | Harian |
| IWR · iShares Trust | 0,36% | 3.117.549 SH | 11 Sep. 2026 | Harian |
| IMCB · iShares Trust | 0,33% | 85.059 SH | 11 Sep. 2026 | Harian |
| QUAL · iShares Trust | 0,29% | 2.111.212 SH | 11 Sep. 2026 | Harian |
| IMCG · iShares Trust | 0,27% | 163.022 SH | 11 Sep. 2026 | Harian |
| XOEF · iShares Trust | 0,27% | 910 SH | 11 Sep. 2026 | Harian |
| BSCQ · Invesco Exchange-Traded Self-Indexe… | 0,26% | 7.556.000 | 28 Okt. 2026 | Harian |
| EUSA · iShares, Inc. | 0,21% | 60.634 SH | 11 Sep. 2026 | Harian |
| LRGF · iShares Trust | 0,20% | 110.832 SH | 11 Sep. 2026 | Harian |
| RSP · Invesco Exchange-Traded Fund Trust | 0,19% | 3,023,753,00 | 28 Okt. 2026 | Harian |
| USXF · iShares Trust | 0,19% | 42.519 SH | 11 Sep. 2026 | Harian |
| IVE · iShares Trust | 0,16% | 1.209.462 SH | 11 Sep. 2026 | Harian |
| IUSV · iShares Trust | 0,15% | 640.730 SH | 11 Sep. 2026 | Harian |
| EQAL · Invesco Exchange-Traded Fund Trust … | 0,14% | 18.869 | 28 Okt. 2026 | Harian |
| BSCT · Invesco Exchange-Traded Self-Indexe… | 0,14% | 4.374.000 | 28 Okt. 2026 | Harian |
| PFIG · Invesco Exchange-Traded Fund Trust … | 0,13% | 195.000 | 26 Okt. 2026 | Harian |
| IWD · iShares Trust | 0,13% | 1.691.737 SH | 11 Sep. 2026 | Harian |
| DSI · iShares Trust | 0,13% | 109.394 SH | 11 Sep. 2026 | Harian |
| BSCS · Invesco Exchange-Traded Self-Indexe… | 0,11% | 4.062.000 | 28 Okt. 2026 | Harian |
| PRF · Invesco Exchange-Traded Fund Trust | 0,11% | 171.298 | 28 Okt. 2026 | Harian |
| TOPC · iShares Trust | 0,09% | 443 SH | 11 Sep. 2026 | Harian |
| DIVB · iShares Trust | 0,08% | 26.534 SH | 11 Sep. 2026 | Harian |
| VLUE · iShares Trust | 0,08% | 124.640 SH | 11 Sep. 2026 | Harian |
| ILCV · iShares Trust | 0,08% | 16.911 SH | 11 Sep. 2026 | Harian |
| XVV · iShares Trust | 0,08% | 8.404 SH | 11 Sep. 2026 | Harian |
| USCL · iShares Trust | 0,08% | 33.766 SH | 11 Sep. 2026 | Harian |
| IVV · iShares Trust | 0,07% | 9.188.154 SH | 11 Sep. 2026 | Harian |
| ILCB · iShares Trust | 0,07% | 13.952 SH | 11 Sep. 2026 | Harian |
| IWB · iShares Trust | 0,07% | 525.058 SH | 11 Sep. 2026 | Harian |
| QVML · Invesco Exchange-Traded Fund Trust … | 0,07% | 19.212 | 28 Okt. 2026 | Harian |
| IWV · iShares Trust | 0,07% | 213.841 SH | 11 Sep. 2026 | Harian |
| PBP · Invesco Exchange-Traded Fund Trust | 0,07% | 4.315 | 28 Okt. 2026 | Harian |
| PBUS · Invesco Exchange-Traded Fund Trust … | 0,07% | 115.308 | 28 Okt. 2026 | Harian |
| IYY · iShares Trust | 0,07% | 30.956 SH | 11 Sep. 2026 | Harian |
| ITOT · iShares Trust | 0,06% | 953.021 SH | 11 Sep. 2026 | Harian |
| ILCG · iShares Trust | 0,06% | 28.911 SH | 11 Sep. 2026 | Harian |
| TOK · iShares Trust | 0,06% | 2.101 SH | 11 Sep. 2026 | Harian |
| PHDG · Invesco Actively Managed Exchange-T… | 0,06% | 567 | 28 Okt. 2026 | Harian |
| CRBN · iShares Trust | 0,06% | 10.037 SH | 11 Sep. 2026 | Harian |
| URTH · iShares, Inc. | 0,05% | 65.129 SH | 11 Sep. 2026 | Harian |
| OMFL · Invesco Exchange-Traded Self-Indexe… | 0,05% | 38.095 | 28 Okt. 2026 | Harian |
| ACWI · iShares Trust | 0,05% | 232.770 SH | 11 Sep. 2026 | Harian |
| RWL · Invesco Exchange-Traded Fund Trust … | 0,01% | 24.358 | 27 Okt. 2026 | Harian |
| GLOF · iShares Trust | 0,01% | 309 SH | 10 Sep. 2026 | Harian |
| GTO · Invesco Actively Managed Exchange-T… | 0,00% | 7.000 | 27 Okt. 2026 | Harian |
VMRK Konsensus Analis Opini analis bullish dan bearish, target harga 12 bulan, potensi kenaikan
Target Harga 12 Bulan
20 analis · 2026-10-29Target rata-rata $71.62 +17,6%
Perbandingan rekan (sub-industri GICS) Metrik utama vs rekan sektor
Dasar FY, harga per penutupan akhir tahun fiskal terakhir setiap perusahaan.
| Ticker | Kapitalisasi Pasar | P/E | Pendapatan YoY | Margin Bersih | ROE | Margin Kotor |
|---|---|---|---|---|---|---|
| VMRK | · | · | · | · | · | · |
| ESS | $16.86B | 25.2 | 6.4% | 37.2% | 12.7% | 69.9% |
| MAA | $16.24B | 36.7 | 0.83% | 20.2% | 7.7% | · |
| CPT | $11.48B | 31.1 | 81.7% | 2964.9% | 8.5% | · |
| UDR | $12.04B | 32.5 | 2.4% | 22.1% | 11.2% | · |
| IRT | $4.15B | 72.8 | 2.8% | 8.6% | 1.6% | · |
| CSR | $1.12B | 65.4 | 4.9% | 6.2% | 2.3% | · |
| NXRT | $763M | -23.9 | -3.2% | -12.8% | -9.1% | · |
Metrik Saya Daftar pantauan pribadi Anda — baris yang dipilih dari Fundamental Lengkap
Pilih metrik yang penting bagi Anda — klik + di sebelah baris mana pun di Fundamental Lengkap di atas.
Pilihan Anda disimpan dan mengikuti Anda di semua ticker.