
CMSD CMS Energy Corporation 5.875% Junior Subordinated Notes due 2079
NYSE · Utilities · Visualizza su SEC EDGAR ↗ chiudi Ott 2, 2026 10-K/10-Q Lug 28, 2026CMSD Snapshot del titolo Prezzo, capitalizzazione di mercato, P/E, EPS, ROE, debito/capitale proprio, intervallo 52 settimane
CMSD Grafico del prezzo delle azioni OHLCV giornaliero con indicatori tecnici — panoramica, zoom e personalizza la tua visualizzazione
La granularità delle barre si adatta al periodo selezionato — passa il mouse sul grafico per vedere apertura/massimo/minimo/chiusura di una barra.
Informazioni su CMS Energy Corporation 5.875% Junior Subordinated Notes due 2079 Panoramica della società da Wikipedia
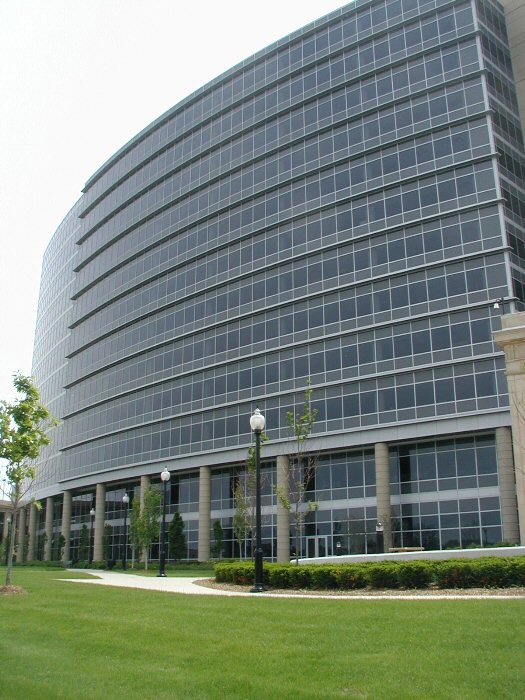
CMS Energy Corporation is an American energy company based in Jackson, Michigan, that is focused principally on utility operations in Michigan. Its principal business is Consumers Energy, a public utility that provides electricity and natural gas to more than 6 million of Michigan's 10 million residents. Its non-utility businesses are focused primarily on domestic independent power production. Consumers Energy has operated since 1886.
NorthStar Clean Energy's primary businesses are independent power production and natural gas transmission.
History
CMS Energy was formed in 1987 as a holding company with its principal subsidiaries as Consumers Energy and NorthStar Clean Energy. On October 23, 1987, CMS Energy became a publicly owned company and was listed at the New York Stock Exchange. The company's history dates back to 1886, when William Augustine Foote and Samuel Jarvis initially approached Jackson, Michigan officials and asked them to support efforts to illuminate Jackson's downtown with electric arc lights. They formed a company, Jackson Electric Light Works in 1888. In 1889, they built a hydro plant project at the Trowbridge Dam on the Kalamazoo River in Allegan. Foote, after seeing some early success, began consolidating his small power companies and formed Commonwealth Power Company.
In 1907, Foote and Jarvis built Croton Hydro project on the Muskegon River, the first project in the world that could transmit 110,000 volts of electricity. In 1920, Foote and Jarvis offered preferred shares of their company to the public to secure sufficient financing to enter other energy and power generation sectors. Over the next decades the company built several coal-fired, natural gas, nuclear and electric facilities. In 1946, the company formed a strategic partnership with Panhandle Company to convert former natural gas fields to underground natural gas storage areas. CMS Energy's primary subsidiary, Consumers Energy, announced Michigan's first nuclear power plant in 1961, Big Rock Point in Charlevoix, Michigan.
The company announced another nuclear plant, Palisades Nuclear Generating Station on Lake Michigan, which first produced electricity in December, 1971 to serve 400,000 people a day. CMS Energy owned the plant until 2006, when it was sold to Entergy. It then announced a gas reforming plant to furnish heat for Michigan homes in 1971. This plant was the first of its kind in North America to produce synthetic gas, converting impure liquid petroleum into pipeline-quality natural gas.
In 1987, CMS Energy, a holding company with its principal subsidiaries as Consumers Power and CMS Enterprises was formed. Consumers Power was rebranded Consumers Energy in 1997. The firm was one of the first companies to introduce an online billing system in the late 1990s.
In 2001, the firm entered into an exploration agreement with Eritrea for oil exploration in the Dismin Block of the Red Sea.
In 2002, CMS Energy founded EnerBank USA.
In 2003, the firm moved its headquarters to One Energy Plaza in Jackson, Michigan. In 2007, the company announced plans to invest $6 billion in Michigan's energy future to support new power plant technology and identify new energy sources. In 2014, Consumers Energy opened Cross Winds Energy Park in Michigan's Tuscola County and signed a contract with General Electric to supply 621.79-kilowatt wind turbine engines for the project which has a total generating capacity of 105 megawatts.
Oct 1, 2021, CMS Energy Completes Sale of EnerBank USA to Regions Bank.
On Nov 1st 2022, CMS Enterprises changes name to NorthStar Clean Energy as it begins to serve more corporate clients.
Sustainability and Environment
In 2015, 9 percent of CMS Energy's power comes from renewable energy sources. Primary CMS Energy subsidiary Consumers Energy joined the Wildlife Habitat Council as an active member. By 2007, all power facilities received the Clean Corporate Citizen award from the Michigan Department of Environmental Quality.
Awards
Consumers Energy, CMS Energy's primary subsidiary, was named Energy Star Partner of the Year in 2014 and 2015 for excellence in sustainable energy efficiency programs. In 2014, Consumers Energy was ranked among the top 15 most sustainable energy providers. Later that year, CMS Energy received Edison Electric Institute's Index Award for top cumulative shareholder return in the small cap category. The firm received the 2015 Emergency Recovery Award for its electricity restoration efforts during the December 2013 North American storm complex.
Criticism
In December 2011, the non-partisan organization Public Campaign criticized CMS Energy for spending $3.48 million on lobbying and not paying any taxes during 2008-2010, instead getting $29 million in tax rebates, despite making a profit of $415 million, and increasing executive pay by 79% to $900.4 million in 2010 for its top 5 executives.
Philanthropy
CMS Energy has helped establish and finance numerous research, educational and cultural institutes in the United States. Consumers Energy was given the William Booth Award in 2013 by The Salvation Army in recognition of its long history of philanthropic activities and leadership for the PeopleCare assistance program.
CMS Energy participates in internship and cooperative education programs to build career opportunities in Michigan. Consumers Energy has also worked on early childhood development and education in Michigan and has also received Wildlife Habitat Council (WHC) compliant certificates for its efforts to promote environmental education.
Fonte: Wikipedia (Inglese), CC BY-SA 4.0 · Vedi su Wikipedia ↗
Performance decennale Andamento di ricavi, utile netto, margini e EPS
Valutazione Rapporti P/E, P/S, P/B, EV/EBITDA — il titolo è costoso o economico?
| Metrica | Tendenza 5 anni | CMSD | media 5 anni | Mediana dei peer | Verdetto |
|---|---|---|---|---|---|
| P/B (MRQ) | 0.7 | · | · | · |
La mediana dei peer viene calcolata su base standardizzata per metrica e potrebbe non corrispondere sempre alla base TTM/MRQ mostrata per questo titolo.
Redditività Margini lordi, operativi e netti; ROE, ROA, ROIC
Dati fondamentali insufficienti per calcolare questo gruppo di rapporti.
Salute finanziaria Debito, liquidità, solvibilità — solidità del bilancio
| Metrica | Tendenza 5 anni | CMSD | media 5 anni | Mediana dei peer | Verdetto |
|---|---|---|---|---|---|
| Debito / Patrimonio Netto (MRQ) | 1.9 | · | · | · | |
| Rapporto corrente (MRQ) | 0.9 | · | · | · | |
| Debito a lungo termine / Patrimonio netto (MRQ) | 1.9 | · | · | · |
Crescita Crescita di ricavi, EPS e utile netto: YoY, CAGR 3Y, CAGR 5Y
Dati fondamentali insufficienti per calcolare questo gruppo di rapporti.
Efficienza del Capitale Rotazione delle attività, rotazione delle scorte, rotazione dei crediti
Dati fondamentali insufficienti per calcolare questo gruppo di rapporti.
valore · ≈ media 5 anni · mediana del settore · giudizio rispetto alla mediana
Dividendi Rendimento, payout ratio, storico dividendi, CAGR 5Y
| Data ex-dividendo | Importo | Valuta | Rendimento |
|---|---|---|---|
| Ago 17, 2026 | $0,37 | USD | ≈6.9% |
| Mag 15, 2026 | $0,37 | USD | ≈6.4% |
| Feb 13, 2026 | $0,37 | USD | ≈6.2% |
| Nov 14, 2025 | $0,37 | USD | ≈6.1% |
| Ago 15, 2025 | $0,37 | USD | ≈6.3% |
| Mag 16, 2025 | $0,37 | USD | ≈6.7% |
| Feb 14, 2025 | $0,37 | USD | ≈6.2% |
| Nov 15, 2024 | $0,37 | USD | ≈6.0% |
| Ago 16, 2024 | $0,37 | USD | ≈6.0% |
| Mag 16, 2024 | $0,37 | USD | ≈6.0% |
| Feb 14, 2024 | $0,37 | USD | ≈6.0% |
| Nov 15, 2023 | $0,37 | USD | ≈6.2% |
| Ago 16, 2023 | $0,37 | USD | ≈6.2% |
| Mag 16, 2023 | $0,37 | USD | ≈6.1% |
| Feb 13, 2023 | $0,37 | USD | ≈6.0% |
| Nov 15, 2022 | $0,37 | USD | ≈6.2% |
| Ago 16, 2022 | $0,37 | USD | ≈5.8% |
| Mag 16, 2022 | $0,37 | USD | ≈6.0% |
| Feb 11, 2022 | $0,36 | USD | ≈5.6% |
| Nov 15, 2021 | $0,37 | USD | ≈5.5% |
Cronologia utili EPS effettivo vs stima, surprise %, tasso di superamento, data prossimi utili
| Periodo | Rapporto | EPS Actual | EPS Stimato | Sorpresa |
|---|---|---|---|---|
| 30 Giugno 2026 | $0.37 | $0.36 | 1.6% | |
| 31 Marzo 2026 | $1.13 | $1.11 | 1.9% | |
| 31 Dicembre 2025 | $0.94 | $0.95 | -1.2% | |
| 30 Settembre 2025 | $0.93 | $0.85 | 8.9% | |
| 30 Giugno 2025 | $0.71 | $0.70 | 2.1% | |
| 31 Marzo 2025 | $1.02 | $1.02 | -0.41% |
Fondamentali Completi Tutte le metriche per anno — conto economico, stato patrimoniale, rendiconto finanziario
Stato Patrimoniale
| Metrica | Tendenza | 2025 |
|---|---|---|
| Cash & Equivalents | $509M | |
| Other Current Assets | $160M | |
| Current Assets | $3.47B | |
| PP&E (Net) | $30.68B | |
| Accum. Depreciation | $10.13B | |
| Other Non-current Assets | $398M | |
| Total Assets | $39.94B | |
| Current Liabilities | $3.55B | |
| Deferred Tax | $3.25B | |
| Other Non-current Liabilities | $392M | |
| Long-term Debt | $18.76B | |
| Common Stock | $3M | |
| Retained Earnings | $2.44B | |
| AOCI | $-36M | |
| Stockholders' Equity | $9.14B | |
| Liabilities + Equity | $39.94B | |
| Shares Outstanding | 306,400,000 |
Conto Economico
| Metrica | Tendenza | Q2 2026 | Q1 2026 | Q2 2025 | Q1 2025 |
|---|---|---|---|---|---|
| Revenue | $1.83B | $2.73B | $1.84B | $2.45B | |
| Operating Expenses | $1.56B | $2.24B | $1.52B | $1.95B | |
| Operating Income | $264M | $490M | $317M | $494M | |
| Other Non-op | $75M | $75M | $137M | $50M | |
| Pretax Income | $129M | $362M | $255M | $358M | |
| Income Tax | $33M | $85M | $62M | $63M | |
| Net Income | $120M | $340M | $201M | $304M | |
| EPS (Basic) | $0.38 | $1.10 | $0.67 | $1.01 | |
| EPS (Diluted) | $0.37 | $1.10 | $0.66 | $1.01 | |
| Shares (Basic) | 310,200,000 | 306,400,000 | 298,500,000 | 298,200,000 | |
| Shares (Diluted) | 310,800,000 | 307,100,000 | 299,100,000 | 299,100,000 | |
| EBITDA | $572M | $902M | · | · |
Stato Patrimoniale
| Metrica | Tendenza | Q2 2026 | Q1 2026 | Q2 2025 | Q1 2025 |
|---|---|---|---|---|---|
| Cash & Equivalents | $241M | $175M | · | · | |
| Other Current Assets | $243M | $225M | · | · | |
| Current Assets | $2.87B | $3.02B | · | · | |
| PP&E (Net) | $32.33B | $31.53B | · | · | |
| Accum. Depreciation | $10.50B | $10.38B | · | · | |
| Other Non-current Assets | $302M | $341M | · | · | |
| Total Assets | $40.91B | $40.28B | · | · | |
| Current Liabilities | $3.06B | $3.59B | · | · | |
| Deferred Tax | $3.40B | $3.35B | · | · | |
| Other Non-current Liabilities | $444M | $417M | · | · | |
| Long-term Debt | $19.04B | $18.86B | · | · | |
| Total Debt | $19.04B | $18.86B | · | · | |
| Common Stock | $3M | $3M | · | · | |
| Retained Earnings | $2.55B | $2.60B | · | · | |
| AOCI | $-35M | $-35M | · | · | |
| Stockholders' Equity | $9.77B | $9.47B | · | · | |
| Liabilities + Equity | $40.91B | $40.28B | · | · | |
| Shares Outstanding | 313,600,000 | 308,900,000 | · | · |
Flusso di cassa
| Metrica | Tendenza | Q2 2026 | Q1 2026 | Q2 2025 | Q1 2025 |
|---|---|---|---|---|---|
| D&A | $308M | $412M | $288M | $388M | |
| Other Non-cash | · | $-47M | · | · | |
| Operating Cash Flow | $622M | $705M | · | $1.00B | |
| CapEx | $967M | $1.04B | · | $888M | |
| Investing Cash Flow | $-1.02B | $-1.07B | · | $-918M | |
| Debt Issued | $909M | $258M | · | $1.20B | |
| Net Debt Issued | · | $54M | · | · | |
| Stock Issued | $362M | $166M | · | $3M | |
| Net Stock Activity | · | $166M | · | · | |
| Financing Cash Flow | $480M | $16M | · | $266M | |
| Net Change in Cash | $82M | $-352M | · | $348M | |
| Free Cash Flow | · | $-334M | · | · |
Redditività
| Metrica | Tendenza | Q2 2026 | Q1 2026 | Q2 2025 | Q1 2025 |
|---|---|---|---|---|---|
| Operating Margin | 14.4% | 17.9% | · | · | |
| Net Margin | 6.6% | 12.4% | · | · | |
| Pretax Margin | 7.0% | 13.3% | · | · | |
| EBITDA Margin | 31.3% | 33.0% | · | · | |
| ROA | 0.31% | 0.89% | · | · | |
| ROE | 1.3% | 3.8% | · | · | |
| ROIC | 0.68% | 1.3% | · | · |
Liquidità e Solvibilità
| Metrica | Tendenza | Q2 2026 | Q1 2026 | Q2 2025 | Q1 2025 |
|---|---|---|---|---|---|
| Current Ratio | 0.9 | 0.8 | · | · | |
| Quick Ratio | 0.1 | 0.0 | · | · | |
| Debt / Equity | 1.9 | 2.0 | · | · | |
| LT Debt / Equity | 1.9 | 1.8 | · | · |
Efficienza
| Metrica | Tendenza | Q2 2026 | Q1 2026 | Q2 2025 | Q1 2025 |
|---|---|---|---|---|---|
| Asset Turnover | 0.0 | 0.1 | · | · |
Per Azione
| Metrica | Tendenza | Q2 2026 | Q1 2026 | Q2 2025 | Q1 2025 |
|---|---|---|---|---|---|
| Book Value / Share | $31.17 | $30.64 | · | · | |
| Revenue / Share | $5.88 | $8.89 | · | · | |
| Cash Flow / Share | · | $2.30 | · | · | |
| Cash / Share | $0.77 | $0.57 | · | · | |
| Dividend / Share | $0.57 | $0.57 | $0.54 | $0.54 | |
| EPS (TTM) | $3.33 | $3.62 | $3.39 | $3.38 |
Valutazione (TTM)
| Metrica | Tendenza | Q2 2026 | Q1 2026 | Q2 2025 | Q1 2025 |
|---|---|---|---|---|---|
| Revenue TTM | $8.81B | $8.82B | $8.02B | $7.79B | |
| Net Income TTM | $1.03B | $1.11B | $1.02B | $1.02B | |
| Market Cap | $6.87B | $6.83B | · | · | |
| Enterprise Value | $25.66B | $25.51B | · | · | |
| P/E | 6.6 | 6.1 | 6.5 | 6.7 | |
| P/S | 0.8 | 0.8 | 0.8 | 0.9 | |
| P/B | 0.7 | 0.7 | · | · | |
| P / Tangible Book | 0.7 | 0.7 | · | · | |
| P / Cash Flow | · | 9.7 | · | · | |
| EV / Revenue | 2.9 | 2.9 | 3.0 | 3.0 | |
| Earnings Yield | 15.2% | 16.4% | 15.3% | 14.8% |
Periodo più recente a sinistra · valori nulli mostrati come ·
Bilanci Conto economico, stato patrimoniale, flusso di cassa — annuale, ultimi 5 anni
Dati fondamentali insufficienti per creare questo bilancio al momento.
Dati fondamentali insufficienti per creare questo bilancio al momento.
Dati fondamentali insufficienti per creare questo bilancio al momento.
Proprietari istituzionali (13F) 2 filer · $20K totale · Aggiornato al 30 Giugno 2026
Istituzioni che segnalano il possesso di questo titolo nel loro Modulo SEC 13F trimestrale. Solo posizioni lunghe; un singolo depositante può apparire due volte per diverse gambe di opzioni. Grandi posizioni put/call contrapposte riflettono tipicamente market-making o inventario coperto, non convinzione direzionale.
| Nuove posizioni | Posizioni chiuse | Aumentato | Diminuito | Variazione netta delle azioni |
|---|---|---|---|---|
| 0 (-1 vs trimestre precedente) | 0 (-1 vs trimestre precedente) | 1 (+1 vs trimestre precedente) | 1 (+1 vs trimestre precedente) | +478 |
Confrontato con Q1 2026. Le dichiarazioni SEC Form 13F sono dovute entro 45 giorni dalla fine del trimestre più un breve margine per i dichiaranti in ritardo — i trimestri ancora all'interno di questa finestra vengono saltati a favore della coppia più recente completamente riportata.
| Istituzione | Valore | Azioni | % di 13F tracciati | Tipo |
|---|---|---|---|---|
| First Command Advisory Services, Inc. | $16.075 | 734 | 81,20% | Azioni |
| PNC Financial Services Group, Inc. | $3.723 | 170 | 18,80% | Azioni |
Insider aziendali 1 insider · 1 dirigenti · 0 direttori
| Insider | Ruolo | Ultima attività | Azioni possedute | Acquisti 12m | Vendite 12m | Netto 12m |
|---|---|---|---|---|---|---|
| Srikanth Maddipati | EVP/CFO | 31 Luglio 2026 P | 34.895 | 1 | 0 | $14.492 |
Insider dai depositi SEC Modulo 3/4/5; netto = solo acquisti/vendite di mercato
Proprietà ETF Posseduto da 1 ETF
Il peso riflette solo le partecipazioni azionarie dirette (N-PORT); fondi a leva o basati su derivati possono detenere ulteriore esposizione swap non mostrata.
| Fondo | Peso | Unità | Aggiornato al | Fonte |
|---|---|---|---|---|
| FPE · First Trust Exchange-Traded Fund III | 0,25% | 705.428 NS | 31 Luglio 2026 | N-PORT |
CMSD Consenso degli analisti Opinioni degli analisti, sia rialziste che ribassiste, target price a 12 mesi, potenziale di rialzo
Confronto Peer (GICS sub-settore industriale) Metriche chiave rispetto ai pari del settore
Base FY, prezzi alla chiusura dell'ultimo anno fiscale di ciascuna società.
| Ticker | Capitalizzazione di Mercato | P/E | Rev YoY | Margine Netto | ROE | Margine lordo |
|---|---|---|---|---|---|---|
| CMSD | · | · | · | · | · | · |
| WEC | $34.32B | 21.9 | 14.0% | 15.9% | 11.2% | · |
| PEG | $39.99B | 19.0 | 18.2% | 17.3% | 12.6% | · |
| AEE | $27.60B | 18.7 | 15.4% | 16.6% | 11.5% | · |
| DTE | · | · | · | · | · | · |
| CNP | $25.03B | 24.0 | 8.3% | 11.2% | 9.5% | · |
| CMS | $21.43B | 19.8 | 13.6% | 12.5% | 12.3% | · |
| NI | $19.98B | 21.4 | 23.5% | 14.2% | 10.2% | · |
| BKH | $5.24B | 17.4 | 8.6% | 12.6% | 8.0% | · |
| NWE | $3.96B | 22.0 | 6.4% | 11.2% | 6.3% | · |
| NWE | $3.96B | 22.0 | 6.4% | 11.2% | 6.3% | · |
Le Mie Metriche La tua watchlist personale — righe selezionate da Fondamentali Completi
Scegli le metriche che contano per te: fai clic sul + accanto a qualsiasi riga in Fondamentali Completi sopra.
La tua selezione è salvata e ti segue su tutti i ticker.