
RDY Dr. Reddy's Laboratories Ltd Common Stock
NYSE · Pharmaceuticals · SEC EDGAR で表示 ↗ 終値 10月 2, 2026 10-K/10-Q 5月 29, 2026RDY 株価スナップショット 価格、時価総額、P/E、EPS、ROE、負債/資本、52週レンジ
RDY 株価チャート 技術指標付きの日次 OHLCV — パン、ズーム、ビューのカスタマイズ
バーの粒度は選択した期間に合わせて調整されます。バーの始値/高値/安値/終値を確認するにはチャートにカーソルを合わせてください。
| 権利落ち日 | 分割 | タイプ |
|---|---|---|
| 2024年11月5日 | 5-for-1 | 順 |
| 2006年9月7日 | 2-for-1 | 順 |
Dr. Reddy's Laboratories Ltd Common Stock について Wikipediaからの企業概要
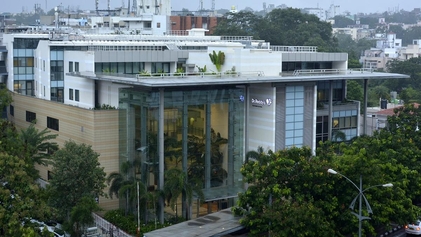
Dr. Reddy's Laboratories Ltd. is an Indian multinational pharmaceutical company based in Hyderabad, with U.S. headquarters in East Brunswick, New Jersey. The company was founded by Kallam Anji Reddy, who previously worked in the mentor institute Indian Drugs and Pharmaceuticals Limited. Dr. Reddy's manufactures and markets a wide range of pharmaceuticals in India and overseas. The company produces over 190 medications, 60 active pharmaceutical ingredients (APIs) for drug manufacture, diagnostic kits, critical care, and biotechnology.
Dr. Reddy's began as a supplier to Indian drug manufacturers, but it soon started exporting to less-regulated markets that had the advantage of not having to spend time and money on a manufacturing plant that would gain approval from a drug licensing body such as the U.S. Food and Drug Administration (FDA). By the early 1990s, the expanded scale and profitability from these unregulated markets enabled the company to begin focusing on getting approval from drug regulators for their formulations and bulk drug manufacturing plants – in more-developed economies. This allowed their movement into regulated markets such as the US and Europe.
By 2007, Dr. Reddy's had seven FDA plants producing active pharmaceutical ingredients in India and seven FDA-inspected and ISO 9001 (quality) and ISO 14001 (environmental management) certified plants making patient-ready medications – five of them in India and two in the UK.
History
Dr. Reddy's originally launched in 1984 producing active pharmaceutical ingredients. In 1986, Reddy's started operations on branded formulations. Within a year Reddy's had launched Norilet, the company's first recognised brand in India. Soon, Dr. Reddy's obtained another success with Omez, its branded omeprazole – gastrointestinal ulcer and reflux oesophagitis medication – launched at half the price of other brands on the Indian market at that time.
Within a year, Reddy's became the first Indian company to export the active ingredients for pharmaceuticals to Europe. In 1987, Reddy's started to transform itself from a supplier of pharmaceutical ingredients to other manufacturers into a manufacturer of pharmaceutical products. In 1999, Dr. Reddy's joined the Indian Pharmaceutical Alliance as a founding member in an effort to promote the development of generic drugs in India.
International expansion
The company's first international move took it to Russia in 1992. There, Dr. Reddy's formed a joint venture with the country's biggest pharmaceuticals producer, Biomed. They pulled out in 1995 amid accusations of scandal, involving "a significant material loss due to the activities of Moscow's branch of Reddy's Labs with the help of Biomed's chief executive". Reddy's sold the joint venture to the Kremlin-friendly Sistema group.
In 1993, Reddy's entered into a joint venture in the Middle East and created two formulation units there and in Russia. Reddy's exported bulk drugs to these formulation units, which then converted them into finished products. In 1994, Reddy's started targeting the US generic market by building state of art manufacturing facility.
New drug discovery
Reddy's path into new drug discovery involved targeting specialty generics products in western markets to create a foundation for drug discovery. Development of specialty generics was an important step for the company's growing interest in the development of new chemical entities. The elements involved in creating a specialty generic, such as innovation in the laboratory, developing the compound, and sending the sales team to the market, are also stages in the development of a new specialty drug. Starting with specialty generics allowed the company to gain experience with those steps before moving on to creating brand-new drugs.
Reddy's invested heavily in establishing R&D labs and is the only Indian company to have significant R&D being undertaken overseas. Dr. Reddy's Research Foundation was established in 1992 and in order to do research in the area of new drug discovery. At first, the foundation's drug research strategy revolved around searching for analogues. Focus has since changed to innovative R&D, hiring new scientists, especially Indian students studying abroad on doctoral and post-doctoral courses. In 2000, the Foundation set up an American laboratory in Atlanta, dedicated to discovery and design of novel therapeutics. The laboratory is called Reddy US Therapeutics Inc (RUSTI) and its main aim is the discovery of next-generation drugs using genomics and proteomics. Reddy's research thrust focused on large niche areas in western markets – anti-cancer, anti-diabetes, cardiovascular and anti-infection drugs.
Reddy's international marketing successes were built on a strong manufacturing base which itself was a result of inorganic growth through acquisition of international and national facilities. Reddy's merged Cheminor Drug Limited (CDL) with the primary aim of supplying active pharmaceutical ingredients to the technically demanding markets of North America and Europe. This merger also gave Reddy's an entry into the value-added generics business in the regulated markets of APIs.
Expansion and acquisition
By 1997, Reddy's made the transition from being an API and bulk drug supplier to regulated markets like the US and the UK, and a branded formulations supplier in unregulated markets like India and Russia, into producing generics, by filing an Abbreviated New Drug Application (ANDA) in the USA. The same year, Reddy's out-licensed a molecule for clinical trials to Novo Nordisk, a Danish pharmaceutical company.
It strengthened its Indian manufacturing operations by acquiring American Remedies Ltd. in 1999. This acquisition made Reddy's the third largest pharmaceutical company in India, after Ranbaxy and Glaxo (I) Ltd., with a full spectrum of pharmaceutical products, which included bulk drugs, intermediates, finished dosages, chemical synthesis, diagnostics and biotechnology.
Reddy's also started exploiting Para 4 filing as a strategy in bringing new drugs to the market at a faster pace. In 1999 it submitted a Para 4 application for omeprazole, the drug that had been the cornerstone of its success in India. In December 2000, Reddy's had undertaken its first commercial launch of a generic product in the US, and its first product with market exclusivity was launched there in August 2001. The same year, it also became the first non-Japanese pharmaceutical company from the Asia-Pacific region to obtain a New York Stock Exchange listing.
In 2001 Reddy's became the first Indian company to launch the generic drug, fluoxetine (a generic version of Eli Lilly and Company’s Prozac) with 180-day market exclusivity in the USA. Prozac had sales in excess of $1 billion per year in the late 1990s. Barr Laboratories of the U.S. obtained exclusivity for all of the approved dosage forms (10 mg, 20 mg) except one (40 mg), which was obtained by Reddy's. Lilly had numerous other patents surrounding the drug compound and had already enjoyed a long period of patent protection. The case to allow generic sales was heard twice by the Federal Circuit Court, and Reddy's won both hearings. Reddy's generated nearly $70 million in revenue during the initial six-month exclusivity period. With such high returns at stake, Reddy's was gambling on the success of the litigation; failure to win the case could have cost them millions of dollars, depending on the length of the trial.
The fluoxetine marketing success was followed by the American launch of Reddy's house-branded ibuprofen tablets in 400, 600 and 800 mg strengths, in January 2003. Direct marketing under the Reddy's brand name represented a significant step in the company's efforts to build a strong and sustainable US generic business. It was the first step in building Reddy's fully-fledged distribution network in the US market.
In 2015, Dr. Reddy's Laboratories bought the established brands of Belgian drugmaker UCB SA in South Asia for ₹8 billion ($128.38 million). Dr. Reddy's Laboratories also signed a licensing pact with XenoPort for their experimental treatment to treat plaque psoriasis. As per the agreement, Dr. Reddy's will be granted exclusive US rights to develop and commercialise XP23829 for all indications for an upfront payment of $47.5 million.
In March 2024, Dr. Reddy's Laboratories partnered with Pharmazz Inc. to bring life-saving Centhaquine (Lyfaquin) to India.
American IPO and expansion into Europe
In 2001, Reddy's completed its US initial public offering of $132.8 million, secured by American Depositary Receipts. At that time the company also became listed on the New York Stock Exchange. Funds raised from the initial public offering helped Reddy's move into international production and take over technology-based companies.
In 2003, Reddy's also invested $5.25 million (USD) in equity capital into Bio Sciences Ltd.
Auriegene Discovery Technologies, a contract research company, was established as a fully owned subsidiary of Reddy's in 2002. Auriegene's objective was to gain experience in drug discovery through contract research for other pharmaceutical companies. Reddy's entered into a venture investment agreement with ICICI Bank, an established Indian banking company. Under the terms of the agreement, ICICI Venture agreed to fund the development, registration and legal costs related to the commercialisation of ANDAs on a pre-determined basis. Upon commercialisation of these products, Dr. Reddy's pays ICICI Venture royalty on net sales for a period of 5 years.
Global expansion
The company elected to expand globally, and acquired other entities. In March 2002, Dr. Reddy's acquired BMS Laboratories, Beverley, and its wholly owned subsidiary Meridian Healthcare, for €14.81 million. These companies deal in oral solids, liquids and packaging, with manufacturing facilities in London and Beverley in the UK. Recently, Dr. Reddy's entered into an R&D and commercialisation agreement with Argenta Discovery Ltd., a private drug development company based in the UK, for the treatment of chronic obstructive pulmonary disease (COPD).
Dr. Reddy's entered into a 10-year agreement with Rheoscience A/S of Denmark for the joint development and commercialisation of Balaglitazone (DRF-2593), a molecule for the treatment of type-2 diabetes. Rheoscience holds this product's marketing rights for the European Union and China, while the rights for the US and the rest of the world will be held by Dr. Reddy's. Dr. Reddy's conducted clinical trials of its cardiovascular drug RUS 3108 in Belfast, Northern Ireland, in 2005. The trials were conducted to study the safety and the pharmacokinetic profiles of the drug, which is intended for the treatment of atherosclerosis, a major cause of cardiovascular disorders.
Dr. Reddy's entered into a marketing agreement with Eurodrug Laboratories, a pharmaceutical company based in Netherlands, for improving its product portfolio for respiratory diseases. It introduced a second-generation xanthine bronchodilator, doxofylline, which is used for the treatment of asthma and COPD patients.
In 2004, Reddy's acquired Trigenesis Therapeutics Inc; a US-based private dermatology company. This acquisition gave Reddy's access to proprietary products and technologies in the dermatology sector.
Dr. Reddy's Para 4 application strategy for generic business received a severe setback when Reddy's lost the patent challenge in the case of Pfizer’s drug Norvasc (amlodipine maleate), a drug indicated for the treatment of hypertension and angina. The cost involved in patent litigation as well as the unexpected loss of the patent challenge affected Reddy's plans to start specialty business in the US generic markets.
In March 2006, Dr. Reddy's acquired Betapharm Arzneimittel GmbH from 3i for 480 million Euros. Betapharm is Germany's fourth-largest generics pharmaceutical company, with a 3.5% market share, including 150 active pharmaceutical ingredients.
Reddy's has promoted India's first integrated drug development company Perlecan Pharma Pvt Ltd together with ICICI ventures capital fund management company Ltd and Citigroup Venture Capital International growth partnership Mauritius Ltd. The combined entity will undertake clinical development and out-licensing of new chemical entity assets.
Dr. Reddy's is presently licensed by Merck & Co. to sell an authorised generic version of the popular drug simvastatin (Zocor) in the USA. Since Dr. Reddy's has a licence from Merck, it was not subject to the exclusivity period on generic simvastatin, which ended in 2006.
As of 2006, Dr. Reddy's Laboratories exceeded US$500 million in revenues, flowing from their APIs, branded formulations and generics segments; the former two segments account for almost 75% of revenues. Dr. Reddy's deals in and manages all the processes, from the development of the API to the submission of finished dosage dossiers to the regulatory agencies.
In 2010, the family-controlled Dr Reddy's denied that it was in talks to sell its generics business in India to US pharmaceutical giant Pfizer, which had been suing the company for alleged patent infringement after Dr Reddy's announced that it intended to produce a generic version of atorvastatin, marketed by Pfizer as Lipitor, an anti-cholesterol medication. Reddy's was already linked to UK pharmaceuticals multinational Glaxo Smithkline.
In September 2020, the company partnered with the Russian Direct Investment Fund to conduct phase 3 trials of the Sputnik V COVID-19 vaccine in India, and manufacture and distribute up to 100 million doses of the vaccine in India via its subsidiary Hetero Biopharma once approved by the Drugs Controller General (DCGI). The vaccine moved to late-stage trials in January 2021, and was approved for emergency use on 12 April 2021 after phase 3 trials concluded with results comparable to the late-stage trial in Russia.
Patient-centric initiatives
In September 2016, Dr. Reddy's launched “Purple Health” in India, a patient centric platform to deliver solutions that address unmet needs of patients. Purple Health will address unmet needs of patients involving four segments: awareness, access (access to medication), adherence (adherence to therapy) and experience (simplified medication experience).
The first step in this program will be the launch of new patient friendly packaging for its top 25 best-selling brands, which will be rolled-out in a phased manner over the next six months. The packaging has been designed such that blister packs would have extra space for brand name which ensures easy identification at the pharmacy, a tab at the bottom with expiry date clearly mentioned, and a pictorial representation of the time the medicine needs to be taken. In case of bottles, the measuring cup is now easy to read, and neck of the bottle has been modified to ensure minimal spillage. Purple Health also includes patient support services. For example, someone taking medicines for an advanced kidney condition would be supported by messages and counselling on diet, medicine and so on.
Issues and recalls
Drug discovery problems
In September 2005, Dr. Reddy's spun off its drug discovery and research wing into a separate company called Perlecan Pharma Private Limited. At the time, this was hailed as an innovative move, but in 2008, the company had to be wound down due to funding constraints. Dr. Reddy's was the first Indian pharma company to attempt such an effort to de-couple risk of drug discovery from the parent company by creating a separate company with an external source of funding. Perlecan Pharma was partially funded by ICICI Venture Capital and Citigroup Venture International, both of which held a 43% stake in Perlecan for an estimated $22.5 million. However, the company was forced to buy back the Perlecan shares from ICICI and Citigroup due to doubts regarding the commercial viability of the drug candidates that were in Perlecan's pipeline. At that point, Perlecan became a wholly owned subsidiary. In the board meeting of 23 October 2008, the company chose to amalgamate/absorb Perlecan, thereby making it an in-house research facility, as it was before 2005.
In 2009, the company did a U-turn and has handed over discovery research and related intellectual property to its Bangalore-based subsidiary, with the possibility of spinning it off as a different entity altogether. "The company may be hoping to find a strategic partner in the future to share the risks and research funding."
2011 recalls of Simvastatin and Toprol products
In June 2011, certain lots of Dr. Reddy's generic Simvastatin tablets were recalled due to tablets having a "musty" or "moldy" smell.
On 24 June 2014, The New York Times published an article "Warning Unheeded, Heart Drugs Are Recalled" in which it said another large Indian manufacturer and "Dr. Reddy's Laboratories, have announced recalls over the past two months totalling more than 100,000 bottles" of "a widely used heart drug, Toprol XL" "because their products were not dissolving properly".
2014 FDA Form 483
In December 2014 the FDA issued a Form 483 letter over concerns discovered during an inspection of its Srikakulam facility. No specific violations were mentioned in the letter.
2019 recall of Ranitidine products
In 2019, Dr. Reddy's recalled all ranitidine products in the US market due to contamination with the carcinogen N-nitrosodimethylamine (NDMA). Months later, all brands of ranitidine were recalled and it was taken off the US market, as the carcinogen was an unavoidable byproduct.
2020 recalls of Nitrofurantoin and Aripiprazole products
In 2020 Dr. Reddy's Laboratories (UK) Ltd recalled a specific batch of nitrofurantoin 50 mg tablets from pharmacies and wholesalers due to dissolution during routine stability testing and a specific batch of aripiprazole due to the potential for small particles of aripiprazole active material to be present which may affect the efficacy of the product.
2026 recalls of Semaglutide
In mid August 2026, Dr. Reddy's Laboratories Canada Inc. issued a class 2 recall on its Semaglutide Injection due to affected lots containing a 4 mg pen but is labelled as a 2 mg pen.
Pollution
Dr. Reddy's has been accused of polluting agricultural land surrounding its plant in Nalgonda district of Telangana.
Operations in Russia
Dr. Reddy's Laboratories has faced significant criticism for its continued operations in Russia, despite the ongoing invasion of Ukraine and the imposition of international sanctions on the country. While many global pharmaceutical companies have ceased or drastically reduced their presence in Russia in response to the invasion, Dr. Reddy's has remained steadfast in maintaining its business there. In May 2022, the company reported a surge in sales, with revenues in Russia increasing by 70% year-over-year. The company's leadership declared that operations were continuing "as usual," and even announced plans to launch new products in the Russian market. This decision has sparked widespread ethical concerns, as Dr. Reddy's has been accused of prioritizing profits over the human suffering caused by the war. Despite the global condemnation of Russia's actions and the continued killings of civilians in Ukraine, Dr. Reddy's refusal to withdraw from Russia has raised questions about its commitment to international norms and human rights. The company has also faced backlash for its ties to the Russian Direct Investment Fund (RDIF), which has backed the Sputnik V vaccine, further complicating its position amid the conflict. By continuing operations in Russia, Dr. Reddy's is seen as contributing to the Russian economy and, by extension, supporting a regime responsible for war crimes and aggression. The company's continued presence in Russia stands in stark contrast to the actions of many of its Western counterparts, who have pulled out or scaled down their operations to align with global sanctions and the broader call for economic isolation of Russia. As the conflict in Ukraine rages on, Dr. Reddy's decision to remain in Russia raises serious concerns about the ethical implications of doing business with a country under international sanctions, while the rest of the world seeks to hold Russia accountable for its actions. Other viewpoints, particularly those outside the European and American centric western viewpoint, take the position that denying life saving pharmaceutical treatment by seeking to stop the flow of pharmaceutical goods to the common people in those countries whose actions are perceived as hostile, violent and inappropriate, such as Russia, is a deeply immoral act, and that by continuing to provide lifesaving medication to everyday citizens who have no connection to their government's foreign policy Dr. Reddy is acting in a deeply ethical way.
Key products
=== Top active pharmaceutical ingredients ===
出典: Wikipedia (英語), CC BY-SA 4.0 · Wikipediaで表示 ↗
10年間のパフォーマンス 収益、純利益、利益率、EPSのトレンド
バリュエーション P/E、P/S、P/B、EV/EBITDA比率 — 株は割高か割安か?
| 指標 | 5年トレンド | RDY | 5年平均 | 競合中央値 | 結論 |
|---|---|---|---|---|---|
| P/E | 25.25年平均 ≈5.2 | ≈5.2 | · | · |
同業他社の中央値は、指標ごとに標準化された基準で計算されており、この銘柄に表示されているTTM/MRQ基準と常に一致するとは限りません。
収益性 粗利益率、営業利益率、純利益率、ROE、ROA、ROIC
| 指標 | 5年トレンド | RDY | 5年平均 | 競合中央値 | 結論 |
|---|---|---|---|---|---|
| Gross Margin (粗利益率) | 52.8%5年平均 ≈55.9% | ≈55.9% | · | · | |
| Operating Margin (営業利益率) | 15.1%5年平均 ≈19.7% | ≈19.7% | · | · | |
| EBITDA Margin (EBITDAマージン) | 15.1%5年平均 ≈19.7% | ≈19.7% | · | · | |
| Pretax Margin (税引前利益率) | 16.3%5年平均 ≈21.1% | ≈21.1% | · | · | |
| Net Profit Margin (純利益率) | 12.7%5年平均 ≈15.9% | ≈15.9% | · | · | |
| ROA | 0.18%5年平均 ≈0.31% | ≈0.31% | · | · | |
| ROE | 0.27%5年平均 ≈0.45% | ≈0.45% | · | · | |
| ROIC | 10.4%5年平均 ≈15.0% | ≈15.0% | · | · |
財務健全性 負債、流動性、支払能力 — バランスシートの健全性
| 指標 | 5年トレンド | RDY | 5年平均 | 競合中央値 | 結論 |
|---|---|---|---|---|---|
| Current Ratio (流動比率) | 1.85年平均 ≈2.1 | ≈2.1 | · | · | |
| Quick Ratio (クイックレシオ) | 0.75年平均 ≈0.8 | ≈0.8 | · | · | |
| Interest Coverage (インタレスト・カバレッジ) | 0.15年平均 ≈0.4 | ≈0.4 | · | · |
成長 収益、EPS、純利益の成長率:前年比、3年CAGR、5年CAGR
この指標グループを計算するには、まだファンダメンタルズデータが不足しています。
資本効率 総資産回転率、棚卸資産回転率、売掛金回転率
| 指標 | 5年トレンド | RDY | 5年平均 | 競合中央値 | 結論 |
|---|---|---|---|---|---|
| Asset Turnover (総資産回転率) | 0.05年平均 ≈0.0 | ≈0.0 | · | · | |
| Inventory Turnover (棚卸資産回転率) | 0.05年平均 ≈0.1 | ≈0.1 | · | · | |
| Receivables Turnover (売掛金回転率) | 0.15年平均 ≈0.1 | ≈0.1 | · | · | |
| Revenue / Employee (年間売上高 ÷ 従業員数(yfinanceの報告ヘッドカウント)。派生値 — SEC-XBRLの保存概念ではありません。) | ≈$130.1K | · | · | · |
バリュエーション · ≈ 5年平均 · 業界中央値 · 中央値に対する評価
配当金 利回り、配当性向、配当履歴、5年CAGR
| 権利落ち日 | 金額 | 通貨 | 利回り |
|---|---|---|---|
| 7月 24, 2026 | $0.08 | USD | ≈0.70% |
| 7月 25, 2025 | $0.09 | USD | ≈0.62% |
| 7月 30, 2024 | $0.10 | USD | ≈0.59% |
| 7月 28, 2023 | $0.10 | USD | ≈1.4% |
| 7月 7, 2023 | $0.10 | USD | ≈1.4% |
| 8月 1, 2022 | $0.08 | USD | ≈1.5% |
| 7月 8, 2022 | $0.08 | USD | ≈0.70% |
| 7月 30, 2021 | $0.07 | USD | ≈1.1% |
| 7月 8, 2021 | $0.07 | USD | ≈0.46% |
| 7月 10, 2020 | $0.07 | USD | ≈0.63% |
| 7月 12, 2019 | $0.06 | USD | ≈0.76% |
| 7月 13, 2018 | $0.06 | USD | ≈0.89% |
| 7月 13, 2017 | $0.06 | USD | ≈0.74% |
| 7月 14, 2016 | $0.06 | USD | ≈0.55% |
| 7月 8, 2015 | $0.06 | USD | ≈0.54% |
| 8月 1, 2014 | $0.06 | USD | ≈0.68% |
| 7月 10, 2013 | $0.05 | USD | ≈0.70% |
| 6月 27, 2012 | $0.05 | USD | ≈0.80% |
| 6月 29, 2011 | $0.05 | USD | ≈2.6% |
| 6月 14, 2011 | $0.13 | USD | ≈2.6% |
決算履歴 EPS実績 vs 予想、サプライズ%、達成率、次回決算日
| 期間 | レポート | EPS Actual | EPS 予想 | サプライズ |
|---|---|---|---|---|
| 2026年6月30日 | $5.33 | $9.03 | -41.0% | |
| 2026年3月31日 | $2.65 | $11.40 | -76.8% | |
| 2025年12月31日 | $14.52 | $13.87 | 4.7% | |
| 2025年9月30日 | $16.17 | $17.68 | -8.5% | |
| 2025年6月30日 | $17.02 | $18.25 | -6.7% | |
| 2025年3月31日 | $19.10 | $18.59 | 2.8% |
完全なファンダメンタルズ 年次別全指標 — 損益計算書、貸借対照表、キャッシュフロー
損益計算書
| 指標 | トレンド | 2026 | 2025 | 2024 | 2023 | 2022 | 2021 | 2020 | 2019 | 2018 | 2017 |
|---|---|---|---|---|---|---|---|---|---|---|---|
| Revenue | $3.58B | $325.54B | $279.16B | $245.88B | $214.39B | $189.72B | $174.60B | $153.85B | $142.03B | $140.81B | |
| Cost of Revenue | $1.69B | $135.11B | $115.56B | $106.54B | $100.55B | $86.64B | $80.59B | $70.42B | $65.72B | $62.45B | |
| Gross Profit | $1.89B | $190.43B | $163.61B | $139.34B | $113.84B | $103.08B | $94.01B | $83.43B | $76.30B | $78.36B | |
| R&D Expense | $256M | $27.38B | $22.87B | $19.38B | $17.48B | $16.54B | $15.41B | $15.61B | $18.27B | $19.55B | |
| SG&A Expense | $1.14B | $93.87B | $77.20B | $68.03B | $62.08B | $54.65B | $50.13B | $48.68B | $46.86B | $46.37B | |
| Operating Income | $539M | $71.84B | $67.73B | $57.14B | $29.48B | $24.28B | $15.99B | $20.89B | $11.92B | $13.50B | |
| Interest Expense | $3.74B | $2.83B | $1.71B | $1.43B | $958M | $970M | $983M | $889M | $788M | $634M | |
| Interest Income | $84M | $7.55B | $5.71B | $4.28B | $3.08B | $2.62B | $2.46B | $2.28B | $2.90B | $1.59B | |
| Pretax Income | $584M | $76.78B | $71.87B | $60.37B | $32.30B | $26.41B | $18.03B | $22.44B | $14.34B | $14.65B | |
| Income Tax | $132M | $19.54B | $16.19B | $15.30B | $8.73B | $9.18B | $-1.47B | $3.65B | $4.54B | $2.61B | |
| Net Income | $456M | $56.54B | $55.68B | $45.07B | $23.57B | $17.24B | $19.50B | $18.80B | $9.81B | $12.04B | |
| EPS (Basic) | $0.55 | $67.88 | $66.93 | $54.28 | $142.08 | $103.94 | $117.63 | $113.28 | $59.13 | $72.24 | |
| EPS (Diluted) | $0.55 | $67.78 | $66.80 | $54.17 | $141.69 | $103.65 | $117.40 | $113.09 | $59.00 | $72.09 | |
| Shares (Basic) | 832,440,587 | 832,950,406 | 831,968,515 | 830,174,450 | 165,882,697 | 165,844,340 | 165,758,384 | 165,914,036 | 165,845,408 | 166,648,943 | |
| Shares (Diluted) | 833,331,689 | 834,179,134 | 833,537,680 | 831,940,850 | 166,338,634 | 166,316,041 | 166,081,985 | 166,192,754 | 166,185,552 | 166,997,675 | |
| EBITDA | $539M | $842M | $813M | $695M | $389M | $24.28B | $212M | $20.89B | $23.63B | · |
貸借対照表
| 指標 | トレンド | 2026 | 2025 | 2024 | 2023 | 2022 | 2021 | 2020 | 2019 | 2018 | 2017 |
|---|---|---|---|---|---|---|---|---|---|---|---|
| Cash & Equivalents | $164M | $14.65B | $7.11B | $5.78B | $14.85B | $14.83B | $2.05B | $2.23B | $2.64B | $3.87B | |
| Receivables | $1.08B | $90.42B | $80.30B | $72.48B | $66.76B | $49.64B | $50.28B | $39.87B | $40.62B | $38.06B | |
| Inventory | $816M | $71.08B | $63.55B | $48.67B | $50.88B | $45.41B | $35.07B | $33.58B | $29.09B | $28.53B | |
| Current Assets | $3.22B | $250.11B | $248.05B | $204.25B | $181.86B | $148.25B | $130.37B | $114.50B | $109.64B | $100.38B | |
| PP&E (Net) | $1.24B | $97.76B | $76.89B | $66.46B | $62.17B | $57.11B | $52.33B | $54.09B | $57.87B | $57.16B | |
| Goodwill | $137M | $11.81B | $4.25B | $4.25B | $4.42B | $4.57B | $3.99B | $3.90B | $3.94B | $3.75B | |
| Intangibles | $1.12B | $96.80B | $36.95B | $30.85B | $27.25B | $35.65B | $27.66B | $44.37B | $44.66B | $44.92B | |
| Total Assets | $6.17B | $492.99B | $387.52B | $321.85B | $292.83B | $265.49B | $232.24B | $225.43B | $225.60B | $219.82B | |
| Accounts Payable | $356M | $35.52B | $30.92B | $26.44B | $25.57B | $23.74B | $16.66B | $14.55B | $16.05B | $13.42B | |
| Current Liabilities | $1.79B | $130.39B | $96.04B | $85.84B | $94.02B | $83.39B | $72.81B | $59.70B | $69.69B | $85.00B | |
| Total Liabilities | $2.12B | $155.82B | $106.97B | $90.86B | $102.30B | $92.43B | $77.25B | $85.23B | $99.14B | $95.78B | |
| Retained Earnings | $3.75B | $315.79B | $265.26B | $215.59B | $175.71B | $156.02B | $144.25B | $128.65B | $113.86B | $108.05B | |
| Stockholders' Equity | $4.02B | $333.39B | $280.55B | $230.99B | $190.53B | $173.06B | $154.99B | $140.20B | $126.46B | $124.04B |
キャッシュフロー
| 指標 | トレンド | 2026 | 2025 | 2024 | 2023 | 2022 | 2021 | 2020 | 2019 | 2018 | 2017 |
|---|---|---|---|---|---|---|---|---|---|---|---|
| D&A | · | · | · | · | · | · | · | · | $11.71B | $11.28B | |
| Other Non-cash | · | · | · | · | · | · | · | · | $-3.49B | · | |
| Operating Cash Flow | $607M | $46.43B | $45.43B | $58.88B | $28.11B | $35.70B | $29.84B | $28.70B | $18.03B | $21.51B | |
| CapEx | $249M | $27.50B | $16.40B | $11.32B | $14.66B | $9.74B | $4.85B | $6.96B | $9.29B | $12.28B | |
| Investing Cash Flow | $-700M | $-58.08B | $-40.28B | $-41.37B | $-26.39B | $-22.66B | $-4.92B | $-7.73B | $-14.88B | $-18.47B | |
| Dividends Paid | $71M | $6.66B | $6.65B | $4.98B | $4.15B | $4.15B | $3.92B | $4.00B | $3.99B | $3.39B | |
| Financing Cash Flow | $88M | $18.91B | $-3.76B | $-26.86B | $-2.42B | $-298M | $-25.16B | $-21.33B | $-4.44B | $-3.69B | |
| Free Cash Flow | $358M | $223M | $348M | $578M | $177M | $355M | $332M | $314M | $17.89B | · | |
| Levered FCF | $-2.54B | $-1.89B | $-978M | $-488M | $-522M | $-278M | $-731M | $-430M | $17.35B | · |
収益性
| 指標 | トレンド | 2026 | 2025 | 2024 | 2023 | 2022 | 2021 | 2020 | 2019 | 2018 | 2017 |
|---|---|---|---|---|---|---|---|---|---|---|---|
| Gross Margin | 52.8% | 58.5% | 58.6% | 56.6% | 53.1% | 54.3% | 0.71% | 0.78% | 53.7% | · | |
| Operating Margin | 15.1% | 22.1% | 24.3% | 23.2% | 13.8% | 12.8% | 0.12% | 13.6% | 8.4% | · | |
| Net Margin | 12.7% | 17.4% | 19.9% | 18.3% | 11.0% | 9.1% | 0.15% | 0.18% | 6.9% | · | |
| Pretax Margin | 16.3% | 23.6% | 25.7% | 24.5% | 15.1% | 13.9% | 10.3% | 14.6% | 10.1% | · | |
| EBITDA Margin | 15.1% | 22.1% | 24.3% | 23.2% | 13.8% | 12.8% | 0.12% | 13.6% | 16.6% | · | |
| ROA | 0.18% | 0.34% | 0.41% | 0.37% | 0.23% | 14.6% | 0.23% | 0.24% | 4.4% | · | |
| ROE | 0.27% | 0.47% | 0.57% | 0.57% | 0.35% | 21.9% | 0.36% | 0.42% | 15.6% | · | |
| ROIC | 10.4% | 16.1% | 18.7% | 18.5% | 11.3% | 669.7% | 11.2% | 863.0% | 419.6% | · |
流動性と支払能力
| 指標 | トレンド | 2026 | 2025 | 2024 | 2023 | 2022 | 2021 | 2020 | 2019 | 2018 | 2017 |
|---|---|---|---|---|---|---|---|---|---|---|---|
| Current Ratio | 1.8 | 1.9 | 2.6 | 2.4 | 1.9 | 1.8 | 1.8 | 1.9 | 102.5 | · | |
| Quick Ratio | 0.7 | 0.8 | 0.9 | 0.9 | 0.9 | 56.6 | 0.7 | 3.2 | 40.4 | · | |
| Interest Coverage | 0.1 | 0.3 | 0.5 | 0.5 | 0.4 | 25.0 | 0.2 | 23.5 | 15.1 | · |
効率性
| 指標 | トレンド | 2026 | 2025 | 2024 | 2023 | 2022 | 2021 | 2020 | 2019 | 2018 | 2017 |
|---|---|---|---|---|---|---|---|---|---|---|---|
| Asset Turnover | 0.0 | 0.0 | 0.0 | 0.0 | 0.0 | 1.6 | 1.5 | 1.3 | 0.6 | · | |
| Inventory Turnover | 0.0 | 0.0 | 0.1 | 0.1 | 0.1 | 2.2 | 0.0 | 0.0 | 2.3 | · | |
| Receivables Turnover | 0.1 | 0.1 | 0.1 | 0.1 | 0.1 | 3.8 | 8.6 | 7.5 | 3.6 | · |
1株あたり
| 指標 | トレンド | 2026 | 2025 | 2024 | 2023 | 2022 | 2021 | 2020 | 2019 | 2018 | 2017 |
|---|---|---|---|---|---|---|---|---|---|---|---|
| Revenue / Share | $4.30 | $4.57 | $20.10 | $17.98 | $16.99 | $1140.73 | $1051.29 | $925.74 | $854.64 | · | |
| Cash Flow / Share | $0.73 | $0.65 | $3.27 | $4.30 | $2.22 | $2.93 | $2.38 | $2.50 | $108.49 | · | |
| Dividend / Share | $8.00 | $8.00 | $8.00 | $30.00 | $25.00 | $25.00 | $20.00 | $20.00 | $20.00 | · | |
| EPS (TTM) | $0.55 | $67.78 | $66.80 | $54.17 | $141.69 | $103.65 | $117.40 | $113.09 | $59.00 | · |
バリュエーション(TTM)
| 指標 | トレンド | 2026 | 2025 | 2024 | 2023 | 2022 | 2021 | 2020 | 2019 | 2018 | 2017 |
|---|---|---|---|---|---|---|---|---|---|---|---|
| Revenue TTM | $3.58B | $325.54B | $279.16B | $245.88B | $214.39B | $189.72B | $174.60B | $153.85B | $142.03B | · | |
| Net Income TTM | $456M | $56.54B | $55.68B | $45.07B | $23.57B | $17.24B | $19.50B | $18.80B | $9.81B | · | |
| P/E | 25.2 | 0.2 | 0.2 | 0.2 | 0.1 | 0.1 | 0.1 | 0.1 | 0.1 | · | |
| Earnings Yield | 4.0% | 513.9% | 455.3% | 475.8% | 1271.2% | 844.2% | 1455.5% | 1396.2% | 902.4% | · | |
| Payout Ratio | 15.6% | 11.8% | 12.0% | 11.1% | 17.7% | 0.33% | 20.1% | 21.3% | 40.7% | · | |
| Annual Payout | $71M | $6.66B | $6.65B | $4.98B | $4.15B | $4.15B | $3.92B | $4.00B | $3.99B | · |
1株あたり
| 指標 | トレンド | Q4 2021 | Q4 2018 | Q4 2017 | Q4 2016 | Q4 2015 | Q4 2014 | Q4 2013 | Q4 2012 | Q4 2011 | Q4 2010 | Q4 2009 | Q4 2008 | Q4 2007 | Q4 2006 | Q4 2005 | Q4 2004 |
|---|---|---|---|---|---|---|---|---|---|---|---|---|---|---|---|---|---|
| EPS (TTM) | $103.65 | $59.00 | $72.09 | $116.98 | · | · | · | · | · | · | · | · | · | · | · | · |
バリュエーション(TTM)
| 指標 | トレンド | Q4 2021 | Q4 2018 | Q4 2017 | Q4 2016 | Q4 2015 | Q4 2014 | Q4 2013 | Q4 2012 | Q4 2011 | Q4 2010 | Q4 2009 | Q4 2008 | Q4 2007 | Q4 2006 | Q4 2005 | Q4 2004 |
|---|---|---|---|---|---|---|---|---|---|---|---|---|---|---|---|---|---|
| Revenue TTM | $189.72B | $142.03B | $140.81B | $154.71B | · | · | · | · | · | · | · | · | · | · | · | · | |
| Net Income TTM | $17.24B | $9.81B | $12.04B | $20.01B | · | · | · | · | · | · | · | · | · | · | · | · | |
| P/E | 0.1 | 0.1 | 0.1 | 0.1 | · | · | · | · | · | · | · | · | · | · | · | · | |
| Earnings Yield | 844.2% | 902.4% | 897.8% | 1294.3% | · | · | · | · | · | · | · | · | · | · | · | · | |
| Annual Payout | $4.15B | $3.99B | $3.39B | $4.11B | · | · | · | · | · | · | · | · | · | · | · | · |
最新期間は左側 · null値は・として表示
財務諸表 損益計算書、貸借対照表、キャッシュフロー — 年次、過去5年間
| 指標 | 2026-03-31 | 2025-03-31 | 2024-03-31 | 2023-03-31 | 2022-03-31 |
|---|---|---|---|---|---|
| 収益 | $3.58B | $325.54B | $279.16B | $245.88B | $214.39B |
| 粗利益率 % | 52.8% | 58.5% | 58.6% | 56.6% | 53.1% |
| 営業利益率 % | 15.1% | 22.1% | 24.3% | 23.2% | 13.8% |
| 純利益 | $456M | $56.54B | $55.68B | $45.07B | $23.57B |
| 希薄化後EPS | $0.55 | $67.78 | $66.80 | $54.17 | $141.69 |
| 指標 | 2026-03-31 | 2025-03-31 | 2024-03-31 | 2023-03-31 | 2022-03-31 |
|---|---|---|---|---|---|
| 流動比率 | 1.8 | 1.9 | 2.6 | 2.4 | 1.9 |
| クイックレシオ | 0.7 | 0.8 | 0.9 | 0.9 | 0.9 |
| 指標 | 2026-03-31 | 2025-03-31 | 2024-03-31 | 2023-03-31 | 2022-03-31 |
|---|---|---|---|---|---|
| フリーキャッシュフロー | $358M | $223M | $348M | $578M | $177M |
機関投資家(13F) 254 提出者 · $1.8B合計 · 時点 2026年9月30日
四半期SECフォーム13Fでこの株式の保有を報告している機関。ロングポジションのみ。単一の提出者は、別々のオプションレッグで2回表示される場合があります。 大きな反対売買のプット/コール・レッグは、通常、マーケットメイクまたはヘッジされた在庫を反映しており、方向性への確信を示すものではありません。
| 新規ポジション | 解消済みポジション | 増加 | 減少 | 純株式数増減 |
|---|---|---|---|---|
| 31 (-15 前期比) | 36 (+11 前期比) | 69 (-30 前期比) | 97 (+37 前期比) | +5.3M |
Q1 2026と比較しました。 SECフォーム13Fの提出期限は四半期末から45日後ですが、遅延提出者向けの短いバッファーが含まれます。この期間内の四半期は、直近で完全に報告されたペアを優先するためスキップされます。
| 機関投資家 | 評価額 | 株式数 | % 追跡された13Fのうち | タイプ |
|---|---|---|---|---|
| Robeco Institutional Asset Management B.V. | $261,125,741 | 18,021,100 | 14.23% | 株式数 |
| MORGAN STANLEY | $158,467,303 | 10,936,320 | 8.63% | 株式数 |
| BlackRock, Inc. | $153,387,403 | 10,585,742 | 8.36% | 株式数 |
| ROYAL BANK OF CANADA | $133,514,000 | 9,213,269 | 7.27% | 株式数 |
| Aikya Investment Management Ltd | $123,075,915 | 8,493,852 | 6.71% | 株式数 |
| RENAISSANCE TECHNOLOGIES LLC | $106,458,436 | 7,347,028 | 5.80% | 株式数 |
| DIMENSIONAL FUND ADVISORS LP | $77,039,534 | 5,312,065 | 4.20% | 株式数 |
| VANGUARD GROUP INC | $70,582,899 | 5,027,272 | 3.85% | 株式数 |
| JPMORGAN CHASE & CO | $60,470,644 | 4,069,357 | 3.29% | 株式数 |
| STATE STREET CORP | $59,766,700 | 4,124,686 | 3.26% | 株式数 |
| ALLIANCEBERNSTEIN L.P. | $51,670,375 | 3,730,713 | 2.82% | 株式数 |
| VANGUARD CAPITAL MANAGEMENT LLC | $44,932,200 | 3,100,911 | 2.45% | 株式数 |
| FRANKLIN RESOURCES INC | $41,218,010 | 2,844,583 | 2.25% | 株式数 |
| Nuveen, LLC | $40,973,353 | 2,827,699 | 2.23% | 株式数 |
| BNP PARIBAS FINANCIAL MARKETS | $38,396,558 | 2,649,866 | 2.09% | 株式数 |
| MARSHALL WACE, LLP | $29,347,409 | 2,025,356 | 1.60% | 株式数 |
| AMERICAN CENTURY COMPANIES INC | $26,529,495 | 1,830,883 | 1.45% | 株式数 |
| SCHRODER INVESTMENT MANAGEMENT GROUP | $24,049,483 | 1,618,404 | 1.31% | 株式数 |
| UBS Group AG | $24,032,186 | 1,658,536 | 1.31% | 株式数 |
| VANGUARD PORTFOLIO MANAGEMENT LLC | $22,059,011 | 1,522,361 | 1.20% | 株式数 |
| Creative Planning | $17,979,881 | 1,240,848 | 0.98% | 株式数 |
| LAZARD ASSET MANAGEMENT LLC | $17,847,014 | 1,231,678 | 0.97% | 株式数 |
| GOLDMAN SACHS GROUP INC | $15,265,022 | 1,053,487 | 0.83% | 株式数 |
| NORTHERN TRUST CORP | $14,992,092 | 1,034,651 | 0.82% | 株式数 |
| Quantinno Capital Management LP | $9,309,636 | 642,486 | 0.51% | 株式数 |
| NEW YORK STATE COMMON RETIREMENT FUND | $8,530,350 | 588,706 | 0.46% | 株式数 |
| AQR CAPITAL MANAGEMENT LLC | $8,008,701 | 552,705 | 0.44% | 株式数 |
| Invesco Ltd. | $7,390,943 | 510,072 | 0.40% | 株式数 |
| ARROWSTREET CAPITAL, LIMITED PARTNERSHIP | $7,087,088 | 489,102 | 0.39% | 株式数 |
| MASSACHUSETTS FINANCIAL SERVICES CO /MA/ | $6,814,636 | 475,589 | 0.37% | 株式数 |
| MILLENNIUM MANAGEMENT LLC | $6,786,754 | 468,375 | 0.37% | 株式数 |
| B. Metzler seel. Sohn & Co. AG | $6,296,325 | 434,529 | 0.34% | 株式数 |
| DZ BANK AG Deutsche Zentral Genossenschafts Bank, Frankfurt am Main | $5,926,410 | 409,000 | 0.32% | 株式数 |
| BANK OF AMERICA CORP /DE/ | $5,832,312 | 402,506 | 0.32% | 株式数 |
| Man Group plc | $5,386,918 | 371,768 | 0.29% | 株式数 |
| Pinpoint Asset Management Ltd | $5,020,444 | 380,625 | 0.27% | 株式数 |
| SEI INVESTMENTS CO | $4,842,876 | 334,234 | 0.26% | 株式数 |
| Vanguard Personalized Indexing Management, LLC | $4,828,749 | 333,247 | 0.26% | 株式数 |
| JANE STREET GROUP, LLC | $4,011,918 | 276,875 | 0.22% | 株式数 |
| Laird Norton Wetherby Trust Company, LLC | $3,609,328 | 249,091 | 0.20% | 株式数 |
| RHUMBLINE ADVISERS | $3,433,732 | 236,973 | 0.19% | 株式数 |
| Connor, Clark & Lunn Investment Management Ltd. | $3,361,376 | 231,979 | 0.18% | 株式数 |
| Northwest & Ethical Investments L.P. | $3,222,286 | 222,380 | 0.18% | 株式数 |
| State of New Jersey Common Pension Fund D | $3,193,306 | 220,380 | 0.17% | 株式数 |
| Corient Private Wealth LP | $3,039,885 | 209,792 | 0.17% | 株式数 |
| CITIGROUP INC | $2,768,648 | 191,073 | 0.15% | 株式数 |
| US BANCORP \DE\ | $2,739,016 | 189,028 | 0.15% | 株式数 |
| Vident Advisory, LLC | $2,714,157 | 187,312 | 0.15% | 株式数 |
| Laird Norton Wetherby Wealth Management, LLC | $2,688,858 | 192,336 | 0.15% | 株式数 |
| Cerity Partners LLC | $2,677,349 | 184,772 | 0.15% | 株式数 |
アクティビストおよび5%超のオーナー 4保有
SECスケジュール13Dを提出した投資家 — 発行体の影響を与える意図(アクティビストの保有、取締役会キャンペーン、M&A)を持つ5%超の受益権所有。各行は、その提出者のポジションの最新の既知の状態を示します。
| 提出者 | 提出済み | 保有 | ステータス | 目的 | 提出書類 |
|---|---|---|---|---|---|
| G.V. Prasad, K. Satish Reddy, GVP Family Trust, VSD Family Trust, G. Anuradha, Deepti Reddy | 2025年9月18日 | 0.00% | 修正 | · | SEC |
| APS Trust S.S. or, Mr. G.V. Prasad S.S. or, Mr. K. Satish Reddy S.S. or | 2024年7月1日 | · | 初回提出 | · | SEC |
| Dr. Reddy’s Holdings Limited (formerly Dr. Reddy’s Holdings Private Limited) S.S. or, APS Trust S.S. or, Mr. G.V. Prasad S.S. or, Mr. K. Satish Reddy S.S. or ×4 提出書類 | 2022年5月2日 | · | 初回提出 | · | SEC |
| 2002年3月5日 | · | 初回提出 | · | SEC |
Purpose is an automated classification of the filer's own stated purpose (SEC Item 4) — not investment advice. "—" means no clear purpose was stated or the text could not be classified.
ETF保有状況 12のETFが保有
ウェイトは直接株式保有(N-PORT)のみを反映しています。レバレッジ型またはデリバティブベースのファンドは、表示されていない追加のスワップエクスポージャーを保有している可能性があります。
| ファンド | ウェイト | 単位 | 時点 | ソース |
|---|---|---|---|---|
| DFEV · Dimensional ETF Trust | 0.15% | 248,668 NS | 2026年7月31日 | N-PORT |
| JEMA · J.P. Morgan Exchange-Traded Fund Tr… | 0.09% | 121,051 NS | 2026年7月31日 | N-PORT |
| SPWO · SP Funds Trust | 0.08% | 13,851 NS | 2026年7月31日 | N-PORT |
| DFSE · Dimensional ETF Trust | 0.07% | 34,164 NS | 2026年7月31日 | N-PORT |
| DEXC · Dimensional ETF Trust | 0.06% | 15,564 NS | 2026年7月31日 | N-PORT |
| DFAE · Dimensional ETF Trust | 0.05% | 411,183 NS | 2026年7月31日 | N-PORT |
| DFEM · Dimensional ETF Trust | 0.05% | 371,964 NS | 2026年7月31日 | N-PORT |
| DFAX · Dimensional ETF Trust | 0.03% | 273,895 NS | 2026年7月31日 | N-PORT |
| VWO · VANGUARD INTERNATIONAL EQUITY INDEX… | 0.02% | 1,873,980 SH | 2026年8月19日 | 日次 |
| DEHP · Dimensional ETF Trust | 0.02% | 6,774 NS | 2026年7月31日 | N-PORT |
| VEU · VANGUARD INTERNATIONAL EQUITY INDEX… | 0.01% | 352,860 SH | 2026年8月19日 | 日次 |
| VXUS · VANGUARD STAR FUNDS | 0.00% | 874,071 SH | 2026年8月19日 | 日次 |
RDY アナリストコンセンサス 強気・弱気のアナリストの見解、12ヶ月の目標株価、アップサイド
12ヶ月目標株価
5 アナリスト · 2026-10-03平均値ターゲット $13.29 +8.5%
マイ指標 あなた専用のウォッチリスト — 決算詳細から選択した行
重視する指標を選択してください — 上記の「財務諸表」の任意の行の横にある「+」をクリックしてください。
選択内容は保存され、すべてのティッカーで引き継がれます。