
VMRK Vivmark Residential Common Shares of Beneficial Interest
NYSE · SEC EDGAR で表示 ↗ 10-K/10-Q 4月 30, 2025VMRK 株価スナップショット 価格、時価総額、P/E、EPS、ROE、負債/資本、52週レンジ
VMRK 株価チャート 技術指標付きの日次 OHLCV — パン、ズーム、ビューのカスタマイズ
バーの粒度は選択した期間に合わせて調整されます。バーの始値/高値/安値/終値を確認するにはチャートにカーソルを合わせてください。
| 権利落ち日 | 分割 | タイプ |
|---|---|---|
| 2001年10月12日 | 2-for-1 | 順 |
Vivmark Residential Common Shares of Beneficial Interest について Wikipediaからの企業概要
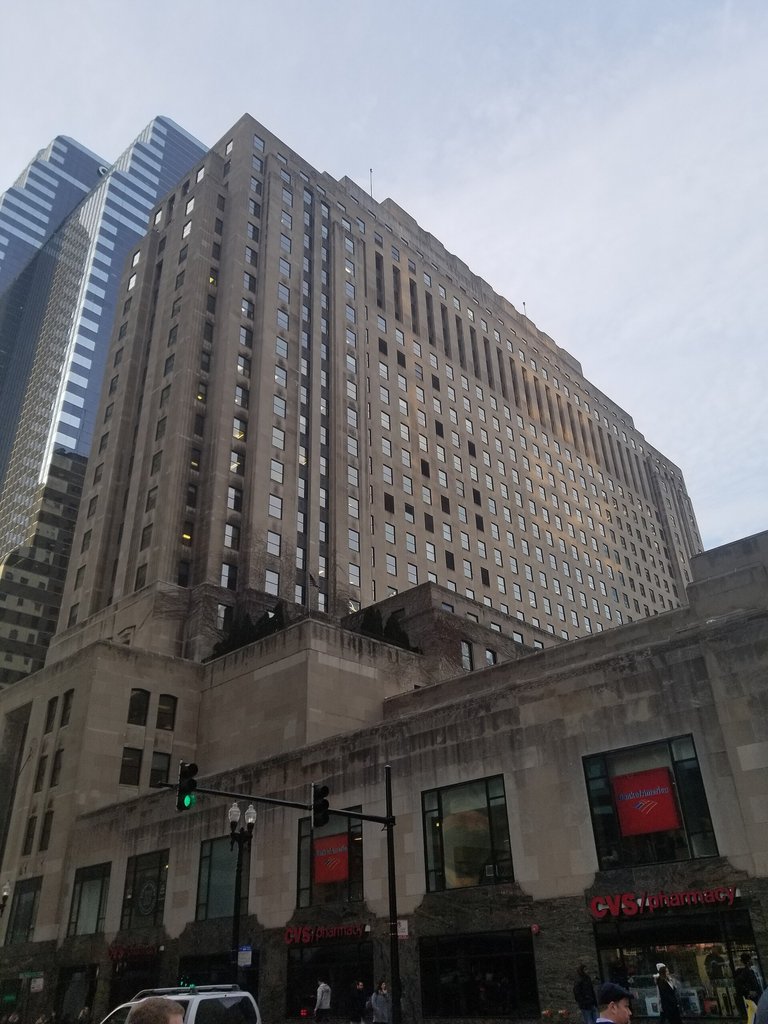
Vivmark Residential (formerly Equity Residential), based in Arlington, Virginia, and Chicago, Illinois, is a real estate investment trust that invests in apartments. As of August 2026, the company owned or had investments in 184,000 rental apartments and had over 11,100 apartments under construction.
It is the largest owner of apartments in the United States and the 18th largest apartment property manager in the United States.
History
The company had its origins in Equity Finance and Management Company, founded in 1969 by Sam Zell. In 1993, the company acquired a large portfolio of properties from Starwood Capital Group, owned by Barry Sternlicht and Bob Faith, in exchange for a 20% stake in the company. Starwood had acquired the properties via government auctions after the savings and loan crisis. In August 1993, the company became a public company via an initial public offering. At that time, the company owned 22,000 apartments.
In 1997, the company acquired Wellsford Residential Property Trust for $620 million in stock and the assumption of $346 million of debt. It also acquired Evans Withycombe Residential for $625 million in stock and the assumption of $432 million in debt.
In 1998, the company acquired a portfolio of 5,774 apartments from Lincoln Property Company for $465 million. It also acquired Merry Land, which owned 34,990 units in the southeast United States, for $1.17 billion in stock as well as $656 million in debt and $270 million in preferred stock.
In 1999, the company acquired Lexford Residential Trust for $203 million in stock and the assumption of $530 million of debt. Lexford owned mainly one-story affordable housing units, rented to households with incomes between $25,000 and $35,000.
In January 2003, CEO Douglas Crocker retired. During his tenure, the company increased its ownership from 22,000 apartments to 227,000 apartments. In 2006, the company sold its Lexford affordable housing division, which included 27,115 apartment units, for $1.09 billion.
In February 2013, the company and AvalonBay Communities closed a $9 billion deal to acquire Archstone from Lehman Brothers. In 2013, the company sold 8,010 apartment units to a joint venture of Goldman Sachs and Greystar Real Estate Partners for $1.5 billion. In 2016, the company sold 23,262 apartments to Starwood Capital Group for $5.365 billion.
In August 2026, the company acquired AvalonBay Communities and changed its name to Vivmark Residential.
Legal issues
In 2022, the company agreed to pay approximately $2 million to settle a lawsuit filed by Attorney General for the District of Columbia Karl Racine alleging that the company offered misleading rent discounts on a rent-controlled building in Washington, D.C.
The company was sued in a class action due to allegations that the late payment fees that it charged, including a $50 minimum fee even if rent was just one day late, and compounding fees and penalties, were in violation of California law. In a settlement finalized in 2026, the company agreed to pay $43 million to over 200,000 tenants in California as reimbursement of excessive fees.
In a multi-district class action lawsuit, the company and 10 other large landlords were accused of engaging in an unlawful conspiracy to use RealPage's revenue management software to share competitively sensitive data and coordinate rent increases. In 2026, as part of a settlement with all of the defendants, the company agreed to pay $56 million to settle the allegations.
出典: Wikipedia (英語), CC BY-SA 4.0 · Wikipediaで表示 ↗
10年間のパフォーマンス 収益、純利益、利益率、EPSのトレンド
バリュエーション P/E、P/S、P/B、EV/EBITDA比率 — 株は割高か割安か?
この指標グループを計算するには、まだファンダメンタルズデータが不足しています。
収益性 粗利益率、営業利益率、純利益率、ROE、ROA、ROIC
この指標グループを計算するには、まだファンダメンタルズデータが不足しています。
財務健全性 負債、流動性、支払能力 — バランスシートの健全性
この指標グループを計算するには、まだファンダメンタルズデータが不足しています。
成長 収益、EPS、純利益の成長率:前年比、3年CAGR、5年CAGR
この指標グループを計算するには、まだファンダメンタルズデータが不足しています。
資本効率 総資産回転率、棚卸資産回転率、売掛金回転率
この指標グループを計算するには、まだファンダメンタルズデータが不足しています。
バリュエーション · ≈ 5年平均 · 業界中央値 · 中央値に対する評価
配当金 利回り、配当性向、配当履歴、5年CAGR
| 権利落ち日 | 金額 | 通貨 | 利回り |
|---|---|---|---|
| 10月 5, 2026 | $0.70 | USD | ≈4.7% |
| 6月 29, 2026 | $0.70 | USD | ≈4.1% |
| 3月 30, 2026 | $0.70 | USD | ≈4.7% |
| 1月 2, 2026 | $0.69 | USD | ≈4.5% |
| 9月 25, 2025 | $0.69 | USD | ≈4.3% |
| 6月 24, 2025 | $0.69 | USD | ≈4.1% |
| 3月 31, 2025 | $0.69 | USD | ≈3.8% |
| 1月 2, 2025 | $0.68 | USD | ≈3.9% |
| 9月 24, 2024 | $0.68 | USD | ≈3.6% |
| 7月 1, 2024 | $0.68 | USD | ≈3.9% |
| 3月 22, 2024 | $0.68 | USD | ≈4.3% |
| 12月 29, 2023 | $0.66 | USD | ≈4.3% |
| 9月 25, 2023 | $0.66 | USD | ≈4.4% |
| 6月 23, 2023 | $0.66 | USD | ≈4.1% |
| 3月 24, 2023 | $0.66 | USD | ≈4.5% |
| 12月 30, 2022 | $0.63 | USD | ≈4.2% |
| 9月 23, 2022 | $0.63 | USD | ≈3.6% |
| 6月 24, 2022 | $0.63 | USD | ≈3.4% |
| 3月 25, 2022 | $0.63 | USD | ≈2.7% |
| 12月 31, 2021 | $0.60 | USD | ≈2.7% |
決算履歴 EPS実績 vs 予想、サプライズ%、達成率、次回決算日
| 期間 | レポート | EPS Actual | EPS 予想 | サプライズ |
|---|---|---|---|---|
| 2026年6月30日 | $0.31 | $0.44 | -29.7% | |
| 2026年3月31日 | $0.24 | $0.32 | -24.7% | |
| 2025年12月31日 | $1.00 | $0.40 | 153.2% | |
| 2025年9月30日 | $0.76 | $0.45 | 70.1% |
完全なファンダメンタルズ 年次別全指標 — 損益計算書、貸借対照表、キャッシュフロー
このティッカーのSEC提出書類はまだありません。
1株あたり
| 指標 | トレンド | Q4 2025 |
|---|---|---|
| EPS (TTM) | $2.29 |
バリュエーション(TTM)
| 指標 | トレンド | Q4 2025 |
|---|---|---|
| Revenue TTM | $2.70B | |
| Net Income TTM | $873M |
最新期間は左側 · null値は・として表示
企業インサイダー 31 人のインサイダー · 15人の役員 · 17人の取締役
| インサイダー | 役職 | 最終アクティビティ | 保有株式数 | 12ヶ月購入 | 12ヶ月売却 | 12ヶ月純額 |
|---|---|---|---|---|---|---|
| Benjamin Schall | President & CEO | 2026年8月17日 A | · | 0 | 0 | $0 |
| Kevin P. O'Shea | Executive Vice President & CFO | 2026年8月17日 A | · | 0 | 0 | $0 |
| Michael L Manelis | Executive Vice President & COO | 2026年8月17日 A | 44,713 | 0 | 1 | $-503,226 |
| Sean Thomas Willson | Senior Vice President & CAO | 2026年8月21日 S | 17,988 | 0 | 2 | $-35,973 |
| Matthew H. Birenbaum | Executive Vice President & CDO | 2026年8月20日 G | 272,749 | 0 | 0 | $0 |
| Pamela Rogers Thomas | EVP, Portfolio & Asset Mgmt | 2026年8月17日 A | 85,543 | 0 | 0 | $0 |
| Alaine Susan Walsh | EVP, Human Capital & Admin | 2026年8月17日 A | · | 0 | 0 | $0 |
| Scott Fenster | EVP & General Counsel | 2026年8月17日 A | · | 0 | 0 | $0 |
| Sean J. Breslin | EVP & CI & GO | 2026年8月17日 A | · | 0 | 0 | $0 |
| Edward M Schulman | EVP, Legal Affairs | 2026年8月17日 A | 48,776 | 0 | 1 | $-1,066,893 |
| Ian Kaufman | Chief Accounting Officer | 2026年8月14日 A | 29,657 | 0 | 0 | $0 |
| Christa L Sorenson | Executive Vice President | 2020年2月10日 S | 3,939 | 0 | 0 | $0 |
| Bruce C Strohm | EVP & General Counsel | 2014年12月22日 M | 2,179 | 0 | 0 | $0 |
| Gregory H Smith | Executive Vice President | 2006年2月8日 S | 46,064 | 0 | 0 | $0 |
| Edward J Geraghty | Executive Vice President | 2003年8月19日 S | 78,797 | 0 | 0 | $0 |
| Ann Hoff | 取締役 | 2026年8月17日 A | 6,330 | 0 | 0 | $0 |
| Nina P Jones | 取締役 | 2026年8月17日 A | 3,404 | 0 | 0 | $0 |
| Christopher B. Howard | 取締役 | 2026年8月17日 A | 12,730 | 0 | 1 | $-543,104 |
| Chris Carr | 取締役 | 2026年8月17日 A | 5,591 | 0 | 0 | $0 |
| Susan Swanezy | 取締役 | 2026年8月17日 A | 28,934 | 0 | 1 | $-1,001,660 |
| Terry S. Brown | 取締役 | 2026年8月17日 A | · | 0 | 0 | $0 |
| Conor C Flynn | 取締役 | 2026年8月17日 A | · | 0 | 0 | $0 |
| Angela M Aman | 取締役 | 2026年8月17日 A | · | 0 | 0 | $0 |
| Stephen E Sterrett | 取締役 | 2026年8月17日 A | 20,773 | 0 | 0 | $0 |
| David J Neithercut | 取締役 | 2026年8月17日 A | · | 0 | 0 | $0 |
| Timothy J Naughton | 取締役 | 2026年8月17日 A | 314,301 | 0 | 0 | $0 |
| Charles E Mueller JR | 取締役 | 2026年8月17日 A | 16,084 | 0 | 1 | $-511,200 |
| Mary Kay Haben | 取締役 | 2026年8月17日 A | 9,477 | 0 | 0 | $0 |
| Gerald A Spector | 取締役 | 2013年2月28日 A | 282,191 | 0 | 0 | $0 |
| Stephen O Evans | 取締役 | 2006年2月28日 A | 7,644 | 0 | 0 | $0 |
| Michael N Thompson | 取締役 | 2004年2月27日 A | 12,777 | 0 | 0 | $0 |
SECフォーム3/4/5提出書類からのインサイダー;純額=公開市場のP/Sのみ
ETF保有状況 59のETFが保有
ウェイトは直接株式保有(N-PORT)のみを反映しています。レバレッジ型またはデリバティブベースのファンドは、表示されていない追加のスワップエクスポージャーを保有している可能性があります。
| ファンド | ウェイト | 単位 | 時点 | ソース |
|---|---|---|---|---|
| REZ · iShares Trust | 8.65% | 1,095,687 SH | 2026年9月11日 | 日次 |
| ICF · iShares Trust | 4.77% | 1,448,479 SH | 2026年9月11日 | 日次 |
| USRT · iShares Trust | 4.28% | 2,912,473 SH | 2026年9月11日 | 日次 |
| IYR · iShares Trust | 3.59% | 2,258,051 SH | 2026年9月11日 | 日次 |
| RSPR · Invesco Exchange-Traded Fund Trust | 3.27% | 43,465 | 2026年10月28日 | 日次 |
| REET · iShares Trust | 2.78% | 2,075,131 SH | 2026年9月11日 | 日次 |
| ERET · iShares Trust | 2.73% | 5,650 SH | 2026年9月11日 | 日次 |
| SPHD · Invesco Exchange-Traded Fund Trust … | 1.75% | 936,925 | 2026年10月28日 | 日次 |
| PABU · iShares Trust | 1.44% | 554,426 SH | 2026年9月11日 | 日次 |
| IIGD · Invesco Exchange-Traded Self-Indexe… | 1.27% | 326,000 | 2026年10月28日 | 日次 |
| SPLV · Invesco Exchange-Traded Fund Trust … | 0.97% | 1,140,817 | 2026年10月28日 | 日次 |
| RDIV · Invesco Exchange-Traded Fund Trust … | 0.57% | 131,054 | 2026年10月28日 | 日次 |
| IWS · iShares Trust | 0.49% | 1,136,811 SH | 2026年9月11日 | 日次 |
| IMCV · iShares Trust | 0.40% | 70,805 SH | 2026年9月11日 | 日次 |
| SIZE · iShares Trust | 0.38% | 24,910 SH | 2026年9月11日 | 日次 |
| IWR · iShares Trust | 0.36% | 3,117,549 SH | 2026年9月11日 | 日次 |
| IMCB · iShares Trust | 0.33% | 85,059 SH | 2026年9月11日 | 日次 |
| QUAL · iShares Trust | 0.29% | 2,111,212 SH | 2026年9月11日 | 日次 |
| IMCG · iShares Trust | 0.27% | 163,022 SH | 2026年9月11日 | 日次 |
| XOEF · iShares Trust | 0.27% | 910 SH | 2026年9月11日 | 日次 |
| BSCQ · Invesco Exchange-Traded Self-Indexe… | 0.26% | 7,556,000 | 2026年10月28日 | 日次 |
| EUSA · iShares, Inc. | 0.21% | 60,634 SH | 2026年9月11日 | 日次 |
| LRGF · iShares Trust | 0.20% | 110,832 SH | 2026年9月11日 | 日次 |
| RSP · Invesco Exchange-Traded Fund Trust | 0.19% | 3,023,753.00 | 2026年10月28日 | 日次 |
| USXF · iShares Trust | 0.19% | 42,519 SH | 2026年9月11日 | 日次 |
| IVE · iShares Trust | 0.16% | 1,209,462 SH | 2026年9月11日 | 日次 |
| IUSV · iShares Trust | 0.15% | 640,730 SH | 2026年9月11日 | 日次 |
| EQAL · Invesco Exchange-Traded Fund Trust … | 0.14% | 18,869 | 2026年10月28日 | 日次 |
| BSCT · Invesco Exchange-Traded Self-Indexe… | 0.14% | 4,374,000 | 2026年10月28日 | 日次 |
| PFIG · Invesco Exchange-Traded Fund Trust … | 0.13% | 195,000 | 2026年10月26日 | 日次 |
| IWD · iShares Trust | 0.13% | 1,691,737 SH | 2026年9月11日 | 日次 |
| DSI · iShares Trust | 0.13% | 109,394 SH | 2026年9月11日 | 日次 |
| BSCS · Invesco Exchange-Traded Self-Indexe… | 0.11% | 4,062,000 | 2026年10月28日 | 日次 |
| PRF · Invesco Exchange-Traded Fund Trust | 0.11% | 171,298 | 2026年10月28日 | 日次 |
| TOPC · iShares Trust | 0.09% | 443 SH | 2026年9月11日 | 日次 |
| DIVB · iShares Trust | 0.08% | 26,534 SH | 2026年9月11日 | 日次 |
| VLUE · iShares Trust | 0.08% | 124,640 SH | 2026年9月11日 | 日次 |
| ILCV · iShares Trust | 0.08% | 16,911 SH | 2026年9月11日 | 日次 |
| XVV · iShares Trust | 0.08% | 8,404 SH | 2026年9月11日 | 日次 |
| USCL · iShares Trust | 0.08% | 33,766 SH | 2026年9月11日 | 日次 |
| IVV · iShares Trust | 0.07% | 9,188,154 SH | 2026年9月11日 | 日次 |
| ILCB · iShares Trust | 0.07% | 13,952 SH | 2026年9月11日 | 日次 |
| IWB · iShares Trust | 0.07% | 525,058 SH | 2026年9月11日 | 日次 |
| QVML · Invesco Exchange-Traded Fund Trust … | 0.07% | 19,212 | 2026年10月28日 | 日次 |
| IWV · iShares Trust | 0.07% | 213,841 SH | 2026年9月11日 | 日次 |
| PBP · Invesco Exchange-Traded Fund Trust | 0.07% | 4,315 | 2026年10月28日 | 日次 |
| PBUS · Invesco Exchange-Traded Fund Trust … | 0.07% | 115,308 | 2026年10月28日 | 日次 |
| IYY · iShares Trust | 0.07% | 30,956 SH | 2026年9月11日 | 日次 |
| ITOT · iShares Trust | 0.06% | 953,021 SH | 2026年9月11日 | 日次 |
| ILCG · iShares Trust | 0.06% | 28,911 SH | 2026年9月11日 | 日次 |
| TOK · iShares Trust | 0.06% | 2,101 SH | 2026年9月11日 | 日次 |
| PHDG · Invesco Actively Managed Exchange-T… | 0.06% | 567 | 2026年10月28日 | 日次 |
| CRBN · iShares Trust | 0.06% | 10,037 SH | 2026年9月11日 | 日次 |
| URTH · iShares, Inc. | 0.05% | 65,129 SH | 2026年9月11日 | 日次 |
| OMFL · Invesco Exchange-Traded Self-Indexe… | 0.05% | 38,095 | 2026年10月28日 | 日次 |
| ACWI · iShares Trust | 0.05% | 232,770 SH | 2026年9月11日 | 日次 |
| RWL · Invesco Exchange-Traded Fund Trust … | 0.01% | 24,358 | 2026年10月27日 | 日次 |
| GLOF · iShares Trust | 0.01% | 309 SH | 2026年9月10日 | 日次 |
| GTO · Invesco Actively Managed Exchange-T… | 0.00% | 7,000 | 2026年10月27日 | 日次 |
VMRK アナリストコンセンサス 強気・弱気のアナリストの見解、12ヶ月の目標株価、アップサイド
12ヶ月目標株価
20 アナリスト · 2026-10-29平均値ターゲット $71.62 +17.6%
同業他社比較(GICSサブインダストリー) 主要メトリクスとセクターピアの比較
FY基準、価格は各社の直近年度末終値。
| ティッカー | 時価総額 | P/E | 売上高 YoY | 純利益率 | ROE | 粗利益率 |
|---|---|---|---|---|---|---|
| VMRK | · | · | · | · | · | · |
| ESS | $16.86B | 25.2 | 6.4% | 37.2% | 12.7% | 69.9% |
| MAA | $16.24B | 36.7 | 0.83% | 20.2% | 7.7% | · |
| CPT | $11.48B | 31.1 | 81.7% | 2964.9% | 8.5% | · |
| UDR | $12.04B | 32.5 | 2.4% | 22.1% | 11.2% | · |
| IRT | $4.15B | 72.8 | 2.8% | 8.6% | 1.6% | · |
| CSR | $1.12B | 65.4 | 4.9% | 6.2% | 2.3% | · |
| NXRT | $763M | -23.9 | -3.2% | -12.8% | -9.1% | · |
マイ指標 あなた専用のウォッチリスト — 決算詳細から選択した行
重視する指標を選択してください — 上記の「財務諸表」の任意の行の横にある「+」をクリックしてください。
選択内容は保存され、すべてのティッカーで引き継がれます。