
WVVIP Willamette Valley Vineyards, Inc. - Series A Redeemable Preferred Stock
NASDAQ · Beverages · SEC EDGAR에서 보기 ↗ 종가 10월 2, 2026 10-K/10-Q 8월 12, 2026WVVIP 주식 스냅샷 가격, 시가총액, P/E, EPS, ROE, 부채/자본, 52주 범위
WVVIP 주가 차트 기술 지표가 포함된 일일 OHLCV — 팬, 확대/축소 및 보기 사용자 정의
막대 세분성은 선택한 기간에 따라 조정됩니다. 막대의 시가/고가/저가/종가를 보려면 차트에 마우스를 올리세요.
Willamette Valley Vineyards, Inc. - Series A Redeemable Preferred Stock 정보 위키백과 회사 개요
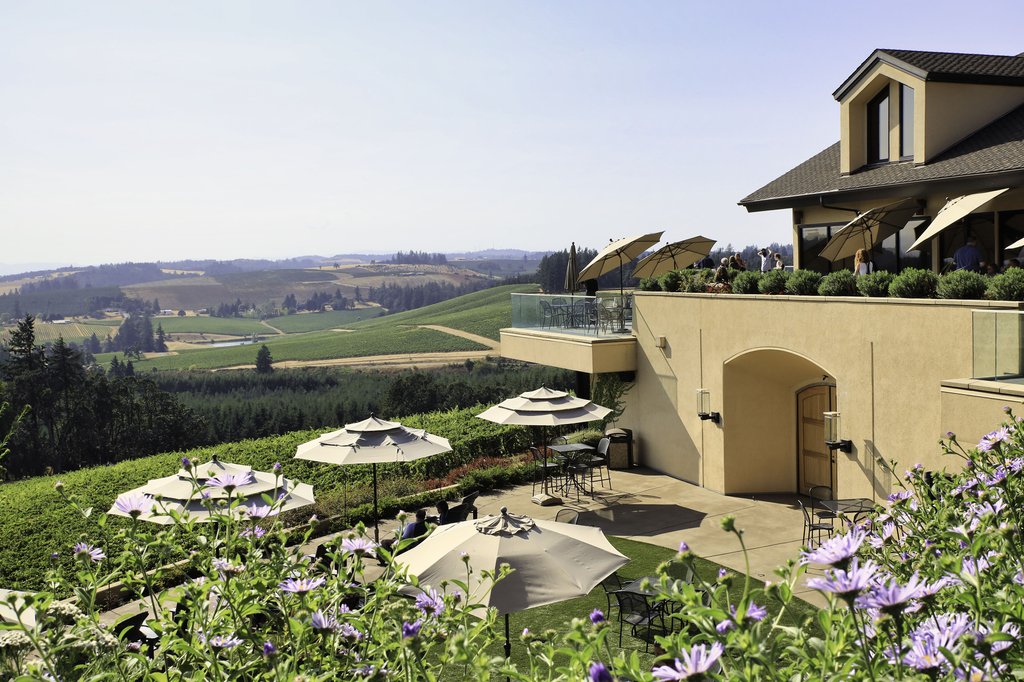
Willamette Valley Vineyards is an American winery located in Turner, Oregon. Named after Oregon's Willamette Valley, the winery is the leading producer of Willamette Valley-appellated Pinot Noir in Oregon, and also produces Chardonnay and Pinot Gris. In 2016, the winery was the largest producer of Riesling wine in the Willamette Valley.
History
Willamette Valley Vineyards was founded by Jim Bernau and Don Voorhies. In 1997, Willamette Valley Vineyards merged with Tualatin Estate Vineyards, which was established by Bill Fuller in 1973.
The winery was established via an early crowdfunding campaign. In 1989, around 1,200 shareholders invested an average of $1,700 each in an unlisted stock offering approved by Oregon regulators. By 1993, the number of shareholders had grown to 4,500 and many shareholders were directly involved with operations, collectively donating 6,000 to 7,000 hours of labor per month. Over 300 shareholders passed an OLCC class to be certified to pour wine in the tasting room. The winery is now listed on the NASDAQ under the symbol WVVI.
In 2021, the winery hosted the season 18 finale of Bravo's Top Chef: Portland.
Subsidiaries
In 2015, founder Jim Bernau and winery director Christine Clair founded the Oregon Estate Vineyards division to manage subsidiary vineyards.
Since 2007, Willamette Valley Vineyards has managed Elton Vineyards in the Eola-Amity Hills AVA. Elton Vineyards is primarily planted with Pinot Noir and Chardonnay. In 2017, Willamette Valley Vineyards began selling a boutique wine label under the "Elton" name.
In 2015, the company purchased new vineyard sites in the Walla Walla Valley AVA for a new subsidiary, "Pambrun Vineyard", named after Bernau's ancestor, Pierre Pambrun, a Walla Walla pioneer. Pambrun produces Cabernet Sauvignon along with other Bordeaux varieties. In 2018, Willamette Valley Vineyards acquired nearby Maison Bleue Winery, previously owned by Jon Meuret, who was also the consulting winemaker for Pambrun Vineyard.
Press coverage
In 2015, Wine Enthusiast named Willamette Valley Vineyards' Whole Cluster Pinot Noir as one of "America's Best Value Pinot Noirs".
The Wall Street Journal included Willamette Valley Vineyards' Pinot Gris in the article, "Why Wine Remains a Great Connector".
출처: 위키백과 (영어), CC BY-SA 4.0 · 위키백과에서 보기 ↗
10년 성과 매출, 순이익, 마진 및 EPS 추세
가치 평가 P/E, P/S, P/B, EV/EBITDA 비율 — 주식이 비싼가요, 싼가요?
| 지표 | 5년 추세 | WVVIP | 5년 평균 | 동종업계 중앙값 | 결론 |
|---|---|---|---|---|---|
| P/B (MRQ) | 0.2 | · | 0.2 | 고평가 |
동종 기업 중앙값은 지표별로 표준화된 기준으로 계산되며, 이 주식에 표시된 TTM/MRQ 기준과 항상 일치하지 않을 수 있습니다.
수익성 총, 영업 및 순이익률; ROE, ROA, ROIC
이 비율 그룹을 계산하기에 기본 데이터가 아직 충분하지 않습니다.
재무 건전성 부채, 유동성, 지급능력 — 대차대조표 건전성
| 지표 | 5년 추세 | WVVIP | 5년 평균 | 동종업계 중앙값 | 결론 |
|---|---|---|---|---|---|
| 부채 / 자기자본 비율 (MRQ) | 0.2 | · | 0.2 | 높은 부채 | |
| 유동비율 (MRQ) | 2.9 | · | 1.9 | 강한 유동성 | |
| 장기 부채 / 자기 자본 (MRQ) | 0.2 | · | · | · |
성장 매출, EPS 및 순이익 성장률: YoY, 3년 CAGR, 5년 CAGR
이 비율 그룹을 계산하기에 기본 데이터가 아직 충분하지 않습니다.
자본 효율성 자산 회전율, 재고 회전율, 매출채권 회전율
이 비율 그룹을 계산하기에 기본 데이터가 아직 충분하지 않습니다.
가치 · ≈ 5년 평균 · 산업 중앙값 · 중앙값 대비 평가
배당금 배당 수익률, 지급 비율, 배당 이력, 5년 CAGR
| 배당락일 | 금액 | 통화 | 수익률 |
|---|---|---|---|
| 12월 5, 2025 | $0.22 | USD | ≈6.8% |
| 12월 6, 2024 | $0.22 | USD | ≈6.0% |
| 12월 6, 2023 | $0.22 | USD | ≈4.9% |
| 12월 6, 2022 | $0.22 | USD | ≈4.5% |
| 12월 6, 2021 | $0.22 | USD | ≈3.2% |
| 12월 4, 2020 | $0.22 | USD | ≈3.9% |
| 12월 5, 2019 | $0.22 | USD | ≈4.6% |
| 12월 6, 2018 | $0.22 | USD | ≈4.5% |
| 12월 7, 2017 | $0.22 | USD | ≈4.3% |
실적 기록 EPS 실제 vs 예상, 서프라이즈 %, 달성률, 다음 실적 발표일
| 기간 | 보고서 | EPS Actual | EPS 예상 | 서프라이즈 |
|---|---|---|---|---|
| 2024년 3월 31일 | $-0.22 | — | — | |
| 2023년 9월 30일 | $-0.17 | — | — |
전체 기본 지표 연도별 모든 지표 — 손익계산서, 대차대조표, 현금흐름
이 티커에 대한 SEC 제출 서류가 아직 없습니다.
손익계산서
| 지표 | 추세 | Q2 2026 | Q2 2025 |
|---|---|---|---|
| Revenue | $10M | $10M | |
| Cost of Revenue | $4M | $4M | |
| Gross Profit | $6M | $6M | |
| SG&A Expense | $3M | $2M | |
| Operating Expenses | $7M | $6M | |
| Operating Income | $-1M | $398.2K | |
| Interest Expense | $268.0K | $270.1K | |
| Pretax Income | $-2M | $130.6K | |
| Income Tax | $-229.5K | $37.8K | |
| Net Income | $-1M | $92.8K | |
| EPS (Basic) | $-0.40 | $-0.09 | |
| EPS (Diluted) | $-0.40 | $-0.09 | |
| Shares (Basic) | 4,979,529 | 4,964,529 | |
| Shares (Diluted) | 4,979,529 | 4,964,529 | |
| EBITDA | $-1M | · |
대차대조표
| 지표 | 추세 | Q2 2026 | Q2 2025 |
|---|---|---|---|
| Cash & Equivalents | $589.5K | · | |
| Receivables | $3M | · | |
| Inventory | $32M | · | |
| Prepaid Expense | $600.3K | · | |
| Current Assets | $36M | · | |
| PP&E (Net) | $48M | · | |
| PP&E (Gross) | $81M | · | |
| Accum. Depreciation | $33M | · | |
| Other Non-current Assets | $13.8K | · | |
| Total Assets | $103M | · | |
| Accounts Payable | $2M | · | |
| Accrued Liabilities | $2M | · | |
| Short-term Debt | $825.2K | · | |
| Current Liabilities | $12M | · | |
| Capital Leases | $11M | · | |
| Deferred Tax | $2M | · | |
| Total Liabilities | $37M | · | |
| Long-term Debt | $15M | · | |
| Total Debt | $15M | · | |
| Common Stock | $9M | · | |
| Retained Earnings | $11M | · | |
| Stockholders' Equity | $66M | · | |
| Liabilities + Equity | $103M | · | |
| Shares Outstanding | 4,979,529 | · |
현금 흐름
| 지표 | 추세 | Q2 2026 | Q2 2025 |
|---|---|---|---|
| D&A | $800.2K | · | |
| Stock-based Comp | $21.0K | · | |
| Operating Cash Flow | $2M | · | |
| CapEx | $28.5K | · | |
| Investing Cash Flow | $-53.5K | · | |
| Financing Cash Flow | $-2M | · | |
| Net Change in Cash | $184.8K | · |
수익성
| 지표 | 추세 | Q2 2026 | Q2 2025 |
|---|---|---|---|
| Gross Margin | 57.5% | · | |
| Operating Margin | -13.5% | · | |
| Net Margin | -13.9% | · | |
| Pretax Margin | -16.1% | · | |
| EBITDA Margin | -13.5% | · | |
| ROA | -1.3% | · | |
| ROE | -2.1% | · | |
| ROIC | -1.4% | · |
유동성 및 지급능력
| 지표 | 추세 | Q2 2026 | Q2 2025 |
|---|---|---|---|
| Current Ratio | 2.9 | · | |
| Quick Ratio | 0.3 | · | |
| Debt / Equity | 0.2 | · | |
| LT Debt / Equity | 0.2 | · | |
| Interest Coverage | -5.1 | · |
효율성
| 지표 | 추세 | Q2 2026 | Q2 2025 |
|---|---|---|---|
| Asset Turnover | 0.1 | · | |
| Inventory Turnover | 0.1 | · | |
| Receivables Turnover | 4.0 | · |
주당
| 지표 | 추세 | Q2 2026 | Q2 2025 |
|---|---|---|---|
| Book Value / Share | $13.34 | · | |
| Revenue / Share | $2.02 | · | |
| Cash / Share | $0.12 | · |
가치 평가 (TTM)
| 지표 | 추세 | Q2 2026 | Q2 2025 |
|---|---|---|---|
| Revenue TTM | $38M | $38M | |
| Net Income TTM | $-2M | $-428.3K | |
| Market Cap | $13M | · | |
| Enterprise Value | $28M | · | |
| P/S | 0.3 | 0.4 | |
| P/B | 0.2 | · | |
| P / Tangible Book | 0.2 | · | |
| EV / Revenue | 0.7 | 0.8 |
최신 기간은 왼쪽에 · null 값은 ·로 표시
재무제표 손익계산서, 대차대조표, 현금흐름 — 연간, 지난 5년
이 재무제표를 작성하기에 기본 정보 데이터가 충분하지 않습니다.
이 재무제표를 작성하기에 기본 정보 데이터가 충분하지 않습니다.
이 재무제표를 작성하기에 기본 정보 데이터가 충분하지 않습니다.
회사 내부자 3 명의 내부자 · 1 임원 · 3 이사
| 내부자 | 역할 | 마지막 활동 | 보유 주식 수 | 매수 12개월 | 매도 12개월 | 순매수/매도 12개월 |
|---|---|---|---|---|---|---|
| James W Bernau | President | 2026년 10월 1일 P | 380,001 | 18 | 0 | $9,491 |
| Chris Riccardi | 이사 | 2026년 10월 1일 P | 491,661 | 15 | 0 | $11,486 |
| Sean M Cary | 이사 | 2026년 5월 12일 A | · | 0 | 0 | $0 |
SEC 양식 3/4/5 제출 서류 기준 내부자; 순매수/매도는 공개 시장 거래만 해당
동종 기업 비교(GICS 하위 산업) 주요 지표 대 섹터 동종 기업
회계연도 기준, 각 회사의 마지막 회계연도 말 종가 기준 가격입니다.
나의 지표 나만의 관심 목록 — 전체 기본 재무제표에서 선택한 항목
중요한 지표를 선택하세요. 상단의 전체 기본 정보에서 원하는 행 옆의 +를 클릭하세요.
선택 항목이 저장되어 모든 티커에서 유지됩니다.