
GGAL Klasa B Grupo Financiero Galicia S.A. - American Depositary Shares, Class B Shares underlying
NASDAQ · Banking · Wyświetl na SEC EDGAR ↗ zamknij Paź 2, 2026 10-K/10-Q Kwi 16, 2026GGAL Migawka akcji Cena, kapitalizacja rynkowa, P/E, EPS, ROE, zadłużenie/kapitał własny, zakres 52-tygodniowy
GGAL Wykres ceny akcji Dzienny OHLCV ze wskaźnikami technicznymi — przesuwaj, powiększaj i dostosowuj widok
Granularność słupków dostosowuje się do wybranego okresu — najedź kursorem na wykres, aby zobaczyć otwarcia/maksima/minima/zamknięcia dla danego słupka.
O Grupo Financiero Galicia S.A. - American Depositary Shares, Class B Shares underlying Przegląd firmy z Wikipedii
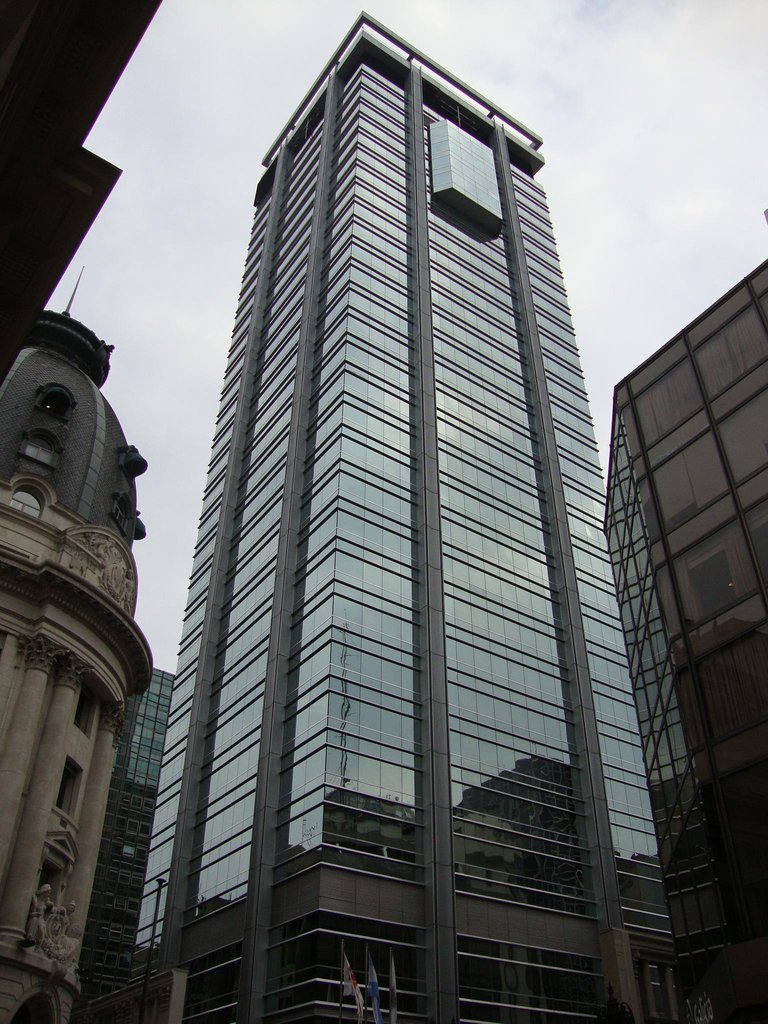
Grupo Financiero Galicia S.A. is a financial services holding company based in Buenos Aires, and its banking operations are the fifth largest in Argentina, as well as the largest among all domestically owned private banks in the country.
Overview
The bank was founded in 1905 as the Banco de Galicia y Buenos Aires by a consortium led by Manuel Escasany, a jeweler and clockmaker of Galician origin. It was registered under the laws of the Argentine Republic. Its executive offices are located in Buenos Aires. The name referred to the Galician heritage of the Escasanys, the largest original shareholders, as well as to the Spanish Argentine immigrant community from that region (who were second only to Italian Argentines in number).
The bank maintained over 2,500 accounts by the end of its first year, and in 1907, it was listed on the Buenos Aires Stock Exchange and garnered nearly 3,300 initial shareholders. The Buenos Aires branches were followed by one in neighboring Montevideo, Uruguay, in 1910, and in 1921, it began offering time deposits (which remain the most common form of savings among the Argentine public).
Following the founder's death in 1948, his son, Eduardo Escasany, became its president and by 1960, he had secured a partnership with the Ayerzas and the Brauns, two influential local families prominent in the Argentine ranching and retail sectors, respectively. The Banco de Galicia became the largest, domestically owned private bank in Argentina in 1965 and by 1975, ranked second to the public National Mortgage Bank in new home loans, and employed around 3,900 staff in 93 branches, nationwide. Banco de Galicia in 1993 became the first Latin American bank to enter both the U.S. and European stock markets, and the first to raise funds on the U.S. domestic capital market by floating a $200 million, ten-year Yankee bond. The following year it was the first to issue convertible bonds on the international securities market, enabling the bank to remain in Argentine hands at a time when many of its rivals were sold to Spanish banks. A branch was opened in New York in 1994, and the group acquired a one-eighth share in the newly privatized postal service. Banco Galicia established an insurance company, Sudamericana Holding S.A., in 1996 as a joint venture with The Hartford.
The company's decision in 2000 to demolish its historic downtown Buenos Aires headquarters in favor of a modern, 34-story building was controversial. A family feud among the Escasany siblings led to the establishment in 2000 of the Banco de Galicia Foundation, which owns over 94% of the outstanding shares of Banco Galicia. Though a sell-off of public shares was averted, given the controversy, the 1998–2002 Argentine great depression led to the loss of nearly half of the bank's deposits between 2001 and 2002, and to its near-insolvency, when its dollar-denominated debt of US$1.8 billion required borrowing on flexible terms from the Central Bank of Argentina; Escasany, who had also been chairman of the Argentine Banking Association, resigned as CEO in 2002. The bank recovered during 2003, however, when its losses of US$436 million were trimmed to US$73 million, and it has remained profitable in the ensuing years.
The bank remains the largest private sector commercial bank in Argentina ranked by deposits, assets or loans. As of April 2009, the group maintained 236 branches and total deposits in Argentina amounted to nearly US$4.5 billion, a 6% market share, and 7.6% among private sector depositors. Consolidated assets totaled US$7.7 billion and loans to the private sector, US$3.7 billion (6.5% of the market).
Besides its holdings in Banco Galicia, GFG participates in other business sectors through four companies: Grupo Sudamericana, an insurance holding company specialized in life, retirement, and hemeowner's policies; Galicia Warrants S.A., a warehouse rental services and issuer of certificate of deposits company; Net Investment, a holding company oriented to invest in Internet projects that can have synergies with Banco Galicia; and Galval Agente de Valores S.A., a wholly owned subsidiary of GFG, based in Uruguay and created with the purpose of providing custody services.
Grupo Galicia Class B shares trade on the Córdoba Stock Exchange while Grupo Galicia ADSs trade on the Nasdaq Capital Market, both under the ticker symbol "GGAL." Grupo Galicia comprises the Buenos Aires Stock Exchange's blue-chip MERVAL Index and are included in the Morgan Stanley Capital International and Standard & Poor's indices, as well.
In 2020, Grupo Financiero Galicia introduced its first digital wallet that integrates the most important banks in Argentina in a single app.
Shareholders and investors
The capital structure of the Group consists of 1,474,692,091 shares, divided into Class A and Class B shares. The 281,221,650 Class A shares carry five votes each, while the remaining Class B shares grant one vote per share. Traded under the symbol GGAL, the Class B shares are listed on BYMA, MAE, and the Córdoba Stock Exchange, with one ADS equivalent to ten Class B shares.
The controlling stake is held by EBA Holding, which owns 19.7% of the shares but commands 55.1% of the voting power due to its multiple-voting Class A shares. EBA Holding is entirely owned by the Escasany, Ayerza, and Braun families—the Escasanys being the founders of Galicia Bank in 1905, while the Ayerza and Braun families joined in the mid-20th century.
Źródło: Wikipedia (Angielski), CC BY-SA 4.0 · Zobacz w Wikipedii ↗
Wyniki 10-letnie Trendy przychodów, zysku netto, marż i EPS
Wycena Wskaźniki P/E, P/S, P/B, EV/EBITDA — czy akcje są drogie, czy tanie?
| Wskaźnik | Trend 5-letni | GGAL | średnia z 5 lat | Mediana porównawcza | Werdykt |
|---|---|---|---|---|---|
| P/E | 0.4średnia z 5 lat ≈0.1 | ≈0.1 | · | · |
Mediana porównawcza jest obliczana na znormalizowanej podstawie dla każdej metryki i może nie zawsze odpowiadać podstawie TTM/MRQ pokazanej dla tej akcji.
Rentowność Marże brutto, operacyjne i netto; ROE, ROA, ROIC
| Wskaźnik | Trend 5-letni | GGAL | średnia z 5 lat | Mediana porównawcza | Werdykt |
|---|---|---|---|---|---|
| ROA | 0.48%średnia z 5 lat ≈2.6% | ≈2.6% | · | · | |
| ROE | 2.7%średnia z 5 lat ≈14.0% | ≈14.0% | · | · | |
| ROIC | 2.7%średnia z 5 lat ≈11.1% | ≈11.1% | · | · |
Zdrowie finansowe Dług, płynność, wypłacalność — siła bilansu
| Wskaźnik | Trend 5-letni | GGAL | średnia z 5 lat | Mediana porównawcza | Werdykt |
|---|---|---|---|---|---|
| Interest Coverage (Pokrycie odsetek) | 0.1średnia z 5 lat ≈0.2 | ≈0.2 | · | · |
Rozwój Wzrost przychodów, EPS i zysku netto: r/r, CAGR 3-letni, CAGR 5-letni
Za mało danych fundamentalnych, aby obliczyć tę grupę wskaźników.
Efektywność kapitałowa Rotacja aktywów, rotacja zapasów, rotacja należności
Za mało danych fundamentalnych, aby obliczyć tę grupę wskaźników.
wartość · ≈ średnia z 5 lat · mediana branżowa · werdykt względem mediany
Dywidendy Stopa dywidendy, wskaźnik wypłaty, historia dywidend, 5-letni CAGR
| Data ex-dywidendy | Kwota | Waluta | Stopa zwrotu |
|---|---|---|---|
| Wrz 28, 2026 | $0,05 | USD | ≈5.3% |
| Sie 24, 2026 | $0,05 | USD | ≈4.7% |
| Sie 3, 2026 | $0,05 | USD | ≈4.0% |
| Maj 11, 2026 | $0,62 | USD | ≈5.5% |
| Maj 4, 2026 | $0,16 | USD | ≈4.3% |
| Mar 30, 2026 | $0,16 | USD | ≈3.7% |
| Mar 2, 2026 | $0,15 | USD | ≈3.2% |
| Lut 2, 2026 | $0,15 | USD | ≈2.3% |
| Gru 29, 2025 | $0,14 | USD | ≈2.1% |
| Gru 1, 2025 | $0,14 | USD | ≈1.9% |
| Lis 3, 2025 | $0,14 | USD | ≈1.4% |
| Wrz 30, 2025 | $0,14 | USD | ≈2.6% |
| Sie 29, 2025 | $0,15 | USD | ≈1.5% |
| Lip 29, 2025 | $0,15 | USD | ≈2.2% |
| Cze 3, 2025 | $0,27 | USD | ≈4.7% |
| Sie 19, 2024 | $0,73 | USD | ≈7.6% |
| Lip 26, 2024 | $0,66 | USD | ≈7.3% |
| Cze 21, 2024 | $0,70 | USD | ≈4.9% |
| Cze 10, 2024 | $0,29 | USD | ≈2.7% |
| Wrz 22, 2023 | $0,12 | USD | ≈8.3% |
Historia zysków EPS faktyczny vs szacowany, zaskoczenie %, wskaźnik trafień, data następnych wyników
| Okres | Raport | EPS Actual | EPS Szacowany | Niespodzianka |
|---|---|---|---|---|
| 30 czerwca 2026 | $1723.39 | $133.36 | 1192.2% | |
| 31 marca 2026 | $41.40 | $43.35 | -4.5% | |
| 31 grudnia 2025 | $-39.33 | $-24.17 | -62.7% | |
| 30 września 2025 | $-54.70 | $8.60 | -736.3% | |
| 30 czerwca 2025 | $113.00 | $118.02 | -4.3% | |
| 31 marca 2025 | $-39.33 | $-24.17 | -62.7% | |
| 31 grudnia 2024 | $435.90 | $141.04 | 209.1% |
Pełne podstawowe wskaźniki Wszystkie wskaźniki roczne — rachunek zysków i strat, bilans, przepływy pieniężne
Rachunek zysków i strat
| Wskaźnik | Trend | 2025 | 2024 | 2023 | 2022 | 2021 | 2020 | 2019 | 2018 | 2017 |
|---|---|---|---|---|---|---|---|---|---|---|
| Operating Income | $299.09B | $1.96T | $1.55T | $447.45B | $288.93B | $136.49B | $82.51B | $7.07B | $22.46B | |
| Interest Expense | $3.88T | $4.07T | $8.67T | $3.83T | $1.10T | $266.58B | $196.61B | $94.05B | $38.18B | |
| Interest Income | $9.47T | $10.85T | $13.62T | $4.86T | $1.76T | $492.14B | $268.18B | $163.93B | $84.14B | |
| Pretax Income | $303.85B | $2.89T | $1.56T | $444.45B | $288.14B | $136.13B | $82.51B | $7.07B | $22.95B | |
| Income Tax | $91.24B | $771.68B | $589.66B | $115.07B | $99.52B | $61.11B | $33.57B | $14.48B | $11.26B | |
| Net Income | $212.52B | $2.12T | $965.88B | $329.38B | $188.62B | $74.01B | $48.72B | $-7.26B | $10.45B | |
| EPS (Basic) | $132.48 | $1426.39 | $654.97 | $223.36 | $127.90 | $51.30 | $34.15 | $-5.09 | $7.84 | |
| EPS (Diluted) | $132.48 | $1426.39 | $654.97 | $223.36 | $127.90 | $51.30 | $34.15 | $-5.09 | $7.84 | |
| Shares (Basic) | 1,604,164,000 | 1,483,089,000 | 1,474,692,000 | 1,474,692,000 | 1,474,692,000 | 1,442,740,000 | 1,426,765,000 | 1,426,765,000 | 1,332,617,000 | |
| Shares (Diluted) | 1,604,164,000 | 1,483,089,000 | 1,474,692,000 | 1,474,692,000 | 1,474,692,000 | 1,442,740,000 | 1,426,765,000 | 1,426,765,000 | 1,332,617,000 | |
| EBITDA | $299.09B | $1.49T | $540.08B | $66.08B | $47.63B | $43.50B | $36.86B | $3.37B | · |
Bilans
| Wskaźnik | Trend | 2025 | 2024 | 2023 | 2022 | 2021 | 2020 | 2019 | 2018 | 2017 |
|---|---|---|---|---|---|---|---|---|---|---|
| Cash & Equivalents | $9.37T | $8.87T | $4.35T | $1.39T | $462.49B | $264.79B | $177.87B | $220.46B | $87.04B | |
| PP&E (Net) | $1.20T | $1.31T | $773.63B | $360.68B | $121.15B | $66.01B | $44.88B | $29.79B | $18.21B | |
| Intangibles | $381.32B | $400.55B | $269.19B | $119.93B | $41.36B | $21.84B | $11.83B | $7.06B | $1.72B | |
| Total Assets | $45.67T | $42.76T | $22.25T | $10.49T | $3.27T | $1.59T | $933.27B | $876.37B | $489.64B | |
| Total Liabilities | $37.91T | $34.81T | $17.85T | $8.59T | $2.68T | $1.32T | $774.21B | $781.23B | $422.16B | |
| Retained Earnings | $-1.60T | $-1.58T | $-1.20T | $-544.27B | $-173.44B | $-154.35B | $-77.96B | $-22.99B | $-9.60B | |
| Stockholders' Equity | $7.76T | $7.95T | $4.39T | $1.90T | $593.09B | $275.22B | $155.12B | $92.49B | $64.52B |
Przepływy pieniężne
| Wskaźnik | Trend | 2025 | 2024 | 2023 | 2022 | 2021 | 2020 | 2019 | 2018 | 2017 |
|---|---|---|---|---|---|---|---|---|---|---|
| Operating Cash Flow | $-1.61T | $4.61T | $4.78T | $3.91T | $1.72T | $540.28B | $-39.46B | $188.24B | $-13.81B | |
| Investing Cash Flow | $-222.93B | $1.14T | $-234.50B | $-126.81B | $-51.06B | $-19.94B | $-10.84B | $-7.51B | $-5.95B | |
| Dividends Paid | $329.13B | $808.95B | $513.56B | $144.19B | $11.68B | $5.99B | $5.47B | $3.59B | $859M | |
| Financing Cash Flow | $873.80B | $543.99B | $-658.19B | $182.83B | $51.13B | $-103.22B | $-37.88B | $16.41B | $20.60B |
Rentowność
| Wskaźnik | Trend | 2025 | 2024 | 2023 | 2022 | 2021 | 2020 | 2019 | 2018 | 2017 |
|---|---|---|---|---|---|---|---|---|---|---|
| ROA | 0.48% | 5.9% | 3.3% | 1.5% | 1.9% | 2.5% | 3.0% | -0.65% | · | |
| ROE | 2.7% | 31.1% | 17.2% | 8.1% | 10.7% | 14.9% | 23.0% | -5.6% | · | |
| ROIC | 2.7% | 18.1% | 16.6% | 8.0% | 10.2% | 14.0% | 20.9% | -5.9% | · |
Płynność i wypłacalność
| Wskaźnik | Trend | 2025 | 2024 | 2023 | 2022 | 2021 | 2020 | 2019 | 2018 | 2017 |
|---|---|---|---|---|---|---|---|---|---|---|
| Interest Coverage | 0.1 | 0.5 | 0.2 | 0.1 | 0.3 | 0.5 | 0.4 | 0.1 | · |
Na akcję
| Wskaźnik | Trend | 2025 | 2024 | 2023 | 2022 | 2021 | 2020 | 2019 | 2018 | 2017 |
|---|---|---|---|---|---|---|---|---|---|---|
| Cash Flow / Share | $-1000.78 | $2361.82 | $1130.61 | $393.45 | $191.78 | $127.36 | $-7.41 | $60462.55 | · | |
| EPS (TTM) | $132.48 | $1426.39 | $654.97 | $223.36 | $127.90 | $51.30 | $34.15 | $-5.09 | · |
Wycena (TTM)
| Wskaźnik | Trend | 2025 | 2024 | 2023 | 2022 | 2021 | 2020 | 2019 | 2018 | 2017 |
|---|---|---|---|---|---|---|---|---|---|---|
| Net Income TTM | $212.52B | $2.12T | $965.88B | $329.38B | $188.62B | $74.01B | $48.72B | $-7.26B | · | |
| P/E | 0.4 | 0.0 | 0.0 | 0.0 | 0.1 | 0.2 | 0.5 | -5.4 | · | |
| Earnings Yield | 245.6% | 2288.8% | 3792.5% | 2295.6% | 1347.7% | 587.0% | 210.4% | -18.5% | · | |
| Payout Ratio | 154.9% | 37.9% | 53.2% | 51.8% | 6.2% | 8.1% | 11.2% | -46.7% | · | |
| Annual Payout | $329.13B | $808.95B | $513.56B | $144.19B | $11.68B | $5.99B | $5.47B | $3.59B | · |
Na akcję
| Wskaźnik | Trend | Q4 2018 | Q4 2017 | Q4 2016 | Q4 2015 | Q4 2014 | Q4 2013 | Q4 2012 | Q4 2011 | Q4 2010 | Q4 2009 | Q4 2008 | Q4 2007 | Q4 2006 | Q4 2005 | Q4 2004 |
|---|---|---|---|---|---|---|---|---|---|---|---|---|---|---|---|---|
| EPS (TTM) | $-5.09 | $7.84 | · | · | · | · | · | · | · | · | · | · | · | · | · |
Wycena (TTM)
| Wskaźnik | Trend | Q4 2018 | Q4 2017 | Q4 2016 | Q4 2015 | Q4 2014 | Q4 2013 | Q4 2012 | Q4 2011 | Q4 2010 | Q4 2009 | Q4 2008 | Q4 2007 | Q4 2006 | Q4 2005 | Q4 2004 |
|---|---|---|---|---|---|---|---|---|---|---|---|---|---|---|---|---|
| Net Income TTM | $-7.26B | $10.45B | · | · | · | · | · | · | · | · | · | · | · | · | · | |
| P/E | -5.4 | 8.4 | · | · | · | · | · | · | · | · | · | · | · | · | · | |
| Earnings Yield | -18.5% | 11.9% | · | · | · | · | · | · | · | · | · | · | · | · | · | |
| Annual Payout | $3.59B | $859M | · | · | · | · | · | · | · | · | · | · | · | · | · |
Najnowszy okres po lewej · wartości null pokazane jako ·
Sprawozdania finansowe Rachunek zysków i strat, bilans, przepływy pieniężne — roczne, ostatnie 5 lat
| Wskaźnik | 2025-12-31 | 2024-12-31 | 2023-12-31 | 2022-12-31 | 2021-12-31 |
|---|---|---|---|---|---|
| Zysk netto | $212.52B | $2.12T | $965.88B | $329.38B | $188.62B |
| Rozwodniony EPS | $132.48 | $1426.39 | $654.97 | $223.36 | $127.90 |
Zbyt mało danych fundamentalnych, aby utworzyć to sprawozdanie.
Zbyt mało danych fundamentalnych, aby utworzyć to sprawozdanie.
Właściciele instytucjonalni (13F) 163 emitenci · $1.7B łącznie · Na dzień 30 czerwca 2026
Instytucje, które zgłaszają posiadanie tych akcji w swoich kwartalnych zgłoszeniach SEC Form 13F. Tylko pozycje długie; pojedynczy zgłaszający może pojawić się dwukrotnie dla oddzielnych transz opcji. Duże przeciwstawne pozycje put/call zazwyczaj odzwierciedlają działalność market-makingową lub zabezpieczone zapasy, a nie przekonanie kierunkowe.
| Nowe pozycje | Zamknięte pozycje | Zwiększone | Zmniejszony | Zmiana liczby akcji netto |
|---|---|---|---|---|
| 37 (-1 vs poprzedni kw.) | 27 (+6 vs poprzedni kw.) | 48 (-2 vs poprzedni kw.) | 50 (+5 vs poprzedni kw.) | +1.9M |
Porównano z Q1 2026. Zgłoszenia SEC Form 13F są wymagane w ciągu 45 dni od końca kwartału plus krótki bufor dla spóźnionych zgłoszeń — kwartały mieszczące się jeszcze w tym terminie są pomijane na rzecz ostatniej w pełni zgłoszonej pary.
| Instytucja | Wartość | Akcje | % z śledzonych 13F | Typ |
|---|---|---|---|---|
| Westwood Global Investments, LLC | $277 171 603 | 5 540 108 | 16,08% | Akcje |
| Aquamarine Financial (Cayman) Ltd | $175 883 667 | 3 515 564 | 10,20% | Akcje |
| MAK CAPITAL ONE LLC | $74 338 326 | 1 485 875 | 4,31% | Akcje |
| PointState Capital LP | $69 991 970 | 1 399 000 | 4,06% | Akcje |
| Carrhae Capital LLP | $68 051 807 | 1 360 220 | 3,95% | Akcje |
| MIRAE ASSET GLOBAL ETFS HOLDINGS Ltd. | $55 930 788 | 1 117 945 | 3,24% | Akcje |
| INCA Investments LLC | $53 306 515 | 1 065 491 | 3,09% | Akcje |
| DISCOVERY CAPITAL MANAGEMENT, LLC / CT | $45 923 988 | 917 929 | 2,66% | Akcje |
| MORGAN STANLEY | $44 058 366 | 880 638 | 2,56% | Akcje |
| CITADEL ADVISORS LLC | $43 305 968 | 865 600 | 2,51% | Opcja kupna |
| Driehaus Capital Management LLC | $43 031 353 | 860 111 | 2,50% | Akcje |
| RWC Asset Management LLP | $42 697 853 | 853 445 | 2,48% | Akcje |
| SUSQUEHANNA INTERNATIONAL GROUP, LLP | $42 410 431 | 847 700 | 2,46% | Opcja kupna |
| PING CAPITAL MANAGEMENT, INC. | $41 644 972 | 832 400 | 2,42% | Akcje |
| CITADEL ADVISORS LLC | $37 422 440 | 748 000 | 2,17% | Opcja sprzedaży |
| SUSQUEHANNA INTERNATIONAL GROUP, LLP | $36 767 047 | 734 900 | 2,13% | Opcja sprzedaży |
| MILLENNIUM MANAGEMENT LLC | $33 840 292 | 676 400 | 1,96% | Akcje |
| Sagil Capital LLP | $32 951 059 | 658 626 | 1,91% | Akcje |
| Kora Management LP | $32 886 370 | 657 333 | 1,91% | Akcje |
| Route One Investment Company, L.P. | $28 984 881 | 579 350 | 1,68% | Akcje |
| RWC ASSET ADVISORS (US) LLC | $25 892 526 | 517 540 | 1,50% | Akcje |
| CITADEL ADVISORS LLC | $24 909 387 | 497 889 | 1,44% | Akcje |
| NOMURA ASSET MANAGEMENT INTERNATIONAL INC. | $23 660 000 | 472 923 | 1,37% | Akcje |
| Long Focus Capital Management, LLC | $22 813 680 | 456 000 | 1,32% | Akcje |
| JANE STREET GROUP, LLC | $22 513 500 | 450 000 | 1,31% | Opcja sprzedaży |
| TT International Asset Management LTD | $21 529 060 | 430 323 | 1,25% | Akcje |
| CITIGROUP INC | $18 692 409 | 373 624 | 1,08% | Akcje |
| JPMORGAN CHASE & CO | $16 844 897 | 330 941 | 0,98% | Akcje |
| JANE STREET GROUP, LLC | $16 795 071 | 335 700 | 0,97% | Opcja kupna |
| Fourth Sail Capital LP | $15 971 927 | 319 247 | 0,93% | Akcje |
| Moerus Capital Management LLC | $12 331 745 | 246 487 | 0,72% | Akcje |
| UBS Group AG | $12 303 128 | 245 915 | 0,71% | Akcje |
| Caption Management, LLC | $12 257 350 | 245 000 | 0,71% | Opcja kupna |
| Itau Unibanco Holding S.A. | $11 843 033 | 236 736 | 0,69% | Akcje |
| Fiera Capital Corp | $9 701 868 | 193 921 | 0,56% | Akcje |
| USS Investment Management Ltd | $9 487 625 | 189 544 | 0,55% | Akcje |
| Fundamenta Capital S.A. | $9 118 468 | 182 260 | 0,53% | Akcje |
| Amundi | $8 612 414 | 172 145 | 0,50% | Akcje |
| Walleye Trading LLC | $8 470 079 | 169 300 | 0,49% | Opcja kupna |
| LAZARD ASSET MANAGEMENT LLC | $8 265 373 | 165 208 | 0,48% | Akcje |
| HSBC HOLDINGS PLC | $7 537 388 | 147 966 | 0,44% | Akcje |
| Walleye Trading LLC | $7 319 389 | 146 300 | 0,42% | Opcja sprzedaży |
| Aquatic Capital Management LLC | $6 671 651 | 133 353 | 0,39% | Akcje |
| Russell Investments Group, Ltd. | $6 633 196 | 132 584 | 0,38% | Akcje |
| GOLDMAN SACHS GROUP INC | $4 940 065 | 98 742 | 0,29% | Akcje |
| TUDOR INVESTMENT CORP ET AL | $4 857 913 | 97 100 | 0,28% | Opcja sprzedaży |
| Brevan Howard Capital Management LP | $4 578 870 | 88 712 | 0,27% | Akcje |
| SPX Gestao de Recursos Ltda | $4 252 550 | 85 000 | 0,25% | Akcje |
| BNP PARIBAS FINANCIAL MARKETS | $4 187 061 | 83 691 | 0,24% | Akcje |
| MILLENNIUM MANAGEMENT LLC | $3 752 250 | 75 000 | 0,22% | Opcja sprzedaży |
Insiderzy spółki 1 insider · 0 dyrektorzy generalni · 1 dyrektorzy
| Insider | Rola | Ostatnia aktywność | Posiadane akcje | Kupna 12m | Sprzedaże 12m | Netto 12m |
|---|---|---|---|---|---|---|
| Silvestre Vila Moret | Dyrektor | 8 lipca 2026 P | 3 000 000 | 7 | 0 | $4 253 109 |
Insiderzy z zgłoszeń SEC Form 3/4/5; netto = tylko otwarty rynek P/S
Posiadanie ETF-ów Posiadane przez 1 fundusz ETF
Waga odzwierciedla wyłącznie bezpośrednie udziały kapitałowe (N-PORT); fundusze oparte na dźwigni lub instrumentach pochodnych mogą posiadać dodatkowe ekspozycje na swapy, które nie są pokazane.
| Fundusz | Waga | Jednostki | Na dzień | Źródło |
|---|---|---|---|---|
| ARGT · Global X Funds | 6,34% | 1 079 097 NS | 31 lipca 2026 | N-PORT |
GGAL Konsensus analityków Bycze i niedźwiedzie opinie analityków, 12-miesięczny cel cenowy, potencjał wzrostu
12-miesięczny cel cenowy
10 analityków · 2026-09-30Średnia cel $66.57 +85,5%
Moje wskaźniki Twoja osobista lista obserwowanych — wybrane wiersze z Pełnych Fundamentów
Wybierz wskaźniki, które są dla Ciebie ważne — kliknij + obok dowolnego wiersza w sekcji Pełne dane fundamentalne powyżej.
Twój wybór został zapisany i będzie Ci towarzyszył we wszystkich tickerach.