
WVVIP Willamette Valley Vineyards, Inc. - Series A Redeemable Preferred Stock
NASDAQ · Beverages · Wyświetl na SEC EDGAR ↗ zamknij Paź 2, 2026 10-K/10-Q Sie 12, 2026WVVIP Migawka akcji Cena, kapitalizacja rynkowa, P/E, EPS, ROE, zadłużenie/kapitał własny, zakres 52-tygodniowy
WVVIP Wykres ceny akcji Dzienny OHLCV ze wskaźnikami technicznymi — przesuwaj, powiększaj i dostosowuj widok
Granularność słupków dostosowuje się do wybranego okresu — najedź kursorem na wykres, aby zobaczyć otwarcia/maksima/minima/zamknięcia dla danego słupka.
O Willamette Valley Vineyards, Inc. - Series A Redeemable Preferred Stock Przegląd firmy z Wikipedii
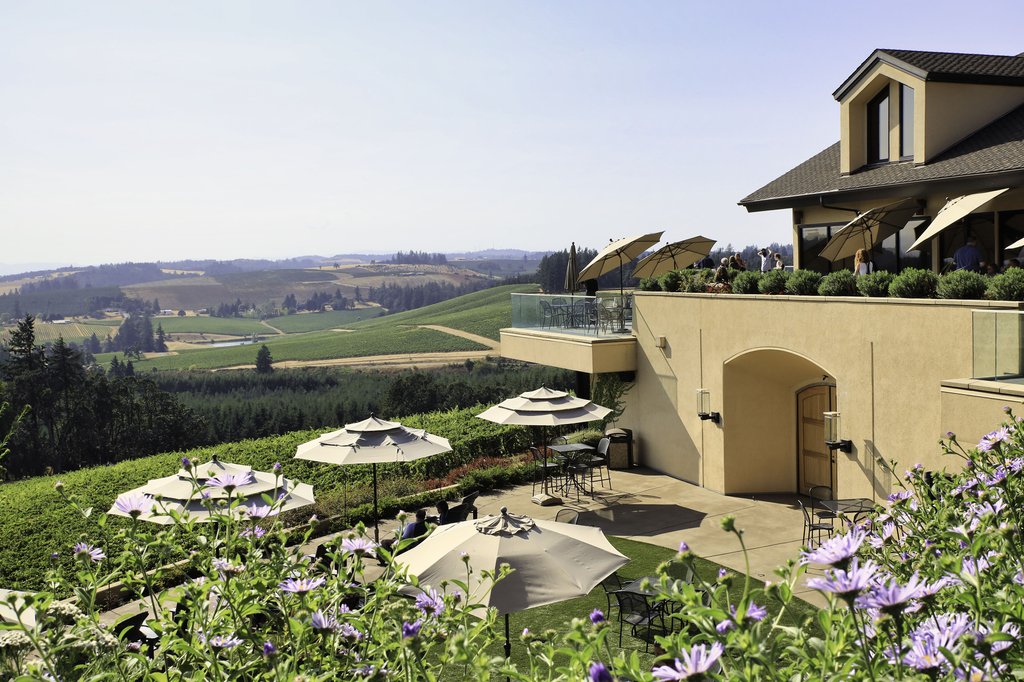
Willamette Valley Vineyards is an American winery located in Turner, Oregon. Named after Oregon's Willamette Valley, the winery is the leading producer of Willamette Valley-appellated Pinot Noir in Oregon, and also produces Chardonnay and Pinot Gris. In 2016, the winery was the largest producer of Riesling wine in the Willamette Valley.
History
Willamette Valley Vineyards was founded by Jim Bernau and Don Voorhies. In 1997, Willamette Valley Vineyards merged with Tualatin Estate Vineyards, which was established by Bill Fuller in 1973.
The winery was established via an early crowdfunding campaign. In 1989, around 1,200 shareholders invested an average of $1,700 each in an unlisted stock offering approved by Oregon regulators. By 1993, the number of shareholders had grown to 4,500 and many shareholders were directly involved with operations, collectively donating 6,000 to 7,000 hours of labor per month. Over 300 shareholders passed an OLCC class to be certified to pour wine in the tasting room. The winery is now listed on the NASDAQ under the symbol WVVI.
In 2021, the winery hosted the season 18 finale of Bravo's Top Chef: Portland.
Subsidiaries
In 2015, founder Jim Bernau and winery director Christine Clair founded the Oregon Estate Vineyards division to manage subsidiary vineyards.
Since 2007, Willamette Valley Vineyards has managed Elton Vineyards in the Eola-Amity Hills AVA. Elton Vineyards is primarily planted with Pinot Noir and Chardonnay. In 2017, Willamette Valley Vineyards began selling a boutique wine label under the "Elton" name.
In 2015, the company purchased new vineyard sites in the Walla Walla Valley AVA for a new subsidiary, "Pambrun Vineyard", named after Bernau's ancestor, Pierre Pambrun, a Walla Walla pioneer. Pambrun produces Cabernet Sauvignon along with other Bordeaux varieties. In 2018, Willamette Valley Vineyards acquired nearby Maison Bleue Winery, previously owned by Jon Meuret, who was also the consulting winemaker for Pambrun Vineyard.
Press coverage
In 2015, Wine Enthusiast named Willamette Valley Vineyards' Whole Cluster Pinot Noir as one of "America's Best Value Pinot Noirs".
The Wall Street Journal included Willamette Valley Vineyards' Pinot Gris in the article, "Why Wine Remains a Great Connector".
Źródło: Wikipedia (Angielski), CC BY-SA 4.0 · Zobacz w Wikipedii ↗
Wyniki 10-letnie Trendy przychodów, zysku netto, marż i EPS
Wycena Wskaźniki P/E, P/S, P/B, EV/EBITDA — czy akcje są drogie, czy tanie?
| Wskaźnik | Trend 5-letni | WVVIP | średnia z 5 lat | Mediana porównawcza | Werdykt |
|---|---|---|---|---|---|
| P/B (MRQ) | 0.2 | · | 0.2 | Zawyżona wycena |
Mediana porównawcza jest obliczana na znormalizowanej podstawie dla każdej metryki i może nie zawsze odpowiadać podstawie TTM/MRQ pokazanej dla tej akcji.
Rentowność Marże brutto, operacyjne i netto; ROE, ROA, ROIC
Za mało danych fundamentalnych, aby obliczyć tę grupę wskaźników.
Zdrowie finansowe Dług, płynność, wypłacalność — siła bilansu
| Wskaźnik | Trend 5-letni | WVVIP | średnia z 5 lat | Mediana porównawcza | Werdykt |
|---|---|---|---|---|---|
| Dług / Kapitał Własny (MRQ) | 0.2 | · | 0.2 | Wysokie zadłużenie | |
| Wskaźnik bieżący (MRQ) | 2.9 | · | 1.9 | Silna płynność | |
| Dług długoterminowy / Kapitał własny (MRQ) | 0.2 | · | · | · |
Rozwój Wzrost przychodów, EPS i zysku netto: r/r, CAGR 3-letni, CAGR 5-letni
Za mało danych fundamentalnych, aby obliczyć tę grupę wskaźników.
Efektywność kapitałowa Rotacja aktywów, rotacja zapasów, rotacja należności
Za mało danych fundamentalnych, aby obliczyć tę grupę wskaźników.
wartość · ≈ średnia z 5 lat · mediana branżowa · werdykt względem mediany
Dywidendy Stopa dywidendy, wskaźnik wypłaty, historia dywidend, 5-letni CAGR
| Data ex-dywidendy | Kwota | Waluta | Stopa zwrotu |
|---|---|---|---|
| Gru 5, 2025 | $0,22 | USD | ≈6.8% |
| Gru 6, 2024 | $0,22 | USD | ≈6.0% |
| Gru 6, 2023 | $0,22 | USD | ≈4.9% |
| Gru 6, 2022 | $0,22 | USD | ≈4.5% |
| Gru 6, 2021 | $0,22 | USD | ≈3.2% |
| Gru 4, 2020 | $0,22 | USD | ≈3.9% |
| Gru 5, 2019 | $0,22 | USD | ≈4.6% |
| Gru 6, 2018 | $0,22 | USD | ≈4.5% |
| Gru 7, 2017 | $0,22 | USD | ≈4.3% |
Historia zysków EPS faktyczny vs szacowany, zaskoczenie %, wskaźnik trafień, data następnych wyników
| Okres | Raport | EPS Actual | EPS Szacowany | Niespodzianka |
|---|---|---|---|---|
| 31 marca 2024 | $-0.22 | — | — | |
| 30 września 2023 | $-0.17 | — | — |
Pełne podstawowe wskaźniki Wszystkie wskaźniki roczne — rachunek zysków i strat, bilans, przepływy pieniężne
Nie mamy jeszcze dokumentów SEC dla tego tickera.
Rachunek zysków i strat
| Wskaźnik | Trend | Q2 2026 | Q2 2025 |
|---|---|---|---|
| Revenue | $10M | $10M | |
| Cost of Revenue | $4M | $4M | |
| Gross Profit | $6M | $6M | |
| SG&A Expense | $3M | $2M | |
| Operating Expenses | $7M | $6M | |
| Operating Income | $-1M | $398.2K | |
| Interest Expense | $268.0K | $270.1K | |
| Pretax Income | $-2M | $130.6K | |
| Income Tax | $-229.5K | $37.8K | |
| Net Income | $-1M | $92.8K | |
| EPS (Basic) | $-0.40 | $-0.09 | |
| EPS (Diluted) | $-0.40 | $-0.09 | |
| Shares (Basic) | 4,979,529 | 4,964,529 | |
| Shares (Diluted) | 4,979,529 | 4,964,529 | |
| EBITDA | $-1M | · |
Bilans
| Wskaźnik | Trend | Q2 2026 | Q2 2025 |
|---|---|---|---|
| Cash & Equivalents | $589.5K | · | |
| Receivables | $3M | · | |
| Inventory | $32M | · | |
| Prepaid Expense | $600.3K | · | |
| Current Assets | $36M | · | |
| PP&E (Net) | $48M | · | |
| PP&E (Gross) | $81M | · | |
| Accum. Depreciation | $33M | · | |
| Other Non-current Assets | $13.8K | · | |
| Total Assets | $103M | · | |
| Accounts Payable | $2M | · | |
| Accrued Liabilities | $2M | · | |
| Short-term Debt | $825.2K | · | |
| Current Liabilities | $12M | · | |
| Capital Leases | $11M | · | |
| Deferred Tax | $2M | · | |
| Total Liabilities | $37M | · | |
| Long-term Debt | $15M | · | |
| Total Debt | $15M | · | |
| Common Stock | $9M | · | |
| Retained Earnings | $11M | · | |
| Stockholders' Equity | $66M | · | |
| Liabilities + Equity | $103M | · | |
| Shares Outstanding | 4,979,529 | · |
Przepływy pieniężne
| Wskaźnik | Trend | Q2 2026 | Q2 2025 |
|---|---|---|---|
| D&A | $800.2K | · | |
| Stock-based Comp | $21.0K | · | |
| Operating Cash Flow | $2M | · | |
| CapEx | $28.5K | · | |
| Investing Cash Flow | $-53.5K | · | |
| Financing Cash Flow | $-2M | · | |
| Net Change in Cash | $184.8K | · |
Rentowność
| Wskaźnik | Trend | Q2 2026 | Q2 2025 |
|---|---|---|---|
| Gross Margin | 57.5% | · | |
| Operating Margin | -13.5% | · | |
| Net Margin | -13.9% | · | |
| Pretax Margin | -16.1% | · | |
| EBITDA Margin | -13.5% | · | |
| ROA | -1.3% | · | |
| ROE | -2.1% | · | |
| ROIC | -1.4% | · |
Płynność i wypłacalność
| Wskaźnik | Trend | Q2 2026 | Q2 2025 |
|---|---|---|---|
| Current Ratio | 2.9 | · | |
| Quick Ratio | 0.3 | · | |
| Debt / Equity | 0.2 | · | |
| LT Debt / Equity | 0.2 | · | |
| Interest Coverage | -5.1 | · |
Efektywność
| Wskaźnik | Trend | Q2 2026 | Q2 2025 |
|---|---|---|---|
| Asset Turnover | 0.1 | · | |
| Inventory Turnover | 0.1 | · | |
| Receivables Turnover | 4.0 | · |
Na akcję
| Wskaźnik | Trend | Q2 2026 | Q2 2025 |
|---|---|---|---|
| Book Value / Share | $13.34 | · | |
| Revenue / Share | $2.02 | · | |
| Cash / Share | $0.12 | · |
Wycena (TTM)
| Wskaźnik | Trend | Q2 2026 | Q2 2025 |
|---|---|---|---|
| Revenue TTM | $38M | $38M | |
| Net Income TTM | $-2M | $-428.3K | |
| Market Cap | $13M | · | |
| Enterprise Value | $28M | · | |
| P/S | 0.3 | 0.4 | |
| P/B | 0.2 | · | |
| P / Tangible Book | 0.2 | · | |
| EV / Revenue | 0.7 | 0.8 |
Najnowszy okres po lewej · wartości null pokazane jako ·
Sprawozdania finansowe Rachunek zysków i strat, bilans, przepływy pieniężne — roczne, ostatnie 5 lat
Zbyt mało danych fundamentalnych, aby utworzyć to sprawozdanie.
Zbyt mało danych fundamentalnych, aby utworzyć to sprawozdanie.
Zbyt mało danych fundamentalnych, aby utworzyć to sprawozdanie.
Insiderzy spółki 3 insiderów · 1 dyrektorzy generalni · 3 dyrektorzy
| Insider | Rola | Ostatnia aktywność | Posiadane akcje | Kupna 12m | Sprzedaże 12m | Netto 12m |
|---|---|---|---|---|---|---|
| James W Bernau | President | 1 października 2026 P | 380 001 | 18 | 0 | $9 491 |
| Chris Riccardi | Dyrektor | 1 października 2026 P | 491 661 | 15 | 0 | $11 486 |
| Sean M Cary | Dyrektor | 12 maja 2026 A | · | 0 | 0 | $0 |
Insiderzy z zgłoszeń SEC Form 3/4/5; netto = tylko otwarty rynek P/S
Porównanie z porównywalnymi firmami (podbranża GICS) Kluczowe metryki w porównaniu do konkurentów z sektora
Podstawa R/R, ceny według zamknięcia z ostatniego końca roku obrotowego każdej spółki.
Moje wskaźniki Twoja osobista lista obserwowanych — wybrane wiersze z Pełnych Fundamentów
Wybierz wskaźniki, które są dla Ciebie ważne — kliknij + obok dowolnego wiersza w sekcji Pełne dane fundamentalne powyżej.
Twój wybór został zapisany i będzie Ci towarzyszył we wszystkich tickerach.