
CMSD CMS Energy Corporation 5.875% Junior Subordinated Notes due 2079
NYSE · Utilities · Ver em SEC EDGAR ↗ fechar Out 2, 2026 10-K/10-Q Jul 28, 2026CMSD Instantâneo da Ação Preço, capitalização de mercado, P/E, EPS, ROE, dívida/patrimônio, intervalo de 52 semanas
CMSD Gráfico de Preço da Ação OHLCV diário com indicadores técnicos — panorâmica, zoom e personalize sua visualização
A granularidade da barra se adapta ao período selecionado — passe o mouse sobre o gráfico para ver a abertura/máxima/mínima/fechamento de uma barra.
Sobre CMS Energy Corporation 5.875% Junior Subordinated Notes due 2079 Visão geral da empresa da Wikipedia
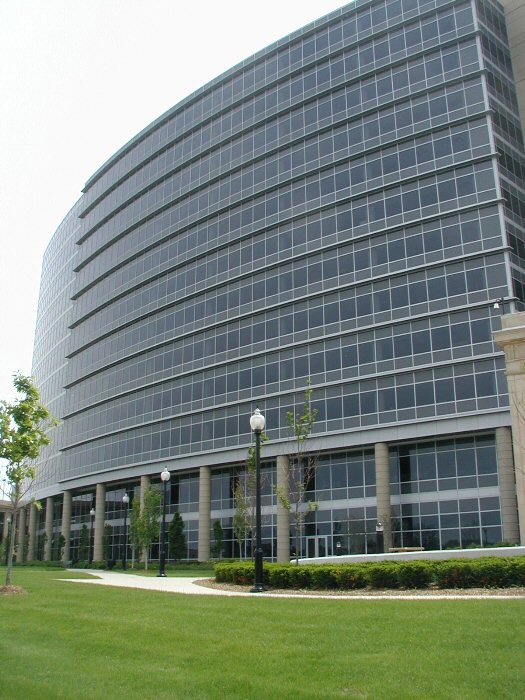
CMS Energy Corporation is an American energy company based in Jackson, Michigan, that is focused principally on utility operations in Michigan. Its principal business is Consumers Energy, a public utility that provides electricity and natural gas to more than 6 million of Michigan's 10 million residents. Its non-utility businesses are focused primarily on domestic independent power production. Consumers Energy has operated since 1886.
NorthStar Clean Energy's primary businesses are independent power production and natural gas transmission.
History
CMS Energy was formed in 1987 as a holding company with its principal subsidiaries as Consumers Energy and NorthStar Clean Energy. On October 23, 1987, CMS Energy became a publicly owned company and was listed at the New York Stock Exchange. The company's history dates back to 1886, when William Augustine Foote and Samuel Jarvis initially approached Jackson, Michigan officials and asked them to support efforts to illuminate Jackson's downtown with electric arc lights. They formed a company, Jackson Electric Light Works in 1888. In 1889, they built a hydro plant project at the Trowbridge Dam on the Kalamazoo River in Allegan. Foote, after seeing some early success, began consolidating his small power companies and formed Commonwealth Power Company.
In 1907, Foote and Jarvis built Croton Hydro project on the Muskegon River, the first project in the world that could transmit 110,000 volts of electricity. In 1920, Foote and Jarvis offered preferred shares of their company to the public to secure sufficient financing to enter other energy and power generation sectors. Over the next decades the company built several coal-fired, natural gas, nuclear and electric facilities. In 1946, the company formed a strategic partnership with Panhandle Company to convert former natural gas fields to underground natural gas storage areas. CMS Energy's primary subsidiary, Consumers Energy, announced Michigan's first nuclear power plant in 1961, Big Rock Point in Charlevoix, Michigan.
The company announced another nuclear plant, Palisades Nuclear Generating Station on Lake Michigan, which first produced electricity in December, 1971 to serve 400,000 people a day. CMS Energy owned the plant until 2006, when it was sold to Entergy. It then announced a gas reforming plant to furnish heat for Michigan homes in 1971. This plant was the first of its kind in North America to produce synthetic gas, converting impure liquid petroleum into pipeline-quality natural gas.
In 1987, CMS Energy, a holding company with its principal subsidiaries as Consumers Power and CMS Enterprises was formed. Consumers Power was rebranded Consumers Energy in 1997. The firm was one of the first companies to introduce an online billing system in the late 1990s.
In 2001, the firm entered into an exploration agreement with Eritrea for oil exploration in the Dismin Block of the Red Sea.
In 2002, CMS Energy founded EnerBank USA.
In 2003, the firm moved its headquarters to One Energy Plaza in Jackson, Michigan. In 2007, the company announced plans to invest $6 billion in Michigan's energy future to support new power plant technology and identify new energy sources. In 2014, Consumers Energy opened Cross Winds Energy Park in Michigan's Tuscola County and signed a contract with General Electric to supply 621.79-kilowatt wind turbine engines for the project which has a total generating capacity of 105 megawatts.
Oct 1, 2021, CMS Energy Completes Sale of EnerBank USA to Regions Bank.
On Nov 1st 2022, CMS Enterprises changes name to NorthStar Clean Energy as it begins to serve more corporate clients.
Sustainability and Environment
In 2015, 9 percent of CMS Energy's power comes from renewable energy sources. Primary CMS Energy subsidiary Consumers Energy joined the Wildlife Habitat Council as an active member. By 2007, all power facilities received the Clean Corporate Citizen award from the Michigan Department of Environmental Quality.
Awards
Consumers Energy, CMS Energy's primary subsidiary, was named Energy Star Partner of the Year in 2014 and 2015 for excellence in sustainable energy efficiency programs. In 2014, Consumers Energy was ranked among the top 15 most sustainable energy providers. Later that year, CMS Energy received Edison Electric Institute's Index Award for top cumulative shareholder return in the small cap category. The firm received the 2015 Emergency Recovery Award for its electricity restoration efforts during the December 2013 North American storm complex.
Criticism
In December 2011, the non-partisan organization Public Campaign criticized CMS Energy for spending $3.48 million on lobbying and not paying any taxes during 2008-2010, instead getting $29 million in tax rebates, despite making a profit of $415 million, and increasing executive pay by 79% to $900.4 million in 2010 for its top 5 executives.
Philanthropy
CMS Energy has helped establish and finance numerous research, educational and cultural institutes in the United States. Consumers Energy was given the William Booth Award in 2013 by The Salvation Army in recognition of its long history of philanthropic activities and leadership for the PeopleCare assistance program.
CMS Energy participates in internship and cooperative education programs to build career opportunities in Michigan. Consumers Energy has also worked on early childhood development and education in Michigan and has also received Wildlife Habitat Council (WHC) compliant certificates for its efforts to promote environmental education.
Fonte: Wikipedia (Inglês), CC BY-SA 4.0 · Ver na Wikipedia ↗
Desempenho de 10 Anos Tendências de receita, lucro líquido, margens e EPS
Avaliação Rácios P/E, P/S, P/B, EV/EBITDA — a ação está cara ou barata?
| Métrica | Tendência de 5 anos | CMSD | média 5A | Mediana de Pares | Veredito |
|---|---|---|---|---|---|
| P/B (MRQ) | 0.7 | · | · | · |
A mediana dos pares é calculada em uma base padronizada por métrica e pode não corresponder sempre à base TTM/MRQ mostrada para esta ação.
Lucratividade Margens bruta, operacional e líquida; ROE, ROA, ROIC
Ainda não há dados fundamentais suficientes para calcular este grupo de proporções.
Saúde financeira Dívida, liquidez, solvência — força do balanço patrimonial
| Métrica | Tendência de 5 anos | CMSD | média 5A | Mediana de Pares | Veredito |
|---|---|---|---|---|---|
| Dívida / Patrimônio Líquido (MRQ) | 1.9 | · | · | · | |
| Índice de liquidez corrente (MRQ) | 0.9 | · | · | · | |
| Dívida de Longo Prazo / Patrimônio Líquido (MRQ) | 1.9 | · | · | · |
Crescimento Crescimento da receita, EPS e lucro líquido: YoY, CAGR 3 anos, CAGR 5 anos
Ainda não há dados fundamentais suficientes para calcular este grupo de proporções.
Eficiência de Capital Giro de ativos, giro de estoques, giro de contas a receber
Ainda não há dados fundamentais suficientes para calcular este grupo de proporções.
valor · ≈ média 5A · mediana do setor · veredicto relativo à mediana
Dividendos Rendimento, índice de pagamento, histórico de dividendos, CAGR de 5 anos
| Data ex | Valor | Moeda | Rendimento |
|---|---|---|---|
| Ago 17, 2026 | $0,37 | USD | ≈6.9% |
| Mai 15, 2026 | $0,37 | USD | ≈6.4% |
| Fev 13, 2026 | $0,37 | USD | ≈6.2% |
| Nov 14, 2025 | $0,37 | USD | ≈6.1% |
| Ago 15, 2025 | $0,37 | USD | ≈6.3% |
| Mai 16, 2025 | $0,37 | USD | ≈6.7% |
| Fev 14, 2025 | $0,37 | USD | ≈6.2% |
| Nov 15, 2024 | $0,37 | USD | ≈6.0% |
| Ago 16, 2024 | $0,37 | USD | ≈6.0% |
| Mai 16, 2024 | $0,37 | USD | ≈6.0% |
| Fev 14, 2024 | $0,37 | USD | ≈6.0% |
| Nov 15, 2023 | $0,37 | USD | ≈6.2% |
| Ago 16, 2023 | $0,37 | USD | ≈6.2% |
| Mai 16, 2023 | $0,37 | USD | ≈6.1% |
| Fev 13, 2023 | $0,37 | USD | ≈6.0% |
| Nov 15, 2022 | $0,37 | USD | ≈6.2% |
| Ago 16, 2022 | $0,37 | USD | ≈5.8% |
| Mai 16, 2022 | $0,37 | USD | ≈6.0% |
| Fev 11, 2022 | $0,36 | USD | ≈5.6% |
| Nov 15, 2021 | $0,37 | USD | ≈5.5% |
Histórico de Lucros EPS real vs. estimativa, surpresa %, taxa de acerto, próxima data de resultados
| Período | Relatório | EPS Actual | EPS est. | Surpresa |
|---|---|---|---|---|
| 30 de Junho de 2026 | $0.37 | $0.36 | 1.6% | |
| 31 de Março de 2026 | $1.13 | $1.11 | 1.9% | |
| 31 de Dezembro de 2025 | $0.94 | $0.95 | -1.2% | |
| 30 de Setembro de 2025 | $0.93 | $0.85 | 8.9% | |
| 30 de Junho de 2025 | $0.71 | $0.70 | 2.1% | |
| 31 de Março de 2025 | $1.02 | $1.02 | -0.41% |
Fundamentos Completos Todas as métricas por ano — demonstração de resultados, balanço patrimonial, fluxo de caixa
Balanço Patrimonial
| Métrica | Tendência | 2025 |
|---|---|---|
| Cash & Equivalents | $509M | |
| Other Current Assets | $160M | |
| Current Assets | $3.47B | |
| PP&E (Net) | $30.68B | |
| Accum. Depreciation | $10.13B | |
| Other Non-current Assets | $398M | |
| Total Assets | $39.94B | |
| Current Liabilities | $3.55B | |
| Deferred Tax | $3.25B | |
| Other Non-current Liabilities | $392M | |
| Long-term Debt | $18.76B | |
| Common Stock | $3M | |
| Retained Earnings | $2.44B | |
| AOCI | $-36M | |
| Stockholders' Equity | $9.14B | |
| Liabilities + Equity | $39.94B | |
| Shares Outstanding | 306,400,000 |
Demonstração de Resultados
| Métrica | Tendência | Q2 2026 | Q1 2026 | Q2 2025 | Q1 2025 |
|---|---|---|---|---|---|
| Revenue | $1.83B | $2.73B | $1.84B | $2.45B | |
| Operating Expenses | $1.56B | $2.24B | $1.52B | $1.95B | |
| Operating Income | $264M | $490M | $317M | $494M | |
| Other Non-op | $75M | $75M | $137M | $50M | |
| Pretax Income | $129M | $362M | $255M | $358M | |
| Income Tax | $33M | $85M | $62M | $63M | |
| Net Income | $120M | $340M | $201M | $304M | |
| EPS (Basic) | $0.38 | $1.10 | $0.67 | $1.01 | |
| EPS (Diluted) | $0.37 | $1.10 | $0.66 | $1.01 | |
| Shares (Basic) | 310,200,000 | 306,400,000 | 298,500,000 | 298,200,000 | |
| Shares (Diluted) | 310,800,000 | 307,100,000 | 299,100,000 | 299,100,000 | |
| EBITDA | $572M | $902M | · | · |
Balanço Patrimonial
| Métrica | Tendência | Q2 2026 | Q1 2026 | Q2 2025 | Q1 2025 |
|---|---|---|---|---|---|
| Cash & Equivalents | $241M | $175M | · | · | |
| Other Current Assets | $243M | $225M | · | · | |
| Current Assets | $2.87B | $3.02B | · | · | |
| PP&E (Net) | $32.33B | $31.53B | · | · | |
| Accum. Depreciation | $10.50B | $10.38B | · | · | |
| Other Non-current Assets | $302M | $341M | · | · | |
| Total Assets | $40.91B | $40.28B | · | · | |
| Current Liabilities | $3.06B | $3.59B | · | · | |
| Deferred Tax | $3.40B | $3.35B | · | · | |
| Other Non-current Liabilities | $444M | $417M | · | · | |
| Long-term Debt | $19.04B | $18.86B | · | · | |
| Total Debt | $19.04B | $18.86B | · | · | |
| Common Stock | $3M | $3M | · | · | |
| Retained Earnings | $2.55B | $2.60B | · | · | |
| AOCI | $-35M | $-35M | · | · | |
| Stockholders' Equity | $9.77B | $9.47B | · | · | |
| Liabilities + Equity | $40.91B | $40.28B | · | · | |
| Shares Outstanding | 313,600,000 | 308,900,000 | · | · |
Fluxo de Caixa
| Métrica | Tendência | Q2 2026 | Q1 2026 | Q2 2025 | Q1 2025 |
|---|---|---|---|---|---|
| D&A | $308M | $412M | $288M | $388M | |
| Other Non-cash | · | $-47M | · | · | |
| Operating Cash Flow | $622M | $705M | · | $1.00B | |
| CapEx | $967M | $1.04B | · | $888M | |
| Investing Cash Flow | $-1.02B | $-1.07B | · | $-918M | |
| Debt Issued | $909M | $258M | · | $1.20B | |
| Net Debt Issued | · | $54M | · | · | |
| Stock Issued | $362M | $166M | · | $3M | |
| Net Stock Activity | · | $166M | · | · | |
| Financing Cash Flow | $480M | $16M | · | $266M | |
| Net Change in Cash | $82M | $-352M | · | $348M | |
| Free Cash Flow | · | $-334M | · | · |
Lucratividade
| Métrica | Tendência | Q2 2026 | Q1 2026 | Q2 2025 | Q1 2025 |
|---|---|---|---|---|---|
| Operating Margin | 14.4% | 17.9% | · | · | |
| Net Margin | 6.6% | 12.4% | · | · | |
| Pretax Margin | 7.0% | 13.3% | · | · | |
| EBITDA Margin | 31.3% | 33.0% | · | · | |
| ROA | 0.31% | 0.89% | · | · | |
| ROE | 1.3% | 3.8% | · | · | |
| ROIC | 0.68% | 1.3% | · | · |
Liquidez e Solvência
| Métrica | Tendência | Q2 2026 | Q1 2026 | Q2 2025 | Q1 2025 |
|---|---|---|---|---|---|
| Current Ratio | 0.9 | 0.8 | · | · | |
| Quick Ratio | 0.1 | 0.0 | · | · | |
| Debt / Equity | 1.9 | 2.0 | · | · | |
| LT Debt / Equity | 1.9 | 1.8 | · | · |
Eficiência
| Métrica | Tendência | Q2 2026 | Q1 2026 | Q2 2025 | Q1 2025 |
|---|---|---|---|---|---|
| Asset Turnover | 0.0 | 0.1 | · | · |
Por Ação
| Métrica | Tendência | Q2 2026 | Q1 2026 | Q2 2025 | Q1 2025 |
|---|---|---|---|---|---|
| Book Value / Share | $31.17 | $30.64 | · | · | |
| Revenue / Share | $5.88 | $8.89 | · | · | |
| Cash Flow / Share | · | $2.30 | · | · | |
| Cash / Share | $0.77 | $0.57 | · | · | |
| Dividend / Share | $0.57 | $0.57 | $0.54 | $0.54 | |
| EPS (TTM) | $3.33 | $3.62 | $3.39 | $3.38 |
Avaliação (TTM)
| Métrica | Tendência | Q2 2026 | Q1 2026 | Q2 2025 | Q1 2025 |
|---|---|---|---|---|---|
| Revenue TTM | $8.81B | $8.82B | $8.02B | $7.79B | |
| Net Income TTM | $1.03B | $1.11B | $1.02B | $1.02B | |
| Market Cap | $6.87B | $6.83B | · | · | |
| Enterprise Value | $25.66B | $25.51B | · | · | |
| P/E | 6.6 | 6.1 | 6.5 | 6.7 | |
| P/S | 0.8 | 0.8 | 0.8 | 0.9 | |
| P/B | 0.7 | 0.7 | · | · | |
| P / Tangible Book | 0.7 | 0.7 | · | · | |
| P / Cash Flow | · | 9.7 | · | · | |
| EV / Revenue | 2.9 | 2.9 | 3.0 | 3.0 | |
| Earnings Yield | 15.2% | 16.4% | 15.3% | 14.8% |
Período mais recente à esquerda · valores nulos mostrados como ·
Demonstrações Financeiras Demonstração de resultados, balanço patrimonial, fluxo de caixa — anual, últimos 5 anos
Ainda não há dados fundamentais suficientes para construir esta demonstração.
Ainda não há dados fundamentais suficientes para construir esta demonstração.
Ainda não há dados fundamentais suficientes para construir esta demonstração.
Investidores institucionais (13F) 2 declarantes · $20K total · Em 30 de Junho de 2026
Instituições que relatam a posse desta ação em seu Formulário 13F trimestral da SEC. Apenas posições compradas; um único declarante pode aparecer duas vezes para opções separadas. Grandes posições de compra/venda compensatórias geralmente refletem market-making ou inventário protegido, não convicção direcional.
| Novas posições | Posições encerradas | Aumentou | Diminuído | Variação líquida de ações |
|---|---|---|---|---|
| 0 (-1 vs trimestre anterior) | 0 (-1 vs trimestre anterior) | 1 (+1 vs trimestre anterior) | 1 (+1 vs trimestre anterior) | +478 |
Comparado a Q1 2026. Os registros do Formulário 13F da SEC devem ser feitos em até 45 dias após o final do trimestre, mais um pequeno período de tolerância para registrantes atrasados — trimestres ainda dentro desse período são ignorados em favor do par mais recente totalmente reportado.
| Instituição | Valor | Ações | % de 13F rastreado | Tipo |
|---|---|---|---|---|
| First Command Advisory Services, Inc. | $16.075 | 734 | 81,20% | Ações |
| PNC Financial Services Group, Inc. | $3.723 | 170 | 18,80% | Ações |
Executivos da empresa 1 insider · 1 diretores · 0 conselheiros
| Investidor com informação privilegiada | Função | Última atividade | Ações detidas | Compras 12m | Vendas 12m | Líquido 12m |
|---|---|---|---|---|---|---|
| Srikanth Maddipati | EVP/CFO | 31 de Julho de 2026 P | 34.895 | 1 | 0 | $14.492 |
Executivos de declarações SEC Formulário 3/4/5; líquido = apenas P/V de mercado aberto
Participação em ETFs Detido por 1 ETF
O peso reflete apenas participações diretas em ações (N-PORT); fundos alavancados ou baseados em derivativos podem deter exposição adicional a swaps não mostrada.
| Fundo | Peso | Unidades | Em | Fonte |
|---|---|---|---|---|
| FPE · First Trust Exchange-Traded Fund III | 0,25% | 705.428 NS | 31 de Julho de 2026 | N-PORT |
CMSD Consenso dos analistas Opiniões de analistas otimistas e pessimistas, preço-alvo de 12 meses, potencial de alta
Comparação de pares (subindústria GICS) Métricas chave vs pares do setor
Base do ano fiscal, preços no fechamento do último ano fiscal de cada empresa.
| Ticker | Capitalização de Mercado | P/E | Receita YoY | Margem Líquida | ROE | Margem Bruta |
|---|---|---|---|---|---|---|
| CMSD | · | · | · | · | · | · |
| WEC | $34.32B | 21.9 | 14.0% | 15.9% | 11.2% | · |
| PEG | $39.99B | 19.0 | 18.2% | 17.3% | 12.6% | · |
| AEE | $27.60B | 18.7 | 15.4% | 16.6% | 11.5% | · |
| DTE | · | · | · | · | · | · |
| CNP | $25.03B | 24.0 | 8.3% | 11.2% | 9.5% | · |
| CMS | $21.43B | 19.8 | 13.6% | 12.5% | 12.3% | · |
| NI | $19.98B | 21.4 | 23.5% | 14.2% | 10.2% | · |
| BKH | $5.24B | 17.4 | 8.6% | 12.6% | 8.0% | · |
| NWE | $3.96B | 22.0 | 6.4% | 11.2% | 6.3% | · |
| NWE | $3.96B | 22.0 | 6.4% | 11.2% | 6.3% | · |
Minhas Métricas Sua lista pessoal — linhas selecionadas de Fundamentos Completos
Escolha as métricas que importam para si — clique no + ao lado de qualquer linha em Fundamentos Completos acima.
Sua seleção é salva e acompanha você em todos os tickers.