
BN คลาส A Brookfield Corporation Class A Limited Voting Shares
NYSE · Financial Services · ดูใน SEC EDGAR ↗ ปิด ต.ค. 2, 2026 10-K/10-Q มี.ค. 18, 2026BN ภาพรวมหุ้น ราคา, มูลค่าหลักทรัพย์ตามราคาตลาด, P/E, EPS, ROE, อัตราส่วนหนี้สินต่อทุน, ช่วงราคา 52 สัปดาห์
BN กราฟราคาหุ้น OHLCV รายวันพร้อมตัวชี้วัดทางเทคนิค — แพน ซูม และปรับแต่งมุมมองของคุณ
ความละเอียดของแท่งเทียนจะปรับตามช่วงเวลาที่เลือก — เลื่อนเมาส์เหนือแผนภูมิเพื่อดูราคาเปิด/สูงสุด/ต่ำสุด/ปิดของแท่งเทียน
| วันที่ไม่ได้รับสิทธิปันผล | การแตกหุ้น | ประเภท |
|---|---|---|
| 10 ตุลาคม 2025 | 3-for-2 | ไปข้างหน้า |
| 12 ธันวาคม 2022 | 1237-for-1000 | ไปข้างหน้า |
| 2 เมษายน 2020 | 3-for-2 | ไปข้างหน้า |
| 20 มิถุนายน 2016 | 127-for-125 | ไปข้างหน้า |
| 13 พฤษภาคม 2015 | 3-for-2 | ไปข้างหน้า |
| 15 เมษายน 2013 | 1033-for-1000 | ไปข้างหน้า |
| 1 พฤษภาคม 2012 | 883-for-786 | ไปข้างหน้า |
| 4 มิถุนายน 2007 | 3-for-2 | ไปข้างหน้า |
| 28 เมษายน 2006 | 3-for-2 | ไปข้างหน้า |
| 2 มิถุนายน 2004 | 3-for-2 | ไปข้างหน้า |
| 11 สิงหาคม 1997 | 3-for-2 | ไปข้างหน้า |
| 14 เมษายน 1986 | 2-for-1 | ไปข้างหน้า |
เกี่ยวกับ Brookfield Corporation Class A Limited Voting Shares ภาพรวมบริษัทจาก Wikipedia
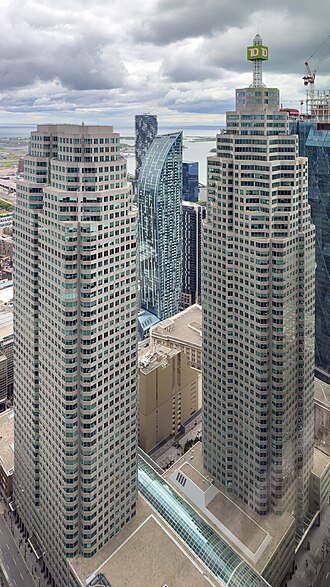
Brookfield Corporation is a Canadian multinational company that is one of the world's largest alternative investment management companies. It has over US$1 trillion of assets under management, much of which is workers’ deferred income from global public pension funds.
It focuses on direct control investments in real estate, renewable power, infrastructure, credit and private equity. The company invests in distressed securities through Oaktree Capital, which it bought in 2019. Brookfield Corporation's headquarters are in Toronto, while its primary subsidiary, Brookfield Asset Management, relocated to New York City in 2024.
The current Brookfield Corporation is the creation of the 1997 merger of Edper and Brascan. At its inception, the company was known as EdperBrascan, then changed its name to Brascan in 2000, and Brookfield Asset Management in 2005. In December 2022, the company renamed itself Brookfield Corporation (traded as BN) and spun off its asset management business as Brookfield Asset Management (traded as BAM).
In June 2024, Brookfield Asset Management ranked 24th in Private Equity International's PEI 300 ranking among the world's largest private equity firms.
As of 2026, Brookfield Corporation was ranked 224 on the Forbes Global 2000.
Predecessor companies
Brascan
The company was founded in 1899 as the São Paulo Tramway, Light and Power Company by William Mackenzie and Frederick Stark Pearson. It operated in the construction and management of electricity and transport infrastructure in Brazil.
In 1904, the Rio de Janeiro Tramway, Light and Power Company was founded by Mackenzie's group.
In 1912, Brazilian Traction, Light and Power Company was incorporated in Toronto as a public company to develop hydro-electric power operations and other utility services in Brazil, becoming a holding company for São Paulo Tramway Co. and Rio de Janeiro Tramway Co. In 1916, Great Lakes Power Company was incorporated to provide hydro-electric power in Sault Ste. Marie and the Algoma District in Ontario.
In 1966, Brazilian Traction, Light and Power Company changed its name to Brazilian Light and Power Company, and again in 1969, changed its name to Brascan Limited. Brascan is a portmanteau of “Brasil” and “Canada”.
During the 1970s, the company began to sell its Brazilian interests, and invested more heavily in industries such as real estate, timber and mining.
In 1979, the last of the company's Brazilian assets were transferred to Brazilian ownership (Eletropaulo and Light S.A.), the company meanwhile having diversified to other areas. The company provided electricity and tram services in São Paulo and Rio de Janeiro. After restructuring, the company's Brazilian portfolio operated as Light S.A., short for Brazilian Traction, Light and Power Co. Ltd.
In 1992, Brookfield and Johnson Controls was established through a merger in Canada of Brookfield and Johnson Controls—a building systems and facility management company that was founded in the late 19th century by Warren S. Johnson, whose invention of the first electric room thermostat helped launch the building control industry. By 2012, Brookfield and Johnson Controls became an established industry leader with 11,500 locations across Canada. In 2007, Brookfield Asset Management acquired the Multiplex, an Australian international construction contracting company founded in 1962 by John Roberts. which was valued at that time at approximately A$7.3 billion. It was renamed Brookfield Multiplex in 2016. In 2012 Brookfield Asset Management and Johnson Controls Global WorkPlace Solutions (GWS) merged to create Brookfield Johnson Controls.
Edper Investments
In 1959, Edper Investments was founded by brothers Peter and Edward Bronfman.
History of Brookfield
In April 1997, the Edper Group Ltd. announced its intention to merge with its subsidiary Brascan Ltd. At the time, Edper owned 47 per cent of Brascan shares. If approved, the merger would create a new $8 billion company. Robert Harding, president of Edper, stated that the intention of the merger was "furthering the simplification initiative that we started in 1993." On 10 July 1997, special meetings of both companies were held, and both groups of shareholders voted in favour of the merger. On 1 August 1997, the new EdperBrascan Corporation came into being as an Ontario corporation (number 1249197).
In 2002, Bruce Flatt was appointed CEO of Brascan.
In June 2005 Noranda, which was 41-percent-owned by Brascan, merged with Falconbridge Nickel Mines, and in August 2005 Brascan decided to sell its mineral holdings, to Xstrata.
In September 2005, after 37 years, Brascan Corp. was renamed to Brookfield Asset Management Inc. Between 2013 and 2018, the company and its subsidiaries invested approximately $10 billion in Brazilian energy, infrastructure and real estate developments, including acquisitions of oil pipelines from energy companies such as Petroleo Brasileiro SA.
In 2015, Brookfield Asset Management became the ultimate parent company of what is now Brookfield Global Integrated Solutions (BGIS), when it acquired control of Brookfield Johnson Controls from its joint venture partner, Milwaukee-based Johnson Controls. At that time, an activist investor had been putting pressure on Johnson Controls to divest of its real estate division. The facilities management business was renamed Brookfield Global Integrated Solutions (BGIS) as part of Brookfield's plan to establish a “leading global facilities management provider”. BGIS expanded rapidly following Brookfield's taking control of BGIS in 2015, In 2016, when BGIS acquired the US-based data centre facility management service—McKinstry FMS—which had over “350 engineers, technicians, planners and program managers”, BGIS became one of the largest facility management companies serving data centres in North America. By 2017, when Gord Hicks was named as Toronto-based BGIS’ CEO, the company had 7,000 staff members and 100 clients in the United States, the United Kingdom, Asia, and Canada, which included contracts with the Canadian federal government. By 2022, according to a Carleton University School of Public Policy and Administration analysis of federal government contracts for real estate management, the Government of Canada spent over $1 billion on contracts with BGIS in 2021–2022, representing the largest vendor contracts at that time. In 2019, Brookfield Asset Management sold its BGIS shares to CCMP Capital Advisors—an American private equity investment firm—for over CAD$1.3 billion with Hicks remaining as CEO. and was awarded the 2020 Private Equity Deal of the Year for the BGIS sale.
By 2018, Brookfield's major public subsidiaries included Brookfield Infrastructure Partners, Brookfield Renewable Partners, Brookfield Property Partners, and Brookfield Business Partners. In August 2018, Brookfield purchased Westinghouse Electric Company, a manufacturer of large nuclear reactors, out of bankruptcy for $4.6 billion.
On March 13, 2019, Brookfield Asset Management announced that it had agreed to buy most of Oaktree Capital Management for about $4.7 billion, creating one of the world's largest alternative money managers. On July 31, 2019, the sale of Vodafone New Zealand Limited to a consortium comprising Infratil Limited and Brookfield Asset Management Inc. was settled.
In a deal in October 2019, Brookfield bought The Leela Palaces, Hotels and Resorts, an Indian luxury hotel chain located in New Delhi, Bengaluru, Chennai, Udaipur, in a US$530 million settlement, marking the entry of Brookfield in India's hospitality market.
In 2020, in response to the COVID-19 pandemic, Brookfield's CEO Bruce Flatt assessed that the economic fallout was “much more manageable” than previous meltdowns.
In October 2020, Mark Carney, departing Governor of the Bank of England and future Prime Minister of Canada, became a vice-chair of Brookfield, leading the firm's environmental, social and governance (ESG) and impact fund investment strategy.
In November 2020, there were reports that Brookfield might partner with Rogers Communications to introduce condominiums to the site of the Rogers Centre baseball stadium, home of the Toronto Blue Jays of Major League Baseball, reducing the amount of space available for sport, but the partnership never transpired.
On April 25, 2022, it was announced the Brookfield and Simon Property Group were set to offer to buy Kohl's.
In November 2022, the Canada Pension Plan Investment Board (CPPIB) bought Brookfield's portfolio of Indian road assets for $1.2 billion.
In August 2022, Intel signed a $30 billion partnership with Brookfield to fund its recent factory expansions. As part of the deal, Intel would have a controlling stake by funding 51 percent of the cost of building new chip-making facilities in Chandler, Arizona, with Brookfield owning the remaining 49 percent stake, allowing the companies to split the revenue from those facilities.
On December 9, 2022, the company's name was changed from Brookfield Asset Management Inc. to Brookfield Corporation. Brookfield Corporation then spun-off 25% interest in their asset management business into the new publicly listed Brookfield Asset Management Ltd.
In April 2023, it was reported by Bloomberg that Brookfield Corporation had defaulted on $161.4 million worth of office building mortgages, mostly in the Washington D.C. area, due to high office vacancy and interest rates. Two months before, Brookfield defaulted on $784 million in mortgages for two Los Angeles office towers. It was suggested the defaults were a strategy to renegotiate commercial mortgages.
In November 2024, Brookfield committed an additional £900 million to support Canary Wharf Group months after its credit rating was cut to “junk” status. The value of CWG's office portfolio plunged by £1.5 billion to £4.27 billion after the COVID-19 pandemic caused a loss of tenants. Brookfield and Qatar Investment Authority had minority stakes in CWG until 2015 when the partners acquired 100% for an additional £2.6 billion.
Brookfield stated it was shifting towards residential properties and disposed of more than $10 billion of commercial properties from 2020 to 2022. In December 2024, Brookfield bought US student-housing communities for $893 million, eyeing communities that had growing student enrollment and limited supply. Brookfield also purchased, or was negotiating a $5 billion deal to obtain North American residential assets.
In January 2025, according to The Globe and Mail, it was announced that Brookfield had bought out its partners, CPPIB and Alberta Investment Management Corporation (AIMCo), in the Maritime Life Building in Toronto, which had been on the market for over two years without receiving a suitable offer.
In July 2025, Brookfield Wealth Solutions agreed to acquire Just Group, a UK-based financial services company, for $3.18 billion. The deal was part of Brookfield's planned expansion into the UK pension risk market.
In February 2026, Brookfield announced the promotion of Connor Teskey to Chief Executive of its asset management arm, as part of its broader succession planning for long-term Chief Executive Bruce Flatt.
Controversies
Bribery
In 2013, a Brazilian prosecutor filed charges against the company's local division, alleging the company paid bribes to local officials, which is also a violation of U.S. federal criminal law. The bribes were allegedly used to pave the way for Brookfield to build a shopping center in São Paulo. The U.S. Securities and Exchange Commission also opened a formal investigation into the company about the bribery charges. The company denied the charges. The U.S. Department of Justice also opened a criminal investigation into the company regarding these allegations, and did not end up making any arrests. According to the Stanford Law School Foreign Corrupt Practices Act Clearinghouse, which studied the case, the investigation and filing of charges was initiated by a whistleblower and anonymous tip. Later it was revealed that the whistleblower was the former CFO of a Brookfield subsidiary. She claims she was fired for refusing to participate in Brookfield's bribery scheme. The company disclosed the investigations on several 6-K forms between 2013 and 2015.
Circular cash flows
A March 2024 article in the Financial Times criticized Brookfield for its complex structure and its circular flows of cash after buying and selling multiple properties to itself at high, pre-pandemic valuations. These transactions were said to mask a $2 billion loss in its commercial real estate portfolio while boosting Brookfield's “distributable earnings,” a metric that the Financial Times called non-standard. Brookfield replied that there is nothing deceptive in its financial reporting and that the newspaper “willfully mischaracterized” its business.
Civil lawsuits and public reactions
In September 2010, a group called Birch Mountain Shareholders for Justice filed a lawsuit with the Ontario Superior Court of Justice against Brookfield Asset Management, challenging an acquisition and transfer of assets. Birch Mountain had run into financial troubles and accused Brookfield of financial engineering that resulted in Brookfield acquiring the company's $1.6 billion limestone quarry for $50 million. According to Birch Mountain, Brookfield had made use of death spiral financing and insider trading. After five years of litigation the case was dismissed, based on the fact that Birch Mountain had failed to present credible evidence. In May 2015, the plaintiffs filed a notice of appeal, but their case was likewise dismissed two years later.
In 2009, Brookfield sued financial and insurance giant American International Group (AIG) in a Manhattan federal court, alleging that AIG's collapse caused default provisions in interest-rate swaps. The suit stemmed from AIG's acceptance of a $182.3 billion bailout package from the federal government, which Brookfield argued overturned AIG's bankruptcy protection. The insurance firm countersued, claiming that Brookfield was trying to get out of its $1.5 billion debt to AIG. The litigation ended with Brookfield paying $905 million to settle the lawsuit.
In March 2013, the Southern Investigative Reporting Foundation called into question Brookfield's makeup. The analysis written by Roddy Boyd accused the company of using a pyramidal control structure, alleging that a small group of shareholders hold outsized power and may easily use the capital of other investors without risking their own.
In August 2018, Brookfield signed a 99-year lease on the financially troubled 666 Fifth Avenue (later renamed 660 Fifth Avenue) skyscraper in New York City, of Donald Trump's son-in-law Jared Kushner. The deal raised suspicions that the Qatar Investment Authority, a major investor in Brookfield, was attempting to influence the first Trump administration.
Finances
For the fiscal year 2018, Brookfield Asset Management reported earnings of US$3.584 billion, with an annual revenue of $56.771 billion, an increase of 39.2% over the previous fiscal cycle. Brookfield Asset Management's shares traded at over $38 per share, and its market capitalization was valued at over $40.8 billion in November 2018.
Leadership
Chief Executive Officer
Jack Lynn Cockwell, 1 August 1997 – February 2002
James Bruce Flatt, February 2002 – present
President
Jack Lynn Cockwell, 1 August 1997 – February 2002
James Bruce Flatt, February 2002 – 2005
Nicholas Howard Goodman, 12 December 2022 – present
Chairman of the Board
Robert James Harding, 1 August 1997 – 5 August 2010
Francis Joseph McKenna, 5 August 2010 – present
แหล่งที่มา: Wikipedia (ภาษาอังกฤษ), CC BY-SA 4.0 · ดูบน Wikipedia ↗
ผลการดำเนินงาน 10 ปี แนวโน้มรายได้ กำไรสุทธิ อัตรากำไร และ EPS
การประเมินมูลค่า อัตราส่วน P/E, P/S, P/B, EV/EBITDA — หุ้นมีราคาแพงหรือถูก?
| ตัวชี้วัด | แนวโน้ม 5 ปี | BN | ค่าเฉลี่ย 5 ปี | ค่ามัธยฐานของกลุ่มอุตสาหกรรม | บทสรุป |
|---|---|---|---|---|---|
| P/E | 93.7ค่าเฉลี่ย 5 ปี ≈72.0 | ≈72.0 | · | · |
ค่ามัธยฐานของกลุ่มบริษัทคำนวณตามมาตรฐานสำหรับแต่ละตัวชี้วัด และอาจไม่ตรงกับเกณฑ์ TTM/MRQ ที่แสดงสำหรับหุ้นนี้เสมอไป
ความสามารถในการทำกำไร อัตรากำไรขั้นต้น, อัตรากำไรจากการดำเนินงาน และอัตรากำไรสุทธิ; ROE, ROA, ROIC
| ตัวชี้วัด | แนวโน้ม 5 ปี | BN | ค่าเฉลี่ย 5 ปี | ค่ามัธยฐานของกลุ่มอุตสาหกรรม | บทสรุป |
|---|---|---|---|---|---|
| EBITDA Margin (อัตรากำไร EBITDA) | 13.8%ค่าเฉลี่ย 5 ปี ≈10.3% | ≈10.3% | · | · | |
| Net Profit Margin (อัตรากำไรสุทธิ) | 1.7%ค่าเฉลี่ย 5 ปี ≈2.2% | ≈2.2% | · | · | |
| ROA | 0.26%ค่าเฉลี่ย 5 ปี ≈0.44% | ≈0.44% | · | · | |
| ROE | 0.79%ค่าเฉลี่ย 5 ปี ≈1.3% | ≈1.3% | · | · |
สุขภาพทางการเงิน หนี้สิน, สภาพคล่อง, ความสามารถในการชำระหนี้ — ความแข็งแกร่งของงบดุล
ยังไม่มีข้อมูลพื้นฐานเพียงพอที่จะคำนวณกลุ่มอัตราส่วนนี้
การเติบโต การเติบโตของรายได้, EPS และกำไรสุทธิ: YoY, CAGR 3 ปี, CAGR 5 ปี
ยังไม่มีข้อมูลพื้นฐานเพียงพอที่จะคำนวณกลุ่มอัตราส่วนนี้
ประสิทธิภาพของเงินทุน อัตราหมุนเวียนสินทรัพย์, อัตราหมุนเวียนสินค้าคงคลัง, อัตราหมุนเวียนลูกหนี้
| ตัวชี้วัด | แนวโน้ม 5 ปี | BN | ค่าเฉลี่ย 5 ปี | ค่ามัธยฐานของกลุ่มอุตสาหกรรม | บทสรุป |
|---|---|---|---|---|---|
| Asset Turnover (อัตราหมุนเวียนสินทรัพย์) | 0.1ค่าเฉลี่ย 5 ปี ≈0.2 | ≈0.2 | · | · | |
| Inventory Turnover (อัตราหมุนเวียนสินค้าคงคลัง) | 5.0ค่าเฉลี่ย 5 ปี ≈6.0 | ≈6.0 | · | · | |
| Receivables Turnover (อัตราหมุนเวียนลูกหนี้) | 3.5ค่าเฉลี่ย 5 ปี ≈4.6 | ≈4.6 | · | · |
มูลค่า · ≈ ค่าเฉลี่ย 5 ปี · ค่าเฉลี่ยอุตสาหกรรม · การตัดสินใจเทียบกับค่าเฉลี่ย
เงินปันผล ผลตอบแทน, อัตราการจ่ายเงินปันผล, ประวัติเงินปันผล, CAGR 5 ปี
| วันที่ไม่ได้รับสิทธิปันผล | จำนวน | สกุลเงิน | ผลตอบแทน |
|---|---|---|---|
| ก.ย. 14, 2026 | $0.07 | USD | ≈0.72% |
| มิ.ย. 15, 2026 | $0.07 | USD | ≈0.57% |
| มี.ค. 17, 2026 | $0.07 | USD | ≈0.63% |
| ธ.ค. 16, 2025 | $0.06 | USD | ≈0.53% |
| ก.ย. 12, 2025 | $0.06 | USD | ≈0.52% |
| มิ.ย. 13, 2025 | $0.06 | USD | ≈0.59% |
| มี.ค. 14, 2025 | $0.06 | USD | ≈0.65% |
| ธ.ค. 16, 2024 | $0.05 | USD | ≈0.54% |
| ก.ย. 12, 2024 | $0.05 | USD | ≈0.63% |
| มิ.ย. 13, 2024 | $0.05 | USD | ≈0.73% |
| มี.ค. 12, 2024 | $0.05 | USD | ≈0.69% |
| พ.ย. 29, 2023 | $0.05 | USD | ≈0.79% |
| ส.ค. 30, 2023 | $0.05 | USD | ≈0.95% |
| พ.ค. 30, 2023 | $0.05 | USD | ≈1.2% |
| ก.พ. 27, 2023 | $0.05 | USD | ≈1.6% |
| พ.ย. 29, 2022 | $0.08 | USD | ≈1.6% |
| ส.ค. 30, 2022 | $0.08 | USD | ≈1.4% |
| พ.ค. 31, 2022 | $0.08 | USD | ≈1.3% |
| พ.ค. 27, 2022 | $0.08 | USD | ≈1.1% |
| ก.พ. 25, 2022 | $0.08 | USD | ≈0.97% |
ประวัติผลประกอบการ EPS จริงเทียบกับประมาณการ, เปอร์เซ็นต์ส่วนต่าง%, อัตราการชนะ, วันประกาศผลประกอบการครั้งถัดไป
| งวด | รายงาน | EPS Actual | EPS คาด | ส่วนต่าง |
|---|---|---|---|---|
| 30 มิถุนายน 2026 | ส.ค. 13, 2026 | $0.66 | $0.67 | -1.0% |
| 31 มีนาคม 2026 | พ.ค. 14, 2026 | $0.66 | $0.64 | 2.9% |
| 31 ธันวาคม 2025 | $0.67 | $0.62 | 7.4% | |
| 30 กันยายน 2025 | $0.63 | $0.59 | 7.6% | |
| 30 มิถุนายน 2025 | $0.59 | $0.60 | -2.4% | |
| 31 มีนาคม 2025 | $0.65 | $0.62 | 6.2% |
ปัจจัยพื้นฐานฉบับเต็ม ตัวชี้วัดทั้งหมดรายปี — งบกำไรขาดทุน, งบดุล, งบกระแสเงินสด
งบกำไรขาดทุน
| ตัวชี้วัด | แนวโน้ม | 2025 | 2024 | 2023 | 2022 | 2021 | 2020 | 2019 | 2018 | 2017 |
|---|---|---|---|---|---|---|---|---|---|---|
| Revenue | $75.10B | $86.01B | $95.92B | $92.77B | $75.73B | $62.75B | $67.83B | $56.77B | $40.79B | |
| Cost of Revenue | $28.35B | $40.12B | $52.22B | $54.04B | $44.15B | $35.15B | $41.46B | $37.51B | $26.46B | |
| SG&A Expense | $5.13B | $4.93B | $5.35B | $3.93B | $3.20B | $2.86B | $2.61B | $1.76B | $1.34B | |
| Interest Expense | · | · | · | $10.70B | $7.60B | $7.21B | $7.23B | $4.85B | $3.61B | |
| Income Tax | $1.14B | $982M | $1.01B | $1.47B | $2.32B | $837M | $495M | $-248M | $613M | |
| Net Income | $1.31B | $641M | $1.13B | $2.06B | $3.97B | $-134M | $2.81B | $3.58B | $1.46B | |
| EPS (Basic) | $0.51 | $0.21 | $0.62 | $1.22 | $2.47 | $-0.12 | $1.78 | $3.47 | $1.37 | |
| EPS (Diluted) | $0.49 | $0.20 | $0.61 | $1.19 | $2.39 | $-0.12 | $1.73 | $3.40 | $1.34 | |
| Shares (Basic) | 2,247,400,000 | 2,267,300,000 | 1,558,500,000 | 1,567,500,000 | 1,536,500,000 | 1,511,400,000 | 1,452,900,000 | 957,600,000 | 957,600,000 | |
| Shares (Diluted) | 2,367,800,000 | 2,376,800,000 | 1,588,200,000 | 1,608,200,000 | 1,586,900,000 | 1,511,400,000 | 1,488,400,000 | 977,400,000 | 977,400,000 | |
| EBITDA | $10.38B | $9.74B | $9.07B | $7.68B | $6.44B | $5.79B | $4.88B | $3.10B | $2.35B |
งบดุล
| ตัวชี้วัด | แนวโน้ม | 2025 | 2024 | 2023 | 2022 | 2021 | 2020 | 2019 | 2018 | 2017 |
|---|---|---|---|---|---|---|---|---|---|---|
| Cash & Equivalents | $10.90B | $10.50B | $8.80B | $12.00B | $10.80B | $8.20B | $5.70B | $7.70B | $4.50B | |
| Receivables | $22.77B | $20.28B | $20.26B | $19.49B | $16.10B | $14.19B | $13.86B | $11.91B | $8.49B | |
| Inventory | $5.92B | $5.42B | $7.06B | $9.11B | $8.56B | $6.34B | $7.05B | $4.58B | $3.58B | |
| Current Assets | · | · | · | · | · | · | · | · | $9.64B | |
| PP&E (Net) | $165.99B | $153.02B | $147.62B | $124.27B | $115.49B | $100.01B | $89.26B | $67.29B | $53.01B | |
| Goodwill | $43.35B | $35.73B | $34.91B | $28.66B | $20.23B | $14.71B | $14.55B | $8.81B | $5.32B | |
| Intangibles | $38.50B | $36.07B | $38.99B | $38.41B | $30.61B | $24.66B | $27.71B | $18.76B | $14.24B | |
| Total Assets | $518.97B | $490.42B | $490.10B | $441.28B | $391.00B | $343.70B | $323.97B | $256.28B | $192.72B | |
| Accounts Payable | $32.29B | $30.12B | $33.41B | $33.57B | $29.14B | $25.86B | $23.21B | $14.34B | $11.15B | |
| Current Liabilities | · | · | · | · | · | · | · | · | $10.31B | |
| Total Liabilities | $352.78B | $325.04B | $321.85B | $299.39B | $256.26B | $221.05B | $207.12B | $159.13B | $112.85B | |
| Stockholders' Equity | $166.19B | $165.38B | $168.24B | $141.89B | $134.74B | $122.64B | $116.85B | $97.15B | $79.87B |
กระแสเงินสด
| ตัวชี้วัด | แนวโน้ม | 2025 | 2024 | 2023 | 2022 | 2021 | 2020 | 2019 | 2018 | 2017 |
|---|---|---|---|---|---|---|---|---|---|---|
| D&A | $10.38B | $9.74B | $9.07B | $7.68B | $6.44B | $5.79B | $4.88B | $3.10B | $2.35B | |
| Other Non-cash | $-728M | $-2.81B | $-3.74B | $-988M | $-2.53B | $2.68B | $-1.35B | $-1.53B | $198M | |
| Operating Cash Flow | $10.96B | $7.57B | $6.47B | $8.75B | $7.87B | $8.34B | $6.33B | $5.16B | $4.00B | |
| CapEx | $14.75B | $11.17B | $8.07B | $7.24B | $6.88B | $4.01B | $3.05B | $1.96B | $1.69B | |
| Investing Cash Flow | $-31.78B | $-29.96B | $-29.76B | $-39.65B | $-21.05B | $-13.87B | $-36.67B | $-19.83B | $-11.39B | |
| Financing Cash Flow | $21.69B | $26.90B | $19.93B | $32.46B | $16.26B | $8.70B | $28.75B | $18.14B | $8.19B | |
| Free Cash Flow | $-3.79B | $-3.60B | $-1.60B | $1.51B | $993M | $4.33B | $3.27B | $3.20B | $2.31B |
ความสามารถในการทำกำไร
| ตัวชี้วัด | แนวโน้ม | 2025 | 2024 | 2023 | 2022 | 2021 | 2020 | 2019 | 2018 | 2017 |
|---|---|---|---|---|---|---|---|---|---|---|
| Net Margin | 1.7% | 0.75% | 1.2% | 2.2% | 5.2% | -0.21% | 4.1% | 6.3% | 3.6% | |
| EBITDA Margin | 13.8% | 11.3% | 9.5% | 8.3% | 8.5% | 9.2% | 7.2% | 5.5% | 5.8% | |
| ROA | 0.26% | 0.13% | 0.24% | 0.49% | 1.1% | -0.04% | · | 1.6% | 0.83% | |
| ROE | 0.79% | 0.38% | 0.73% | 1.5% | 3.1% | -0.11% | · | 4.0% | 2.0% |
สภาพคล่องและความสามารถในการชำระหนี้
| ตัวชี้วัด | แนวโน้ม | 2025 | 2024 | 2023 | 2022 | 2021 | 2020 | 2019 | 2018 | 2017 |
|---|---|---|---|---|---|---|---|---|---|---|
| Current Ratio | · | · | · | · | · | · | · | · | 0.9 | |
| Quick Ratio | · | · | · | · | · | · | · | · | 1.3 |
ประสิทธิภาพ
| ตัวชี้วัด | แนวโน้ม | 2025 | 2024 | 2023 | 2022 | 2021 | 2020 | 2019 | 2018 | 2017 |
|---|---|---|---|---|---|---|---|---|---|---|
| Asset Turnover | 0.1 | 0.2 | 0.2 | 0.2 | 0.2 | 0.2 | · | 0.3 | 0.2 | |
| Inventory Turnover | 5.0 | 6.4 | 6.5 | 6.1 | 5.9 | 5.2 | · | 9.2 | 8.1 | |
| Receivables Turnover | 3.5 | 4.2 | 4.8 | 5.2 | 5.0 | 4.5 | · | 5.6 | 5.4 |
ต่อหุ้น
| ตัวชี้วัด | แนวโน้ม | 2025 | 2024 | 2023 | 2022 | 2021 | 2020 | 2019 | 2018 | 2017 |
|---|---|---|---|---|---|---|---|---|---|---|
| Revenue / Share | $31.72 | $54.28 | $60.40 | $57.69 | $47.72 | $41.52 | $68.35 | $58.08 | · | |
| Cash Flow / Share | $4.63 | $4.78 | $4.07 | $5.44 | $4.96 | $5.52 | $6.38 | $5.28 | · | |
| EPS (TTM) | $0.49 | $0.20 | $0.61 | $1.19 | $2.39 | $-0.12 | $1.73 | $3.40 | $1.34 |
การประเมินมูลค่า (TTM)
| ตัวชี้วัด | แนวโน้ม | 2025 | 2024 | 2023 | 2022 | 2021 | 2020 | 2019 | 2018 | 2017 |
|---|---|---|---|---|---|---|---|---|---|---|
| Revenue TTM | $75.10B | $86.01B | $95.92B | $92.77B | $75.73B | $62.75B | $67.83B | $56.77B | $40.79B | |
| Net Income TTM | $1.31B | $641M | $1.13B | $2.06B | $3.97B | $-134M | $2.81B | $3.58B | $1.46B | |
| P/E | 93.7 | 191.5 | 43.8 | 17.6 | 13.6 | -184.1 | 11.9 | 4.0 | 11.6 | |
| Earnings Yield | 1.1% | 0.52% | 2.3% | 5.7% | 7.3% | -0.54% | 8.4% | 24.9% | 8.6% |
ต่อหุ้น
| ตัวชี้วัด | แนวโน้ม | Q4 2020 | Q4 2017 | Q4 2016 | Q4 2015 | Q4 2014 | Q4 2013 | Q4 2012 | Q4 2011 | Q4 2010 | Q4 2009 | Q4 2006 | Q4 2005 | Q4 2004 | Q4 2003 | Q4 2002 | Q4 2001 |
|---|---|---|---|---|---|---|---|---|---|---|---|---|---|---|---|---|---|
| EPS (TTM) | $-0.12 | $1.34 | $1.55 | · | · | · | · | · | · | · | · | · | · | · | · | · |
การประเมินมูลค่า (TTM)
| ตัวชี้วัด | แนวโน้ม | Q4 2020 | Q4 2017 | Q4 2016 | Q4 2015 | Q4 2014 | Q4 2013 | Q4 2012 | Q4 2011 | Q4 2010 | Q4 2009 | Q4 2006 | Q4 2005 | Q4 2004 | Q4 2003 | Q4 2002 | Q4 2001 |
|---|---|---|---|---|---|---|---|---|---|---|---|---|---|---|---|---|---|
| Revenue TTM | $62.75B | $40.79B | $24.41B | · | · | · | · | · | · | · | · | · | · | · | · | · | |
| Net Income TTM | $-134M | $1.46B | $1.65B | · | · | · | · | · | · | · | · | · | · | · | · | · | |
| P/E | -184.1 | 11.6 | 7.6 | · | · | · | · | · | · | · | · | · | · | · | · | · | |
| Earnings Yield | -0.54% | 8.6% | 13.2% | · | · | · | · | · | · | · | · | · | · | · | · | · |
ช่วงเวลาล่าสุดอยู่ทางซ้าย · ค่า null แสดงเป็น ·
งบการเงิน งบกำไรขาดทุน, งบดุล, งบกระแสเงินสด — รายปี, 5 ปีล่าสุด
| ตัวชี้วัด | 2025-12-31 | 2024-12-31 | 2023-12-31 | 2022-12-31 | 2021-12-31 |
|---|---|---|---|---|---|
| รายได้ | $75.10B | $86.01B | $95.92B | $92.77B | $75.73B |
| กำไรสุทธิ | $1.31B | $641M | $1.13B | $2.06B | $3.97B |
| EPS ที่ปรับลดแล้ว | $0.49 | $0.20 | $0.61 | $1.19 | $2.39 |
ยังไม่มีข้อมูลพื้นฐานเพียงพอที่จะสร้างงบการเงินนี้
| ตัวชี้วัด | 2025-12-31 | 2024-12-31 | 2023-12-31 | 2022-12-31 | 2021-12-31 |
|---|---|---|---|---|---|
| กระแสเงินสดอิสระ | $-3.79B | $-3.60B | $-1.60B | $1.51B | $993M |
ผู้ถือครองสถาบัน (13F) 1,007 รายงาน · $71.8B ทั้งหมด · ณ วันที่ 30 กันยายน 2026
สถาบันที่รายงานการถือครองหุ้นนี้ในเอกสาร SEC Form 13F รายไตรมาสของตน เฉพาะสถานะ Long; ผู้ยื่นคำร้องรายเดียวอาจปรากฏสองครั้งสำหรับสัญญาออปชันที่แยกจากกัน ขา put/call ขนาดใหญ่ที่หักล้างกันมักสะท้อนถึงการทำตลาด (market-making) หรือสินค้าคงคลังที่มีการป้องกันความเสี่ยง (hedged inventory) ไม่ใช่การเชื่อมั่นในทิศทาง
| พอร์ตใหม่ | ตำแหน่งที่ปิดไปแล้ว | เพิ่มขึ้น | ลดลง | การเปลี่ยนแปลงสุทธิของจำนวนหุ้น |
|---|---|---|---|---|
| 100 (-6 เทียบกับไตรมาสก่อน) | 63 (-25 เทียบกับไตรมาสก่อน) | 309 (-24 เทียบกับไตรมาสก่อน) | 325 (+43 เทียบกับไตรมาสก่อน) | +25.3M |
เปรียบเทียบกับ Q1 2026. การยื่นแบบฟอร์ม 13F ของ SEC จะครบกำหนดภายใน 45 วันนับจากสิ้นสุดไตรมาส บวกกับระยะเวลาผ่อนผันสั้นๆ สำหรับผู้ยื่นล่าช้า — ไตรมาสที่ยังอยู่ในช่วงเวลานี้จะถูกข้ามไปเพื่อใช้คู่ที่รายงานล่าสุดอย่างสมบูรณ์
| สถาบัน | มูลค่า | หุ้น | % ของ 13F ที่ติดตาม | ประเภท |
|---|---|---|---|---|
| Partners Value Investments L.P. | $7,726,079,623 | 181,405,955 | 10.76% | หุ้น |
| ROYAL BANK OF CANADA | $4,930,098,000 | 115,757,146 | 6.86% | หุ้น |
| VANGUARD GROUP INC | $4,228,914,755 | 92,103,120 | 5.89% | หุ้น |
| Capital World Investors | $3,351,399,738 | 78,684,708 | 4.67% | หุ้น |
| VANGUARD CAPITAL MANAGEMENT LLC | $2,618,843,361 | 61,381,539 | 3.65% | หุ้น |
| Dodge & Cox | $2,606,961,626 | 61,210,651 | 3.63% | หุ้น |
| PERSHING SQUARE INC. | $2,448,117,792 | 57,481,047 | 3.41% | หุ้น |
| BANK OF MONTREAL /CAN/ | $2,417,059,825 | 56,708,514 | 3.36% | หุ้น |
| Pershing Square Capital Management, L.P. | $2,415,946,008 | 59,697,208 | 3.36% | หุ้น |
| PRINCIPAL FINANCIAL GROUP INC | $2,344,907,077 | 55,057,354 | 3.26% | หุ้น |
| Brookfield Corp /ON/ | $1,994,251,366 | 46,824,404 | 2.78% | หุ้น |
| 1832 Asset Management L.P. | $1,809,967,311 | 42,497,472 | 2.52% | หุ้น |
| MACKENZIE FINANCIAL CORP | $1,497,600,475 | 24,936,347 | 2.08% | หุ้น |
| TD Asset Management Inc | $1,217,738,554 | 28,551,753 | 1.70% | หุ้น |
| NORGES BANK | $1,195,603,176 | 28,058,813 | 1.66% | หุ้น |
| FIL Ltd | $1,111,407,915 | 26,049,484 | 1.55% | หุ้น |
| NATIONAL BANK OF CANADA /FI/ | $1,036,076,594 | 24,328,364 | 1.44% | หุ้น |
| JARISLOWSKY, FRASER Ltd | $1,016,131,581 | 14,806,245 | 1.41% | หุ้น |
| GEODE CAPITAL MANAGEMENT, LLC | $970,862,920 | 22,299,618 | 1.35% | หุ้น |
| FIRST MANHATTAN CO. LLC. | $964,389,062 | 22,611,066 | 1.34% | หุ้น |
| CIBC WORLD MARKET INC. | $800,930,930 | 18,805,610 | 1.12% | หุ้น |
| VANGUARD FIDUCIARY TRUST CO | $791,333,695 | 18,547,608 | 1.10% | หุ้น |
| BANK OF NOVA SCOTIA | $707,454,833 | 16,584,463 | 0.98% | หุ้น |
| CIBC Asset Management Inc | $672,293,242 | 15,748,767 | 0.94% | หุ้น |
| CANADA PENSION PLAN INVESTMENT BOARD | $625,175,634 | 14,667,730 | 0.87% | หุ้น |
| TD Waterhouse Canada Inc. | $595,675,990 | 13,903,270 | 0.83% | หุ้น |
| MORGAN STANLEY | $585,114,538 | 13,738,306 | 0.81% | หุ้น |
| Capital International Investors | $564,185,430 | 13,247,143 | 0.79% | หุ้น |
| TORONTO DOMINION BANK | $559,238,067 | 13,120,954 | 0.78% | หุ้น |
| Markel Group Inc. | $556,805,009 | 13,073,609 | 0.78% | หุ้น |
| Federation des caisses Desjardins du Quebec | $546,558,098 | 12,858,377 | 0.76% | หุ้น |
| AKRE CAPITAL MANAGEMENT LLC | $516,187,709 | 12,119,927 | 0.72% | หุ้น |
| FMR LLC | $501,620,407 | 11,765,054 | 0.70% | หุ้น |
| UBS Group AG | $470,162,211 | 11,039,263 | 0.65% | หุ้น |
| SCOTIA CAPITAL INC. | $454,056,830 | 10,662,421 | 0.63% | หุ้น |
| Legal & General Group Plc | $445,539,999 | 10,447,234 | 0.62% | หุ้น |
| BANK OF AMERICA CORP /DE/ | $420,136,519 | 9,864,675 | 0.58% | หุ้น |
| DAVENPORT & Co LLC | $411,025,896 | 9,666,951 | 0.57% | หุ้น |
| GOLDMAN SACHS GROUP INC | $406,188,181 | 9,537,173 | 0.57% | หุ้น |
| JPMORGAN CHASE & CO | $383,476,565 | 9,100,060 | 0.53% | หุ้น |
| REGENTS OF THE UNIVERSITY OF CALIFORNIA | $382,424,298 | 8,979,204 | 0.53% | หุ้น |
| Vanguard Global Advisers, LLC | $380,003,161 | 8,906,672 | 0.53% | หุ้น |
| MANUFACTURERS LIFE INSURANCE COMPANY, THE | $345,453,446 | 8,112,388 | 0.48% | หุ้น |
| NEUBERGER BERMAN GROUP LLC | $300,418,485 | 7,053,087 | 0.42% | หุ้น |
| HEALTHCARE OF ONTARIO PENSION PLAN TRUST FUND | $295,558,436 | 6,936,231 | 0.41% | หุ้น |
| BAILLIE GIFFORD & CO | $248,657,073 | 5,838,391 | 0.35% | หุ้น |
| MASSACHUSETTS FINANCIAL SERVICES CO /MA/ | $217,952,621 | 4,030,678 | 0.30% | หุ้น |
| Connor, Clark & Lunn Investment Management Ltd. | $205,981,546 | 4,832,734 | 0.29% | หุ้น |
| PICTON MAHONEY ASSET MANAGEMENT | $202,235,091 | 4,751,905 | 0.28% | หุ้น |
| CHECK CAPITAL MANAGEMENT INC/CA | $187,786,592 | 4,409,171 | 0.26% | หุ้น |
นักเคลื่อนไหวและเจ้าของ %+ 5 21 รายการ
นักลงทุนที่ยื่น SEC Schedule 13D — กรรมสิทธิ์ตามผลประโยชน์ที่แท้จริงสูงกว่า % 5 โดยมีเจตนาที่จะมีอิทธิพลต่อผู้ออกหลักทรัพย์ (การถือหุ้นของนักเคลื่อนไหว, การรณรงค์ในคณะกรรมการ, M&A) แต่ละแถวแสดงสถานะล่าสุดที่ทราบของตำแหน่งของผู้ยื่นคำร้องรายนั้น
| ผู้ยื่นคำร้อง | ยื่นแล้ว | ส่วนได้เสีย | สถานะ | วัตถุประสงค์ | การยื่นคำร้อง |
|---|---|---|---|---|---|
| BROOKFIELD CORPORATION, BROOKFIELD WEALTH SOLUTIONS LTD., BUSI II-C L.P., BUSI II GP-C LLC, BIM CAPITAL LLC, BROOKFIELD REIT ADVISER LLC ×20 เอกสารยื่นคำร้อง | 22 เมษายน 2026 | 33.90% | การแก้ไข | · | SEC |
| PARTNERS VALUE INVESTMENTS L.P., PARTNERS VALUE SPLIT CORP., PARTNERS VALUE INVESTMENTS INC. | 30 พฤศจิกายน 2023 | · | การยื่นคำร้องครั้งแรก | · | SEC |
| BROOKFIELD ASSET MANAGEMENT LTD., BROOKFIELD ASSET MANAGEMENT ULC, BROOKFIELD US HOLDINGS INC., BROOKFIELD US INC., BROOKFIELD CORPORATION, BPG HOLDINGS GROUP INC., BPGH NEW SUBCO INC., BPGH NEW SUBCO 2 INC., BPGH SUB INC., BPG HOLDINGS GROUP (US) HOLDINGS INC., BROOKFIELD PROPERTY PARTNERS LIMITED, BROOKFIELD PROPERTY PARTNERS L.P., BROOKFIELD PROPERTY L.P., BROOKFIELD BPY HOLDINGS INC., BROOKFIELD US II INC., BROOKFIELD PROPERTY MASTER HOLDINGS LLC, BROOKFIELD PROPERTY GROUP LLC, BROOKFIELD PROPERTY GROUP II LLC, BUSI II NTR SUB LLC, BUSI II GP-C LLC, BUSI II-C L.P., BROOKFIELD PUBLIC SECURITIES GROUP HOLDINGS LLC, BROOKFIELD PUBLIC SECURITIES GROUP LLC, BIM CAPITAL LLC, BROOKFIELD REIT ADVISER LLC | 10 เมษายน 2023 | · | การยื่นคำร้องครั้งแรก | · | SEC |
| BROOKFIELD ASSET MANAGEMENT INC., BAM PARTNERS TRUST, BROOKFIELD HOLDINGS CANADA INC., BROOKFIELD US HOLDINGS INC., BROOKFIELD US INC., BROOKFIELD US II INC., BROOKFIELD PROPERTY MASTER HOLDINGS LLC, BROOKFIELD PROPERTY GROUP LLC, BROOKFIELD PROPERTY GROUP II LLC, BUSI II NTR SUB LLC, BUSI II GP-C LLC, BUSI II-C L.P., BROOKFIELD PUBLIC SECURITIES GROUP HOLDINGS LLC, BROOKFIELD PUBLIC SECURITIES GROUP LLC, BIM CAPITAL LLC, BROOKFIELD REIT ADVISER LLC ×123 เอกสารยื่นคำร้อง | 1 กรกฎาคม 2022 | · | การยื่นคำร้องครั้งแรก | · | SEC |
| PARTNERS VALUE INVESTMENTS LP, PARTNERS VALUE SPLIT CORP., PARTNERS LIMITED ×2 เอกสารยื่นคำร้อง | 9 เมษายน 2021 | · | การยื่นคำร้องครั้งแรก | · | SEC |
| BIF IV Cypress Aggregator (Delaware) LLC, Brookfield Infrastructure Fund IV GP LLC, Brookfield Asset Management Private Institutional Capital Adviser (Canada), L.P., Brookfield Asset Management Inc., Partners Limited | 30 กันยายน 2020 | · | การยื่นคำร้องครั้งแรก | การรณรงค์ในคณะกรรมการ | SEC |
| 251091708 Delaware LP, PubCo Investments LP, 2484842 Ontario Limited, Brookfield Capital Partners Ltd., BCP GP Limited, Brookfield Private Equity Group Holdings LP, Brookfield Private Equity Inc., Brookfield Asset Management Private Institutional Capital Adviser (Private Equity) LP, Brookfield Asset Management Inc., Partners Limited ×6 เอกสารยื่นคำร้อง | 7 เมษายน 2017 | · | การยื่นคำร้องครั้งแรก | · | SEC |
| Brookfield Retail Holdings LLC, Brookfield Retail Holdings II LLC, Brookfield Retail Holdings III LLC, Brookfield Retail Holdings IV-A LLC, Brookfield Retail Holdings IV-B LLC, Brookfield Retail Holdings IV-C LLC, Brookfield Retail Holdings IV-D LLC, Brookfield Retail Holdings V LP, Brookfield Retail Holdings VI LLC, Brookfield Asset Management Inc., Partners Limited, Brookfield Holdings Canada Inc., Brookfield Asset Management Private Institutional Capital Adviser (Canada) LP, Brookfield Private Funds Holdings Inc., Brookfield Retail Split LP, Brookfield Retail Split II LLC, Brookfield US Holdings Inc., Brookfield US Corporation, Brookfield REP GP Inc. ×2 เอกสารยื่นคำร้อง | 27 สิงหาคม 2012 | · | การยื่นคำร้องครั้งแรก | · | SEC |
| BROOKFIELD ASSET MANAGEMENT INC. N/A, PARTNERS LIMITED N/A ×7 เอกสารยื่นคำร้อง | 14 ตุลาคม 2011 | · | การยื่นคำร้องครั้งแรก | · | SEC |
| TRICAP PARTNERS LTD., BRASCAN ASSET MANAGEMENT HOLDINGS LIMITED, BROOKFIELD ASSET MANAGEMENT INC. | 16 ธันวาคม 2008 | · | การยื่นคำร้องครั้งแรก | · | SEC |
| ผู้รายงานที่ไม่ได้เปิดเผย, ผู้รายงานที่ไม่ได้เปิดเผย | 1 สิงหาคม 2008 | · | การยื่นคำร้องครั้งแรก | การรณรงค์ในคณะกรรมการ | SEC |
| ผู้รายงานที่ไม่ได้เปิดเผย, ผู้รายงานที่ไม่ได้เปิดเผย | 20 เมษายน 2007 | · | การยื่นคำร้องครั้งแรก | · | SEC |
| ผู้รายงานที่ไม่ได้เปิดเผย | 29 มีนาคม 2007 | · | การยื่นคำร้องครั้งแรก | M&A / การขาย | SEC |
| ผู้รายงานที่ไม่ได้เปิดเผย, ผู้รายงานที่ไม่ได้เปิดเผย, ผู้รายงานที่ไม่ได้เปิดเผย | 18 มกราคม 2006 | · | การยื่นคำร้องครั้งแรก | · | SEC |
| ผู้รายงานที่ไม่ได้เปิดเผย, ผู้รายงานที่ไม่ได้เปิดเผย, ผู้รายงานที่ไม่ได้เปิดเผย | 21 พฤศจิกายน 2005 | · | การยื่นคำร้องครั้งแรก | · | SEC |
| ผู้รายงานที่ไม่ได้เปิดเผย, ผู้รายงานที่ไม่ได้เปิดเผย, ผู้รายงานที่ไม่ได้เปิดเผย | 6 ตุลาคม 2005 | · | การยื่นคำร้องครั้งแรก | M&A / การขาย | SEC |
| BRASCAN CORPORATION, PARTNERS LIMITED ×4 เอกสารยื่นคำร้อง | 17 สิงหาคม 2005 | · | การยื่นคำร้องครั้งแรก | · | SEC |
| ผู้รายงานที่ไม่ได้เปิดเผย, ผู้รายงานที่ไม่ได้เปิดเผย, ผู้รายงานที่ไม่ได้เปิดเผย | 28 กรกฎาคม 2005 | · | การยื่นคำร้องครั้งแรก | · | SEC |
| ผู้รายงานที่ไม่ได้เปิดเผย, ผู้รายงานที่ไม่ได้เปิดเผย, ผู้รายงานที่ไม่ได้เปิดเผย, ผู้รายงานที่ไม่ได้เปิดเผย | 23 กุมภาพันธ์ 2005 | · | การยื่นคำร้องครั้งแรก | · | SEC |
| ผู้รายงานที่ไม่ได้เปิดเผย, ผู้รายงานที่ไม่ได้เปิดเผย | 7 ตุลาคม 2003 | · | การยื่นคำร้องครั้งแรก | โครงสร้างเงินทุน | SEC |
| BRASCAN REAL ESTATE FINANCE FUND I L.P., BRASCAN CORPORATION, EDPERPARTNERS LIMITED, BARRY S. BLATTMAN | 3 กุมภาพันธ์ 2003 | · | การยื่นคำร้องครั้งแรก | · | SEC |
Purpose is an automated classification of the filer's own stated purpose (SEC Item 4) — not investment advice. "—" means no clear purpose was stated or the text could not be classified.
ผู้บริหารบริษัท 1 รายชื่อผู้บริหาร · ผู้บริหาร 0 คน · กรรมการ 0 คน
| ผู้บริหารภายใน | บทบาท | กิจกรรมล่าสุด | หุ้นที่ถือครอง | ซื้อ 12 เดือน | ขาย 12 เดือน | สุทธิ 12 เดือน |
|---|---|---|---|---|---|---|
| Brookfield Corporation | ผู้ถือหุ้น 10% | 23 พฤศจิกายน 2005 S | 14,140,893 | 0 | 0 | $0 |
ผู้บริหารจากเอกสาร SEC Form 3/4/5; สุทธิ = เฉพาะการซื้อขายในตลาดเปิด
การถือครอง ETF ถือโดย ETF 43 ราย
น้ำหนักสะท้อนถึงการถือครองหุ้นโดยตรง (N-PORT) เท่านั้น กองทุนเลเวอเรจหรือกองทุนที่อิงตราสารอนุพันธ์อาจมีการเปิดรับความเสี่ยงจากสัญญาแลกเปลี่ยน (swap) เพิ่มเติมซึ่งไม่แสดง
| กองทุน | น้ำหนัก | หน่วย | ณ วันที่ | แหล่งที่มา |
|---|---|---|---|---|
| LBO · EA Series Trust | 3.11% | 5,155 NS | 31 กรกฎาคม 2026 | N-PORT |
| BBCA · J.P. Morgan Exchange-Traded Fund Tr… | 2.55% | 6,514,357 NS | 31 กรกฎาคม 2026 | N-PORT |
| EWC · iShares, Inc. | 2.44% | 4,385,543 SH | 11 กันยายน 2026 | รายวัน |
| EWQ · iShares, Inc. | 2.14% | 103,710 SH | 11 กันยายน 2026 | รายวัน |
| VIGI · VANGUARD WHITEHALL FUNDS | 1.64% | 3,489,336 SH | 19 สิงหาคม 2026 | รายวัน |
| KXI · iShares Trust | 1.25% | 186,392 SH | 11 กันยายน 2026 | รายวัน |
| EFAV · iShares Trust | 0.72% | 543,420 SH | 11 กันยายน 2026 | รายวัน |
| LQAI · Exchange Listed Funds Trust | 0.70% | 364 NS | 31 กรกฎาคม 2026 | N-PORT |
| EZU · iShares, Inc. | 0.59% | 802,283 SH | 11 กันยายน 2026 | รายวัน |
| IXG · iShares Trust | 0.51% | 93,103 SH | 11 กันยายน 2026 | รายวัน |
| VEA · VANGUARD TAX-MANAGED FUNDS | 0.43% | 26,617,621 SH | 19 สิงหาคม 2026 | รายวัน |
| IDEV · iShares Trust | 0.41% | 2,867,292 SH | 11 กันยายน 2026 | รายวัน |
| IDLV · Invesco Exchange-Traded Fund Trust … | 0.40% | 19,665 SH | 2 ตุลาคม 2026 | รายวัน |
| EFV · iShares Trust | 0.40% | 1,770,480 SH | 11 กันยายน 2026 | รายวัน |
| PTIN · Pacer Funds Trust | 0.38% | 16,365 NS | 31 กรกฎาคม 2026 | N-PORT |
| BKIE · BNY Mellon ETF Trust | 0.36% | 111,211 NS | 31 กรกฎาคม 2026 | N-PORT |
| ESGD · iShares Trust | 0.35% | 583,041 SH | 11 กันยายน 2026 | รายวัน |
| VEU · VANGUARD INTERNATIONAL EQUITY INDEX… | 0.34% | 6,371,143 SH | 19 สิงหาคม 2026 | รายวัน |
| IEV · iShares Trust | 0.33% | 76,005 SH | 11 กันยายน 2026 | รายวัน |
| ACWX · iShares Trust | 0.32% | 875,688 SH | 11 กันยายน 2026 | รายวัน |
| PXF · Invesco Exchange-Traded Fund Trust … | 0.32% | 203,248 SH | 2 ตุลาคม 2026 | รายวัน |
| VGK · VANGUARD INTERNATIONAL EQUITY INDEX… | 0.32% | 1,513,278 SH | 19 สิงหาคม 2026 | รายวัน |
| VXUS · VANGUARD STAR FUNDS | 0.31% | 40,030,291 SH | 19 สิงหาคม 2026 | รายวัน |
| IEUR · iShares Trust | 0.29% | 363,550 SH | 11 กันยายน 2026 | รายวัน |
| VYMI · VANGUARD WHITEHALL FUNDS | 0.28% | 707,080 SH | 19 สิงหาคม 2026 | รายวัน |
| IXUS · iShares Trust | 0.28% | 3,606,306 SH | 11 กันยายน 2026 | รายวัน |
| IMFL · Invesco Exchange-Traded Self-Indexe… | 0.22% | 39,329 SH | 2 ตุลาคม 2026 | รายวัน |
| DFSI · Dimensional ETF Trust | 0.22% | 59,799 NS | 31 กรกฎาคม 2026 | N-PORT |
| EFA · iShares Trust | 0.21% | 2,252,564 SH | 11 กันยายน 2026 | รายวัน |
| DFAI · Dimensional ETF Trust | 0.20% | 840,095 NS | 31 กรกฎาคม 2026 | N-PORT |
| IEFA · iShares Trust | 0.17% | 4,737,221 SH | 11 กันยายน 2026 | รายวัน |
| VSGX · VANGUARD WORLD FUND | 0.15% | 126,751 SH | 19 สิงหาคม 2026 | รายวัน |
| TLTD · FlexShares Trust | 0.15% | 23,116 NS | 31 กรกฎาคม 2026 | N-PORT |
| TOK · iShares Trust | 0.15% | 7,457 SH | 11 กันยายน 2026 | รายวัน |
| URTH · iShares, Inc. | 0.14% | 239,257 SH | 11 กันยายน 2026 | รายวัน |
| VT · VANGUARD INTERNATIONAL EQUITY INDEX… | 0.12% | 2,296,805 SH | 19 สิงหาคม 2026 | รายวัน |
| ACWI · iShares Trust | 0.12% | 829,878 SH | 11 กันยายน 2026 | รายวัน |
| VOXP · Advisors Series Trust | 0.10% | 138 NS | 31 กรกฎาคม 2026 | N-PORT |
| INTF · iShares Trust | 0.10% | 49,657 SH | 11 กันยายน 2026 | รายวัน |
| DFIC · Dimensional ETF Trust | 0.08% | 263,873 NS | 31 กรกฎาคม 2026 | N-PORT |
| DFAX · Dimensional ETF Trust | 0.06% | 175,748 NS | 31 กรกฎาคม 2026 | N-PORT |
| ACWV · iShares, Inc. | 0.06% | 26,701 SH | 11 กันยายน 2026 | รายวัน |
| CRBN · iShares Trust | 0.00% | 1,077 SH | 10 กันยายน 2026 | รายวัน |
BN ความเห็นหลายต่อหลายของนักวิเคราะห์ มุมมองนักวิเคราะห์ทั้งเชิงบวกและเชิงลบ, ราคาเป้าหมาย 12 เดือน, อัพไซด์
ราคาเป้าหมาย 12 เดือน
10 นักวิเคราะห์ · 2026-09-30ราคาเป้าหมายค่าเฉลี่ย $54.40 +47.3%
ข่าวล่าสุด หัวข้อข่าวล่าสุดที่กล่าวถึงบริษัทนี้
สัญญาณซื้อขาย สัญญาณซื้อ/ขายล่าสุดพร้อมราคาเข้าและอัตราส่วนความเสี่ยง/ผลตอบแทน
ขณะนี้ไม่มีสัญญาณเปิด — ไม่มี การ์ดใดถูกเติมข้อมูล และนั่นคือความจริง
ตัวชี้วัดของฉัน รายการเฝ้าดูส่วนตัวของคุณ — แถวที่เลือกจากข้อมูลพื้นฐานฉบับเต็ม
เลือกตัวชี้วัดที่สำคัญสำหรับคุณ — คลิกเครื่องหมาย + ถัดจากแถวใดก็ได้ใน Fundamentals ฉบับเต็มด้านบน
การเลือกของคุณถูกบันทึกและจะติดตามคุณไปในทุกสัญลักษณ์หุ้น