
KGC Kinross Gold Corporation Common Stock
NYSE · Metals & Mining · ดูใน SEC EDGAR ↗ 10-K/10-Q มี.ค. 26, 2026KGC ภาพรวมหุ้น ราคา, มูลค่าหลักทรัพย์ตามราคาตลาด, P/E, EPS, ROE, อัตราส่วนหนี้สินต่อทุน, ช่วงราคา 52 สัปดาห์
KGC กราฟราคาหุ้น OHLCV รายวันพร้อมตัวชี้วัดทางเทคนิค — แพน ซูม และปรับแต่งมุมมองของคุณ
ความละเอียดของแท่งเทียนจะปรับตามช่วงเวลาที่เลือก — เลื่อนเมาส์เหนือแผนภูมิเพื่อดูราคาเปิด/สูงสุด/ต่ำสุด/ปิดของแท่งเทียน
| วันที่ไม่ได้รับสิทธิปันผล | การแตกหุ้น | ประเภท |
|---|---|---|
| 3 กุมภาพันธ์ 2003 | 1-for-3 | ย้อนกลับ |
เกี่ยวกับ Kinross Gold Corporation Common Stock ภาพรวมบริษัทจาก Wikipedia
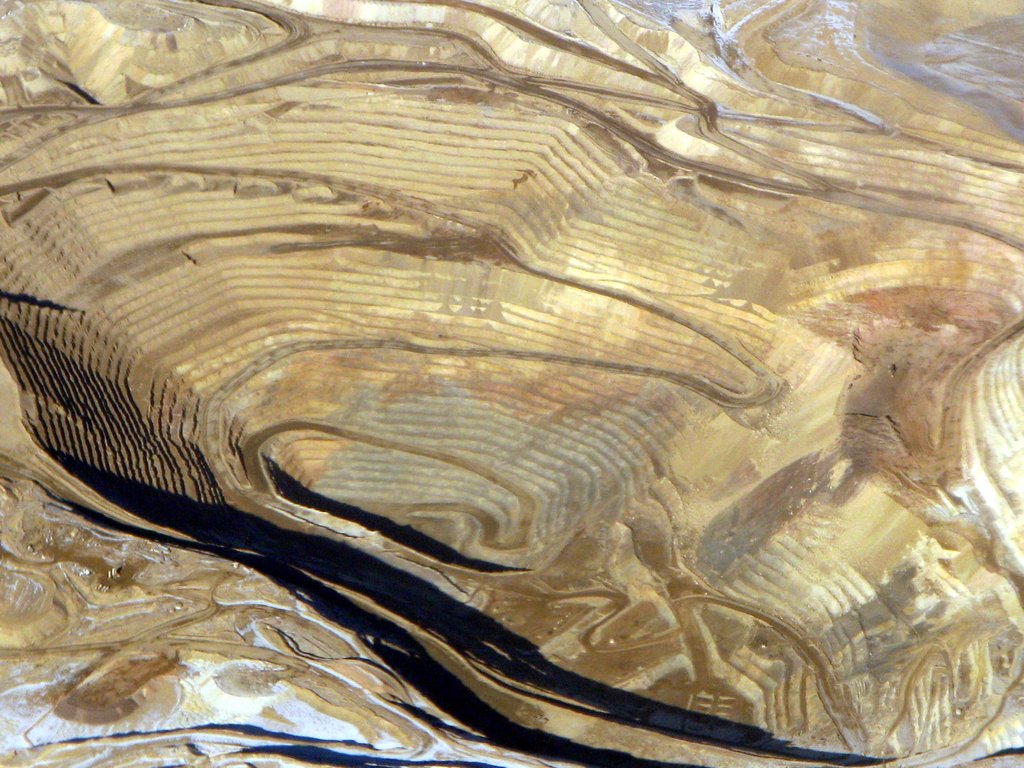
Kinross Gold Corporation is a Canadian gold and silver mining company founded in 1993 and headquartered in Toronto, Ontario, Canada. Kinross currently operates six active gold mines, and was ranked fifth of the "10 Top Gold-mining Companies" of 2019 by InvestingNews. The company's mines are located in Brazil, Mauritania, and the United States. It trades under the KGC ticker in the New York Stock Exchange, and under K in the Toronto Stock Exchange.
Operations
Kinross Gold operates mines in North and South America, and West Africa. In 2022, 58% of Kinross gold production was expected to come from the Americas.
Fort Knox
This property includes a mill, tailings storage, heap leach facility, the Gil project, and the True North open pit mine, which is closed and under monitoring. Expected to run out of ore in 2021, the mine's life has been extended to 2030 following a $100 million expansion investment announced in 2018, increasing life-of-mine production by about 1.5 million gold equivalent ounces.
Round Mountain
The Round Mountain Gold Mine is located in Nye County, Nevada and has operated by Kinross since 2003. They purchased the remaining outstanding interest in the company from Barrick Gold in 2016.
Bald Mountain
Located in White Pine County, Nevada, the Bald Mountain mine is operated by subsidiary KG Mining (Bald Mountain) Inc.
Paracatu
The open-pit Paracatu gold mine, located in northwest Minas Gerais, Brazil.
Tasiast
Kinross acquired the Tasiast mine (located in Mauritania) in 2010, expanding the operation twice by 2017.
In 2012, securities class action lawsuits launched in the U.S. and Canada, alleging Kinross Gold overstated the value of Tasiast mine in its financial statements, misrepresented some of the mine's project expansion schedules, and made other false statements. In 2015, the parties reached no-fault settlement agreements which included payments by Kinross totaling approximately $US 40 million.
In June 2016, due to "government allegations of invalid work permits" for expatriate employees, the mine suspended operations, resuming them in August that same year.
In May 2020, there was a short strike by unionized employees at the mine, which was suspended at the request of the Mauritanian government. A month later, Kinross reached an agreement in principle with the government, which included revalued royalties.
Chirano
Kinross holds 90% ownership of the Chirano gold mine, with the remainder held by the Government of Ghana. In April 2022, Kinross announced plans to sell its 90% ownership for US$225-million to Asante Gold Corp.
History
Founding and early years
Kinross Gold Corporation was founded in 1993, following the amalgamation of three companies: Plexus Resources Corporation, CMP Resources and numbered company 1021105 Ontario Corp., resulting in the new company owning a stake and royalties in a mining property in Fallon, Nevada and the QR Mine in British Columbia. On June 1, 1993, Kinross was listed on the Toronto Stock Exchange and NASDAQ, then on the New York Stock Exchange in 1994.
Kinross' first project – now operated by its subsidiary Fairbanks Gold Mining – was the Fort Knox Gold Mine, an open-pit mining operation in Alaska. The area, including surrounding deposits, was prospected as early as 1913, but no mining took place until 1996. The mine currently produces over 200,000 ounces of gold a year.
In 1998, a wholly owned subsidiary of Kinross merged with Amax Gold, forming Kinam Gold, the company's largest subsidiary. effectively transferring ownership of the mine back to Kinross, along with Maricunga Gold Mine in Chile, as part of the merger.
1999–2006
Kinross acquired Hollinger Mines in 1999 as part of a land package prior to the bankruptcy of Royal Oak Mines (later sold to Goldcorp in 2006). Also that year, Kinross acquired LA Teko Resources Ltd. through its wholly owned subsidiary, LT Acquisition Inc. division.
In July 2002, Kinross and Placer Dome combined their assets in Timmins, Ontario and formed the Porcupine Joint Venture (51% Placer Dome, 49% Kinross). In January 2003 Kinross TVX Gold and Echo Bay Mines shareholders approved a $3-billion merger, combining the three companies, while retaining the name Kinross Gold. The TVX merger resulted in Kinross' stake in the La Coipa open pit mine, the remainder being purchased from Goldcorp in 2007.
In 2006, Kinross bought Crown Resources Corporation, which gave it ownership of the mineral resource Buckhorn Mountain (later Buckhorn Gold Mine) and the associated mineral processing facilities.
2007–present
In 2007, Kinross traded assets with Goldcorp; Kinross received $200 million and the remaining portion of the La Coipa Gold Mine it had acquired with the TVX merger, in exchange for giving up its 49% of the Porcupine Joint Venture and 31.9% of the Musselwhite mine.
In 2010, Kinross purchased 91% of Red Back Mining for $7.1 billion. The purchase brought with it the two gold mines in Africa (Chirano and Tasiast). Also that year, Kinross acquired the Dvoinoye deposit and the property in Vodorazdelnaya, about 90 kilometres (56 mi) north of Kinross’ Kupol operation. In 2011, Kinross entered into a share purchase agreement with the State Unitary Enterprise of the Chukotka Autonomous Okrug, whereby it held 100% of the Kupol mine and exploration licenses. Kinross sold its interest in the Crixás mine to AngloGold Ashanti in 2012.
In December 2017, Kinross acquired mineral rights to Gilmore, or Parcel G, a 709-acre tract adjacent to its Fort Knox Gold Mine, about 25 miles northeast of Fairbanks, Alaska. Estimates of the land valued it as containing 2.1 million ounces of gold.
In December 2021, Kinross offered to acquire Great Bear Resources for $29 per share, or about $1.8 billion, giving it ownership of a gold mining prospect in Red Lake, Ontario, Canada. Kinross shares dropped 9% after it announced the buyout bid. The deal to acquire Great Bear closed on February 24, 2022.
Non-operating, discontinued and divested mines
Julietta Mine is a gold and silver mine located in the Omsukchansky District of Magadan Oblast, near Russia's far eastern border.
Kettle River-Buckhorn - the Washington-state based mine and mill were acquired by Kinross in 2006, and was closed in 2017.
Mineral Hill - located on the east side of Crevice Mountain, Montana, Mineral Hill operated from 1990 to 1996. In 2017, Kinross donated water rights representing 3 billion gallons of water to Trout Unlimited to protect fish habitat in tributaries of the Yellowstone River.
Cerro Casale - Chile-based mine acquired by Kinross in 2007. As of 2015, the mine was inactive, and Kinross divested in 2017.
Crixás - Kinross sold its 50% interest in the Brazil-based mine to AngloGold Ashanti for $220 million.
Fruta del Norte - Kinross purchased 100% of outstanding shares in the Ecuadorian deposit in 2008, but ceased development in 2013, and sold the rights in 2014.
La Coipa - Kinross incurred an impairment charge of $124 million in 2014 after development on the Chile-based mine ceased. In February 2020, Kinross announced it was proceeding with the La Coipa Restart project to mine the Phase 7 deposit, expected to operate from 2022 to 2024.
Lobo-Marte - After acquiring 40% interest in the Chile mine in 2008, Kinross acquired the remaining interest in 2009, for a total cost of $182 million. The results of a pre-feasibility study at Lobo-Marte was announced in July 2020. Subject to development decision, project construction will begin in 2025, with production expected in 2027.
Maricunga - Operations ceased in August 2016, after the Chilean government shut off the mine's water supply over environmental concerns. As a result, 300 employees were laid off, and Kinross incurred an impairment charge of $68 million.
Dvoinoye Gold Mine & Kupol Gold Mine - The Dvoinoye and Kupol gold mines are located in Russia approximately 100 kilometres (60 mi) apart; Dvoinoye is an underground mine, while Kupol is a combination of open-pit and underground. Acquired in 2010 and opened in 2013, Dvionoye/Kupol was one of Kinross' most profitable segments. In April 2022, Kinross announced that it was selling 100% of its Russian assets to the Highland Gold Mining, completing the sale of Russian assets two months later.
Financial performance
Gold production
Annual gold production (thousands of ounces) was:
2013 - 2,631
2014 - 2,710
2015 - 2,594
2016 - 2,789
2017 - 2,673
2018 - 2,450
2019 - 2,507
2020 - 2,366
2021 - 2,063
Gold reserves
Kinross' proven and probable gold reserves were 32.6 million ounces as of December 31, 2021.
Assets
Kinross Gold's total assets decreased significantly in recent years, from $US 16.39 billion in 2010 to $US 7.73 billion in 2015.
Other
Kinross suspended dividend payments in 2013. It started paying again in 2020, and that year, also announced a share buyback program.
In 2015 in the wake of declining gold prices, Kinross closed their office in Denver and eliminated 110 corporate positions in Denver, Chile, Spain, and Toronto.
In 2016, Standard & Poor's lowered Kinross' credit rating to junk bond status, largely based on the share of their production that came from mines in Russia, which the agency saw as a significant risk.
In 2017, Moody's Investors Service assigned a Ba1 rating to Kinross, "primarily driven by the company's good scale (2.78 million gold-equivalent ounces (GEO) as of March 2017 LTM), low leverage (1.7x LTM adjusted Debt/EBITDA), and very good liquidity (SGL-1).
On March 2, 2020, Moody's announced it had upgraded Kinross's credit rating to investment grade. Their senior unsecured notes rating was upgraded to Ba1, with a stable outlook. Kinross currently holds investment grade ratings from Moody's, S&P Global Ratings, and Fitch Ratings.
Corporate responsibility
In 2015, Kinross achieved an A− ranking in Maclean's magazine's annual assessment of socially responsible companies, the highest ranking of any Canadian mining company.
For Kinross' cooperation with an environmental group in Washington state, and for five out of eight mines being in compliance with the International Cyanide Management Code (as of May 2013, the Company had eight of its nine mines in compliance with the International Cyanide Management Code), Kinross was recognized as one of Canada's Top 50 Most Responsible Corporations by Maclean's magazine and Jantzi Research in 2009.
Through a $1 million donation by Kinross in 2010, the University of Guelph created a new chair as part of its BetterPlanet Project. Said Chair is named the Kinross Chair in Environmental Governance, and is held by a "succession of experts". Also with the university, Kinross provided $100 thousand towards its Fight Against Hunger.
In 2010, Kinross committed to contribute $10 million over a three-year period towards developing a mining school in Mauritania. The following year, it committed $2.5 million to build and equip a medical emergency centre in that country.
In 2013, Kinross was named to the Dow Jones Sustainability World Index for the third consecutive year, as well as the DJSI North American Index, the Ethibel Excellence Investment Register, and the Ethical Global Equity and ECPI Global Carbon Indices. For the fifth consecutive year, the company was named to the Jantzi Social Index, and as one of Canada's Best 50 Corporate Citizens by Corporate Knights magazine for the fourth year.
In 2021, Kinross was ranked no. 22 out of 120 oil, gas, and mining companies involved in resource extraction north of the Arctic Circle in the Arctic Environmental Responsibility Index (AERI).
Carbon footprint
Kinross Gold reported Total CO2e emissions (Direct + Indirect) for the twelve months ending 31 December 2020 at 1,631 Kt (+19/+1.2% y-o-y). There have been not any significant reductions in emissions in recent years. In May 2021, Kinross committed to reaching net-zero greenhouse gas emissions by 2050.
แหล่งที่มา: Wikipedia (ภาษาอังกฤษ), CC BY-SA 4.0 · ดูบน Wikipedia ↗
ผลการดำเนินงาน 10 ปี แนวโน้มรายได้ กำไรสุทธิ อัตรากำไร และ EPS
การประเมินมูลค่า อัตราส่วน P/E, P/S, P/B, EV/EBITDA — หุ้นมีราคาแพงหรือถูก?
| ตัวชี้วัด | แนวโน้ม 5 ปี | KGC | ค่าเฉลี่ย 5 ปี | ค่ามัธยฐานของกลุ่มอุตสาหกรรม | บทสรุป |
|---|---|---|---|---|---|
| P/E | 14.4ค่าเฉลี่ย 5 ปี ≈13.9 | ≈13.9 | · | · |
ค่ามัธยฐานของกลุ่มบริษัทคำนวณตามมาตรฐานสำหรับแต่ละตัวชี้วัด และอาจไม่ตรงกับเกณฑ์ TTM/MRQ ที่แสดงสำหรับหุ้นนี้เสมอไป
ความสามารถในการทำกำไร อัตรากำไรขั้นต้น, อัตรากำไรจากการดำเนินงาน และอัตรากำไรสุทธิ; ROE, ROA, ROIC
| ตัวชี้วัด | แนวโน้ม 5 ปี | KGC | ค่าเฉลี่ย 5 ปี | ค่ามัธยฐานของกลุ่มอุตสาหกรรม | บทสรุป |
|---|---|---|---|---|---|
| ROA | 20.5%ค่าเฉลี่ย 5 ปี ≈5.9% | ≈5.9% | · | · | |
| ROE | 31.0%ค่าเฉลี่ย 5 ปี ≈9.2% | ≈9.2% | · | · | |
| ROIC | 29.5%ค่าเฉลี่ย 5 ปี ≈11.2% | ≈11.2% | · | · |
สุขภาพทางการเงิน หนี้สิน, สภาพคล่อง, ความสามารถในการชำระหนี้ — ความแข็งแกร่งของงบดุล
| ตัวชี้วัด | แนวโน้ม 5 ปี | KGC | ค่าเฉลี่ย 5 ปี | ค่ามัธยฐานของกลุ่มอุตสาหกรรม | บทสรุป |
|---|---|---|---|---|---|
| Current Ratio (อัตราส่วนสภาพคล่อง) | 2.3ค่าเฉลี่ย 5 ปี ≈2.4 | ≈2.4 | · | · | |
| Quick Ratio (อัตราส่วนเงินสด) | 0.7ค่าเฉลี่ย 5 ปี ≈0.6 | ≈0.6 | · | · | |
| Interest Coverage (ความสามารถในการจ่ายดอกเบี้ย) | 40.1ค่าเฉลี่ย 5 ปี ≈18.1 | ≈18.1 | · | · |
การเติบโต การเติบโตของรายได้, EPS และกำไรสุทธิ: YoY, CAGR 3 ปี, CAGR 5 ปี
ยังไม่มีข้อมูลพื้นฐานเพียงพอที่จะคำนวณกลุ่มอัตราส่วนนี้
ประสิทธิภาพของเงินทุน อัตราหมุนเวียนสินทรัพย์, อัตราหมุนเวียนสินค้าคงคลัง, อัตราหมุนเวียนลูกหนี้
| ตัวชี้วัด | แนวโน้ม 5 ปี | KGC | ค่าเฉลี่ย 5 ปี | ค่ามัธยฐานของกลุ่มอุตสาหกรรม | บทสรุป |
|---|---|---|---|---|---|
| Inventory Turnover (อัตราหมุนเวียนสินค้าคงคลัง) | 2.6ค่าเฉลี่ย 5 ปี ≈2.6 | ≈2.6 | · | · |
มูลค่า · ≈ ค่าเฉลี่ย 5 ปี · ค่าเฉลี่ยอุตสาหกรรม · การตัดสินใจเทียบกับค่าเฉลี่ย
เงินปันผล ผลตอบแทน, อัตราการจ่ายเงินปันผล, ประวัติเงินปันผล, CAGR 5 ปี
| วันที่ไม่ได้รับสิทธิปันผล | จำนวน | สกุลเงิน | ผลตอบแทน |
|---|---|---|---|
| ส.ค. 20, 2026 | $0.04 | USD | ≈0.48% |
| พ.ค. 21, 2026 | $0.04 | USD | ≈0.49% |
| มี.ค. 11, 2026 | $0.04 | USD | ≈0.31% |
| ส.ค. 21, 2025 | $0.03 | USD | ≈0.62% |
| พ.ค. 29, 2025 | $0.03 | USD | ≈0.82% |
| มี.ค. 5, 2025 | $0.03 | USD | ≈1.0% |
| พ.ย. 27, 2024 | $0.03 | USD | ≈1.2% |
| ส.ค. 22, 2024 | $0.03 | USD | ≈1.3% |
| พ.ค. 30, 2024 | $0.03 | USD | ≈1.5% |
| มี.ค. 5, 2024 | $0.03 | USD | ≈2.3% |
| พ.ย. 29, 2023 | $0.03 | USD | ≈2.1% |
| ส.ค. 23, 2023 | $0.03 | USD | ≈2.4% |
| พ.ค. 31, 2023 | $0.03 | USD | ≈2.5% |
| มี.ค. 7, 2023 | $0.03 | USD | ≈3.4% |
| พ.ย. 30, 2022 | $0.03 | USD | ≈2.9% |
| ส.ค. 17, 2022 | $0.03 | USD | ≈3.5% |
| มิ.ย. 1, 2022 | $0.03 | USD | ≈2.7% |
| มี.ค. 8, 2022 | $0.03 | USD | ≈2.1% |
| พ.ย. 30, 2021 | $0.03 | USD | ≈2.0% |
| ส.ค. 18, 2021 | $0.03 | USD | ≈2.6% |
ประวัติผลประกอบการ EPS จริงเทียบกับประมาณการ, เปอร์เซ็นต์ส่วนต่าง%, อัตราการชนะ, วันประกาศผลประกอบการครั้งถัดไป
| งวด | รายงาน | EPS Actual | EPS คาด | ส่วนต่าง |
|---|---|---|---|---|
| 30 มิถุนายน 2026 | $0.71 | $0.74 | -4.1% | |
| 31 มีนาคม 2026 | $0.71 | $0.67 | 5.5% | |
| 31 ธันวาคม 2025 | $0.67 | $0.60 | 11.4% | |
| 30 กันยายน 2025 | $0.44 | $0.37 | 20.2% | |
| 30 มิถุนายน 2025 | $0.44 | $0.30 | 46.2% | |
| 31 มีนาคม 2025 | $0.30 | $0.23 | 28.6% |
ปัจจัยพื้นฐานฉบับเต็ม ตัวชี้วัดทั้งหมดรายปี — งบกำไรขาดทุน, งบดุล, งบกระแสเงินสด
งบกำไรขาดทุน
| ตัวชี้วัด | แนวโน้ม | 2025 | 2024 | 2023 | 2022 | 2021 | 2020 | 2019 | 2018 | 2017 | 2016 |
|---|---|---|---|---|---|---|---|---|---|---|---|
| Cost of Revenue | $3.34B | $3.27B | $3.08B | $2.94B | $2.06B | $1.92B | $2.15B | $2.63B | $2.60B | $2.98B | |
| Gross Profit | $3.72B | $1.88B | $1.16B | $515M | $541M | $2.30B | $1.35B | $580M | $705M | $494M | |
| SG&A Expense | $140M | $126M | $109M | $130M | $114M | $118M | $136M | $133M | $133M | $144M | |
| Operating Income | $3.28B | $1.54B | $801M | $118M | $72M | $1.90B | $991M | $200M | $336M | $46M | |
| Interest Expense | $82M | $50M | $69M | $68M | $72M | $90M | $77M | $72M | $86M | $100M | |
| Interest Income | $73M | $18M | $40M | $18M | $11M | $4M | $8M | $11M | $14M | $8M | |
| Pretax Income | $3.19B | $1.48B | $709M | $107M | $84M | $1.80B | $964M | $113M | $419M | $-60M | |
| Income Tax | $725M | $487M | $293M | $76M | $115M | $440M | $247M | $139M | $-23M | $50M | |
| Net Income | $2.39B | $949M | $416M | $-605M | $221M | $1.34B | $719M | $-24M | $445M | $-104M | |
| EPS (Basic) | $1.96 | $0.77 | $0.34 | $-0.47 | $0.18 | $1.07 | $0.57 | $-0.02 | $0.36 | $-0.08 | |
| EPS (Diluted) | $1.95 | $0.77 | $0.34 | $-0.47 | $0.17 | $1.06 | $0.57 | $-0.02 | $0.35 | $-0.08 | |
| Shares (Basic) | 1,219,466,000 | 1,228,855,000 | 1,226,985,000 | 1,280,531,000 | 1,259,059,000 | 1,257,200,000 | 1,252,300,000 | 1,249,500,000 | 1,246,619,000 | 1,227,007,000 | |
| Shares (Diluted) | 1,224,607,000 | 1,234,504,000 | 1,236,670,000 | 1,292,811,000 | 1,259,059,000 | 1,268,000,000 | 1,262,300,000 | 1,249,500,000 | 1,257,045,000 | 1,227,007,000 | |
| EBITDA | $4.38B | $2.69B | $1.79B | $902M | $1.30B | $2.74B | $1.72B | $973M | $1.16B | · |
งบดุล
| ตัวชี้วัด | แนวโน้ม | 2025 | 2024 | 2023 | 2022 | 2021 | 2020 | 2019 | 2018 | 2017 | 2016 |
|---|---|---|---|---|---|---|---|---|---|---|---|
| Cash & Equivalents | $887M | $282M | $198M | $270M | $387M | $562M | $306M | $208M | $601M | $514M | |
| Receivables | $30M | $53M | $58M | $318M | $214M | $116M | $137M | $101M | $91M | $127M | |
| Inventory | $1.37B | $1.24B | $1.15B | $1.07B | $1.15B | $1.07B | $1.05B | $1.05B | $1.09B | $987M | |
| Current Assets | $3.29B | $2.13B | $1.80B | $1.85B | $1.95B | $2.45B | $1.82B | $1.60B | $2.28B | $2.08B | |
| PP&E (Net) | $8.29B | $7.97B | $7.96B | $7.74B | $7.62B | $7.65B | $6.34B | $5.52B | $4.89B | $4.92B | |
| Goodwill | · | · | · | · | $159M | $159M | $159M | $163M | $163M | $163M | |
| Total Assets | $12.41B | $10.87B | $10.54B | $10.40B | $10.43B | $10.93B | $9.08B | $8.06B | $8.16B | $7.98B | |
| Accounts Payable | $716M | $543M | $532M | $550M | $493M | $479M | $469M | $466M | $483M | $465M | |
| Current Liabilities | $1.40B | $1.06B | $686M | $752M | $741M | $1.35B | $616M | $612M | $585M | $638M | |
| Total Liabilities | $3.72B | $3.87B | $4.36B | $4.51B | $3.78B | $4.27B | $3.74B | $3.54B | $3.54B | $3.79B | |
| Retained Earnings | $-5.94B | $-8.18B | $-8.98B | $-9.25B | $-8.49B | $-8.56B | $-9.83B | $-10.55B | $-10.58B | $-11.03B | |
| Stockholders' Equity | $8.58B | $6.86B | $6.08B | $5.82B | $6.58B | $6.60B | $5.32B | $4.51B | $4.58B | $4.15B |
กระแสเงินสด
| ตัวชี้วัด | แนวโน้ม | 2025 | 2024 | 2023 | 2022 | 2021 | 2020 | 2019 | 2018 | 2017 | 2016 |
|---|---|---|---|---|---|---|---|---|---|---|---|
| D&A | $1.10B | $1.15B | $987M | $784M | $696M | $842M | $731M | $772M | $819M | $855M | |
| Other Non-cash | $265M | $350M | · | · | $73M | $-227M | $-225M | $40M | $-313M | · | |
| Operating Cash Flow | $3.76B | $2.45B | $1.61B | · | $1.14B | $1.96B | $1.22B | $789M | $952M | $1.10B | |
| CapEx | $1.19B | $1.08B | $1.10B | $764M | $822M | $916M | $1.06B | $1.04B | $898M | $634M | |
| Investing Cash Flow | · | · | · | · | $-1.19B | $-1.25B | $-1.03B | $-1.39B | $-687M | $-1.27B | |
| Financing Cash Flow | $-1.63B | $-1.01B | $-549M | · | $-623M | $-68M | $25M | $-73M | $-69M | $-48M | |
| Free Cash Flow | $2.57B | $1.37B | · | · | $197M | $1.04B | $120M | $-255M | $54M | · | |
| Levered FCF | $2.50B | $1.34B | · | · | $163M | $974M | $62M | $-238M | $-37M | · |
ความสามารถในการทำกำไร
| ตัวชี้วัด | แนวโน้ม | 2025 | 2024 | 2023 | 2022 | 2021 | 2020 | 2019 | 2018 | 2017 | 2016 |
|---|---|---|---|---|---|---|---|---|---|---|---|
| ROA | 20.5% | 8.9% | 4.0% | -5.8% | 2.1% | 13.4% | 8.4% | -0.29% | 5.5% | · | |
| ROE | 31.0% | 14.7% | 7.0% | -9.8% | 3.4% | 22.5% | 14.6% | -0.52% | 10.2% | · | |
| ROIC | 29.5% | 15.1% | 7.7% | 0.58% | 3.3% | 21.8% | 13.9% | -1.0% | 7.8% | · |
สภาพคล่องและความสามารถในการชำระหนี้
| ตัวชี้วัด | แนวโน้ม | 2025 | 2024 | 2023 | 2022 | 2021 | 2020 | 2019 | 2018 | 2017 | 2016 |
|---|---|---|---|---|---|---|---|---|---|---|---|
| Current Ratio | 2.3 | 2.0 | 2.6 | 2.5 | 2.6 | 1.8 | 3.0 | 2.6 | 3.9 | · | |
| Quick Ratio | 0.7 | 0.3 | 0.7 | 0.8 | 0.8 | 0.5 | 0.7 | 0.5 | 1.2 | · | |
| Interest Coverage | 40.1 | 30.5 | 11.6 | 1.7 | 6.5 | 21.2 | 12.9 | 2.8 | 3.9 | · |
ประสิทธิภาพ
| ตัวชี้วัด | แนวโน้ม | 2025 | 2024 | 2023 | 2022 | 2021 | 2020 | 2019 | 2018 | 2017 | 2016 |
|---|---|---|---|---|---|---|---|---|---|---|---|
| Inventory Turnover | 2.6 | 2.7 | 2.8 | 2.6 | 2.4 | 1.8 | 2.0 | 2.5 | 2.5 | · |
ต่อหุ้น
| ตัวชี้วัด | แนวโน้ม | 2025 | 2024 | 2023 | 2022 | 2021 | 2020 | 2019 | 2018 | 2017 | 2016 |
|---|---|---|---|---|---|---|---|---|---|---|---|
| Cash Flow / Share | $3.07 | $1.98 | · | · | $0.89 | $1.54 | $0.97 | $0.63 | $0.76 | · | |
| EPS (TTM) | $1.95 | $0.77 | $0.34 | $-0.47 | $0.17 | $1.06 | $0.57 | $-0.02 | $0.35 | · |
การประเมินมูลค่า (TTM)
| ตัวชี้วัด | แนวโน้ม | 2025 | 2024 | 2023 | 2022 | 2021 | 2020 | 2019 | 2018 | 2017 | 2016 |
|---|---|---|---|---|---|---|---|---|---|---|---|
| Net Income TTM | $2.39B | $949M | $416M | $-605M | $221M | $1.34B | $719M | $-24M | $445M | · | |
| P/E | 14.4 | 12.0 | 17.8 | -8.7 | 34.2 | 6.9 | 8.3 | -162.0 | 12.3 | · | |
| Earnings Yield | 6.9% | 8.3% | 5.6% | -11.5% | 2.9% | 14.4% | 12.0% | -0.62% | 8.1% | · |
ต่อหุ้น
| ตัวชี้วัด | แนวโน้ม | Q4 2016 | Q4 2015 | Q4 2014 | Q4 2013 | Q4 2012 | Q4 2011 | Q4 2010 | Q4 2009 | Q4 2008 | Q4 2007 | Q4 2006 | Q4 2005 | Q4 2004 | Q4 2003 | Q4 2002 |
|---|---|---|---|---|---|---|---|---|---|---|---|---|---|---|---|---|
| EPS (TTM) | $-0.08 | · | · | · | · | · | · | · | · | · | · | · | · | · | · |
การประเมินมูลค่า (TTM)
| ตัวชี้วัด | แนวโน้ม | Q4 2016 | Q4 2015 | Q4 2014 | Q4 2013 | Q4 2012 | Q4 2011 | Q4 2010 | Q4 2009 | Q4 2008 | Q4 2007 | Q4 2006 | Q4 2005 | Q4 2004 | Q4 2003 | Q4 2002 |
|---|---|---|---|---|---|---|---|---|---|---|---|---|---|---|---|---|
| Net Income TTM | $-104M | · | · | · | · | · | · | · | · | · | · | · | · | · | · | |
| P/E | -38.9 | · | · | · | · | · | · | · | · | · | · | · | · | · | · | |
| Earnings Yield | -2.6% | · | · | · | · | · | · | · | · | · | · | · | · | · | · |
ช่วงเวลาล่าสุดอยู่ทางซ้าย · ค่า null แสดงเป็น ·
งบการเงิน งบกำไรขาดทุน, งบดุล, งบกระแสเงินสด — รายปี, 5 ปีล่าสุด
| ตัวชี้วัด | 2025-12-31 | 2024-12-31 | 2023-12-31 | 2022-12-31 | 2021-12-31 |
|---|---|---|---|---|---|
| กำไรสุทธิ | $2.39B | $949M | $416M | $-605M | $221M |
| EPS ที่ปรับลดแล้ว | $1.95 | $0.77 | $0.34 | $-0.47 | $0.17 |
| ตัวชี้วัด | 2025-12-31 | 2024-12-31 | 2023-12-31 | 2022-12-31 | 2021-12-31 |
|---|---|---|---|---|---|
| อัตราส่วนสภาพคล่อง | 2.3 | 2.0 | 2.6 | 2.5 | 2.6 |
| อัตราส่วนเงินสด | 0.7 | 0.3 | 0.7 | 0.8 | 0.8 |
| ตัวชี้วัด | 2025-12-31 | 2024-12-31 | 2023-12-31 | 2022-12-31 | 2021-12-31 |
|---|---|---|---|---|---|
| กระแสเงินสดอิสระ | $2.57B | $1.37B | · | · | $197M |
ผู้ถือครองสถาบัน (13F) 707 รายงาน · $19.1B ทั้งหมด · ณ วันที่ 30 กันยายน 2026
สถาบันที่รายงานการถือครองหุ้นนี้ในเอกสาร SEC Form 13F รายไตรมาสของตน เฉพาะสถานะ Long; ผู้ยื่นคำร้องรายเดียวอาจปรากฏสองครั้งสำหรับสัญญาออปชันที่แยกจากกัน ขา put/call ขนาดใหญ่ที่หักล้างกันมักสะท้อนถึงการทำตลาด (market-making) หรือสินค้าคงคลังที่มีการป้องกันความเสี่ยง (hedged inventory) ไม่ใช่การเชื่อมั่นในทิศทาง
| พอร์ตใหม่ | ตำแหน่งที่ปิดไปแล้ว | เพิ่มขึ้น | ลดลง | การเปลี่ยนแปลงสุทธิของจำนวนหุ้น |
|---|---|---|---|---|
| 76 (-54 เทียบกับไตรมาสก่อน) | 90 (+31 เทียบกับไตรมาสก่อน) | 252 (+15 เทียบกับไตรมาสก่อน) | 242 (+12 เทียบกับไตรมาสก่อน) | +16.4M |
เปรียบเทียบกับ Q1 2026. การยื่นแบบฟอร์ม 13F ของ SEC จะครบกำหนดภายใน 45 วันนับจากสิ้นสุดไตรมาส บวกกับระยะเวลาผ่อนผันสั้นๆ สำหรับผู้ยื่นล่าช้า — ไตรมาสที่ยังอยู่ในช่วงเวลานี้จะถูกข้ามไปเพื่อใช้คู่ที่รายงานล่าสุดอย่างสมบูรณ์
| สถาบัน | มูลค่า | หุ้น | % ของ 13F ที่ติดตาม | ประเภท |
|---|---|---|---|---|
| VANGUARD GROUP INC | $1,433,344,952 | 50,887,386 | 7.52% | หุ้น |
| VAN ECK ASSOCIATES CORP | $1,295,586,963 | 54,855,608 | 6.80% | หุ้น |
| Boston Partners | $899,756,645 | 36,038,587 | 4.72% | หุ้น |
| VANGUARD CAPITAL MANAGEMENT LLC | $789,855,012 | 33,359,590 | 4.14% | หุ้น |
| ROYAL BANK OF CANADA | $779,032,000 | 32,981,828 | 4.09% | หุ้น |
| ARROWSTREET CAPITAL, LIMITED PARTNERSHIP | $697,850,348 | 29,515,179 | 3.66% | หุ้น |
| RENAISSANCE TECHNOLOGIES LLC | $584,529,171 | 24,747,213 | 3.07% | หุ้น |
| FIL Ltd | $490,677,660 | 20,723,752 | 2.57% | หุ้น |
| MACKENZIE FINANCIAL CORP | $436,040,296 | 12,985,119 | 2.29% | หุ้น |
| GEODE CAPITAL MANAGEMENT, LLC | $370,263,818 | 14,840,976 | 1.94% | หุ้น |
| BANK OF MONTREAL /CAN/ | $342,235,637 | 14,468,801 | 1.80% | หุ้น |
| 1832 Asset Management L.P. | $337,595,653 | 14,292,788 | 1.77% | หุ้น |
| NORGES BANK | $313,894,501 | 13,274,824 | 1.65% | หุ้น |
| MORGAN STANLEY | $306,631,520 | 12,981,858 | 1.61% | หุ้น |
| Man Group plc | $298,152,337 | 12,621,448 | 1.56% | หุ้น |
| CIBC Asset Management Inc | $275,302,096 | 11,602,154 | 1.44% | หุ้น |
| Connor, Clark & Lunn Investment Management Ltd. | $264,652,432 | 11,188,912 | 1.39% | หุ้น |
| BANK OF AMERICA CORP /DE/ | $255,636,580 | 10,822,887 | 1.34% | หุ้น |
| VANGUARD FIDUCIARY TRUST CO | $251,039,891 | 10,602,690 | 1.32% | หุ้น |
| JPMORGAN CHASE & CO | $250,490,610 | 10,533,666 | 1.31% | หุ้น |
| Legal & General Group Plc | $244,762,202 | 10,341,184 | 1.28% | หุ้น |
| NATIONAL BANK OF CANADA /FI/ | $244,381,964 | 10,328,709 | 1.28% | หุ้น |
| SCHRODER INVESTMENT MANAGEMENT GROUP | $238,085,019 | 10,079,806 | 1.25% | หุ้น |
| Allianz Asset Management GmbH | $227,141,000 | 9,596,638 | 1.19% | หุ้น |
| MANUFACTURERS LIFE INSURANCE COMPANY, THE | $222,973,542 | 9,435,939 | 1.17% | หุ้น |
| DEUTSCHE BANK AG\ | $217,800,021 | 9,221,000 | 1.14% | หุ้น |
| CANADA PENSION PLAN INVESTMENT BOARD | $217,190,177 | 9,182,216 | 1.14% | หุ้น |
| GOLDMAN SACHS GROUP INC | $215,600,711 | 9,127,887 | 1.13% | หุ้น |
| Ninety One UK Ltd | $207,995,648 | 8,614,109 | 1.09% | หุ้น |
| AQR CAPITAL MANAGEMENT LLC | $205,351,902 | 8,777,685 | 1.08% | หุ้น |
| Amundi | $197,878,133 | 8,376,494 | 1.04% | หุ้น |
| Invesco Ltd. | $188,345,194 | 7,973,971 | 0.99% | หุ้น |
| CIBC WORLD MARKET INC. | $186,048,766 | 7,864,688 | 0.98% | หุ้น |
| FMR LLC | $168,707,882 | 7,130,430 | 0.89% | หุ้น |
| AustralianSuper Pty Ltd | $166,115,355 | 7,022,910 | 0.87% | หุ้น |
| TORONTO DOMINION BANK | $156,848,972 | 6,631,151 | 0.82% | หุ้น |
| DIMENSIONAL FUND ADVISORS LP | $156,143,384 | 6,610,297 | 0.82% | หุ้น |
| TD Asset Management Inc | $155,927,792 | 6,587,926 | 0.82% | หุ้น |
| First Eagle Investment Management, LLC | $151,522,135 | 6,414,993 | 0.80% | หุ้น |
| MASSACHUSETTS FINANCIAL SERVICES CO /MA/ | $150,902,208 | 5,199,404 | 0.79% | หุ้น |
| BANK OF NOVA SCOTIA | $125,827,667 | 5,314,702 | 0.66% | หุ้น |
| Vanguard Global Advisers, LLC | $121,079,963 | 5,113,822 | 0.64% | หุ้น |
| AMERICAN CENTURY COMPANIES INC | $118,689,383 | 5,020,395 | 0.62% | หุ้น |
| UBS Group AG | $116,009,631 | 4,911,500 | 0.61% | หุ้น |
| TWO SIGMA INVESTMENTS, LP | $92,890,799 | 3,932,718 | 0.49% | หุ้น |
| Swiss National Bank | $91,377,497 | 3,870,618 | 0.48% | หุ้น |
| JANE STREET GROUP, LLC | $87,359,728 | 3,698,549 | 0.46% | หุ้น |
| CI INVESTMENTS INC. | $84,137,581 | 3,562,133 | 0.44% | หุ้น |
| BlackRock, Inc. | $83,289,851 | 3,526,243 | 0.44% | หุ้น |
| Cape Ann Asset Management Ltd | $82,913,617 | 3,510,314 | 0.44% | หุ้น |
นักเคลื่อนไหวและเจ้าของ %+ 5 17 รายการ
นักลงทุนที่ยื่น SEC Schedule 13D — กรรมสิทธิ์ตามผลประโยชน์ที่แท้จริงสูงกว่า % 5 โดยมีเจตนาที่จะมีอิทธิพลต่อผู้ออกหลักทรัพย์ (การถือหุ้นของนักเคลื่อนไหว, การรณรงค์ในคณะกรรมการ, M&A) แต่ละแถวแสดงสถานะล่าสุดที่ทราบของตำแหน่งของผู้ยื่นคำร้องรายนั้น
| ผู้ยื่นคำร้อง | ยื่นแล้ว | ส่วนได้เสีย | สถานะ | วัตถุประสงค์ | การยื่นคำร้อง |
|---|---|---|---|---|---|
| Kinross Gold Corporation ×5 เอกสารยื่นคำร้อง | 30 มีนาคม 2011 | · | การยื่นคำร้องครั้งแรก | · | SEC |
| ผู้รายงานที่ไม่ได้เปิดเผย | 14 เมษายน 2006 | · | การยื่นคำร้องครั้งแรก | M&A / การขาย | SEC |
| ผู้รายงานที่ไม่ได้เปิดเผย | 28 พฤศจิกายน 2005 | · | การยื่นคำร้องครั้งแรก | การลงทุนแบบพาสซีฟ | SEC |
| ผู้รายงานที่ไม่ได้เปิดเผย | 26 ตุลาคม 2004 | · | การยื่นคำร้องครั้งแรก | · | SEC |
| ผู้รายงานที่ไม่ได้เปิดเผย | 30 สิงหาคม 2004 | · | การยื่นคำร้องครั้งแรก | · | SEC |
| ผู้รายงานที่ไม่ได้เปิดเผย | 5 สิงหาคม 2004 | · | การยื่นคำร้องครั้งแรก | · | SEC |
| ผู้รายงานที่ไม่ได้เปิดเผย | 7 มิถุนายน 2004 | · | การยื่นคำร้องครั้งแรก | · | SEC |
| ผู้รายงานที่ไม่ได้เปิดเผย | 30 เมษายน 2004 | · | การยื่นคำร้องครั้งแรก | การลงทุนแบบพาสซีฟ | SEC |
| ผู้รายงานที่ไม่ได้เปิดเผย | 31 ธันวาคม 2003 | · | การยื่นคำร้องครั้งแรก | · | SEC |
| ผู้รายงานที่ไม่ได้เปิดเผย, ผู้รายงานที่ไม่ได้เปิดเผย, ผู้รายงานที่ไม่ได้เปิดเผย | 19 กันยายน 2003 | · | การยื่นคำร้องครั้งแรก | · | SEC |
| ผู้รายงานที่ไม่ได้เปิดเผย, ผู้รายงานที่ไม่ได้เปิดเผย, ผู้รายงานที่ไม่ได้เปิดเผย | 16 กันยายน 2003 | · | การยื่นคำร้องครั้งแรก | · | SEC |
| ผู้รายงานที่ไม่ได้เปิดเผย, ผู้รายงานที่ไม่ได้เปิดเผย, ผู้รายงานที่ไม่ได้เปิดเผย | 6 สิงหาคม 2003 | · | การยื่นคำร้องครั้งแรก | · | SEC |
| ผู้รายงานที่ไม่ได้เปิดเผย, ผู้รายงานที่ไม่ได้เปิดเผย, ผู้รายงานที่ไม่ได้เปิดเผย | 10 กุมภาพันธ์ 2003 | · | การยื่นคำร้องครั้งแรก | การลงทุนแบบพาสซีฟ | SEC |
| ผู้รายงานที่ไม่ได้เปิดเผย | 26 เมษายน 2002 | · | การยื่นคำร้องครั้งแรก | · | SEC |
| ผู้รายงานที่ไม่ได้เปิดเผย | 9 เมษายน 2002 | · | การยื่นคำร้องครั้งแรก | การรณรงค์ในคณะกรรมการ | SEC |
| ผู้รายงานที่ไม่ได้เปิดเผย | 14 กันยายน 2001 | · | การยื่นคำร้องครั้งแรก | การรณรงค์ในคณะกรรมการ | SEC |
| ผู้รายงานที่ไม่ได้เปิดเผย | 20 กรกฎาคม 2001 | · | การยื่นคำร้องครั้งแรก | · | SEC |
Purpose is an automated classification of the filer's own stated purpose (SEC Item 4) — not investment advice. "—" means no clear purpose was stated or the text could not be classified.
การถือครอง ETF ถือโดย ETF 27 ราย
น้ำหนักสะท้อนถึงการถือครองหุ้นโดยตรง (N-PORT) เท่านั้น กองทุนเลเวอเรจหรือกองทุนที่อิงตราสารอนุพันธ์อาจมีการเปิดรับความเสี่ยงจากสัญญาแลกเปลี่ยน (swap) เพิ่มเติมซึ่งไม่แสดง
| กองทุน | น้ำหนัก | หน่วย | ณ วันที่ | แหล่งที่มา |
|---|---|---|---|---|
| MGNR · AMERICAN BEACON SELECT FUNDS | 2.76% | 1,006,954 NS | 31 กรกฎาคม 2026 | N-PORT |
| ABLD · Abacus FCF ETF Trust | 2.32% | 92,972 NS | 31 กรกฎาคม 2026 | N-PORT |
| NRES · DBX ETF Trust | 2.02% | 24,738 NS | 31 สิงหาคม 2026 | N-PORT |
| ABLG · Abacus FCF ETF Trust | 1.60% | 11,196 NS | 31 กรกฎาคม 2026 | N-PORT |
| ICOW · Pacer Funds Trust | 1.17% | 918,496 NS | 31 กรกฎาคม 2026 | N-PORT |
| DARP · Tidal Trust II | 1.08% | 15,535 NS | 31 กรกฎาคม 2026 | N-PORT |
| BBCA · J.P. Morgan Exchange-Traded Fund Tr… | 0.90% | 4,249,615 NS | 31 กรกฎาคม 2026 | N-PORT |
| IGE · iShares Trust | 0.84% | 232,961 SH | 11 กันยายน 2026 | รายวัน |
| GUNR · FlexShares Trust | 0.67% | 2,111,502 NS | 31 กรกฎาคม 2026 | N-PORT |
| FEDM · FlexShares Trust | 0.56% | 19,257 NS | 31 กรกฎาคม 2026 | N-PORT |
| DIHP · Dimensional ETF Trust | 0.52% | 1,435,670 NS | 31 กรกฎาคม 2026 | N-PORT |
| PIEL · Pacer Funds Trust | 0.37% | 184 NS | 31 กรกฎาคม 2026 | N-PORT |
| WLDR · Two Roads Shared Trust | 0.26% | 10,431 NS | 31 กรกฎาคม 2026 | N-PORT |
| FTLS · First Trust Exchange-Traded Fund III | 0.26% | 276,036 NS | 31 กรกฎาคม 2026 | N-PORT |
| DXIV · Dimensional ETF Trust | 0.21% | 18,797 NS | 31 กรกฎาคม 2026 | N-PORT |
| DFAX · Dimensional ETF Trust | 0.19% | 994,129 NS | 31 กรกฎาคม 2026 | N-PORT |
| DFIC · Dimensional ETF Trust | 0.19% | 1,201,837 NS | 31 กรกฎาคม 2026 | N-PORT |
| FDEV · Fidelity Covington Trust | 0.17% | 21,233 NS | 31 กรกฎาคม 2026 | N-PORT |
| SPWO · SP Funds Trust | 0.14% | 12,250 NS | 31 กรกฎาคม 2026 | N-PORT |
| DFSI · Dimensional ETF Trust | 0.13% | 62,862 NS | 31 กรกฎาคม 2026 | N-PORT |
| DFAI · Dimensional ETF Trust | 0.13% | 947,691 NS | 31 กรกฎาคม 2026 | N-PORT |
| BKIE · BNY Mellon ETF Trust | 0.11% | 60,474 NS | 31 กรกฎาคม 2026 | N-PORT |
| DEEF · DBX ETF Trust | 0.10% | 1,928 NS | 31 สิงหาคม 2026 | N-PORT |
| TLTD · FlexShares Trust | 0.09% | 25,410 NS | 31 กรกฎาคม 2026 | N-PORT |
| GLBL · Pacer Funds Trust | 0.07% | 32 NS | 31 กรกฎาคม 2026 | N-PORT |
| KOKU · DBX ETF Trust | 0.04% | 10,902 NS | 31 สิงหาคม 2026 | N-PORT |
| DFIV · Dimensional ETF Trust | 0.01% | 85,829 NS | 31 กรกฎาคม 2026 | N-PORT |
KGC ความเห็นหลายต่อหลายของนักวิเคราะห์ มุมมองนักวิเคราะห์ทั้งเชิงบวกและเชิงลบ, ราคาเป้าหมาย 12 เดือน, อัพไซด์
ราคาเป้าหมาย 12 เดือน
10 นักวิเคราะห์ · 2026-10-25ราคาเป้าหมายค่าเฉลี่ย $31.00 +38.8%
ข่าวล่าสุด หัวข้อข่าวล่าสุดที่กล่าวถึงบริษัทนี้
ตัวชี้วัดของฉัน รายการเฝ้าดูส่วนตัวของคุณ — แถวที่เลือกจากข้อมูลพื้นฐานฉบับเต็ม
เลือกตัวชี้วัดที่สำคัญสำหรับคุณ — คลิกเครื่องหมาย + ถัดจากแถวใดก็ได้ใน Fundamentals ฉบับเต็มด้านบน
การเลือกของคุณถูกบันทึกและจะติดตามคุณไปในทุกสัญลักษณ์หุ้น