
VLRS Controladora Vuela Compania de Aviacion, S.A.B. de C.V. American Depositary Shares, each representing ten (10) Ordinary Participation Certificates
NYSE · Airlines · ดูใน SEC EDGAR ↗ ปิด ต.ค. 2, 2026 10-K/10-Q เม.ย. 28, 2026VLRS ภาพรวมหุ้น ราคา, มูลค่าหลักทรัพย์ตามราคาตลาด, P/E, EPS, ROE, อัตราส่วนหนี้สินต่อทุน, ช่วงราคา 52 สัปดาห์
VLRS กราฟราคาหุ้น OHLCV รายวันพร้อมตัวชี้วัดทางเทคนิค — แพน ซูม และปรับแต่งมุมมองของคุณ
ความละเอียดของแท่งเทียนจะปรับตามช่วงเวลาที่เลือก — เลื่อนเมาส์เหนือแผนภูมิเพื่อดูราคาเปิด/สูงสุด/ต่ำสุด/ปิดของแท่งเทียน
เกี่ยวกับ Controladora Vuela Compania de Aviacion, S.A.B. de C.V. American Depositary Shares, each representing ten (10) Ordinary Participation Certificates ภาพรวมบริษัทจาก Wikipedia
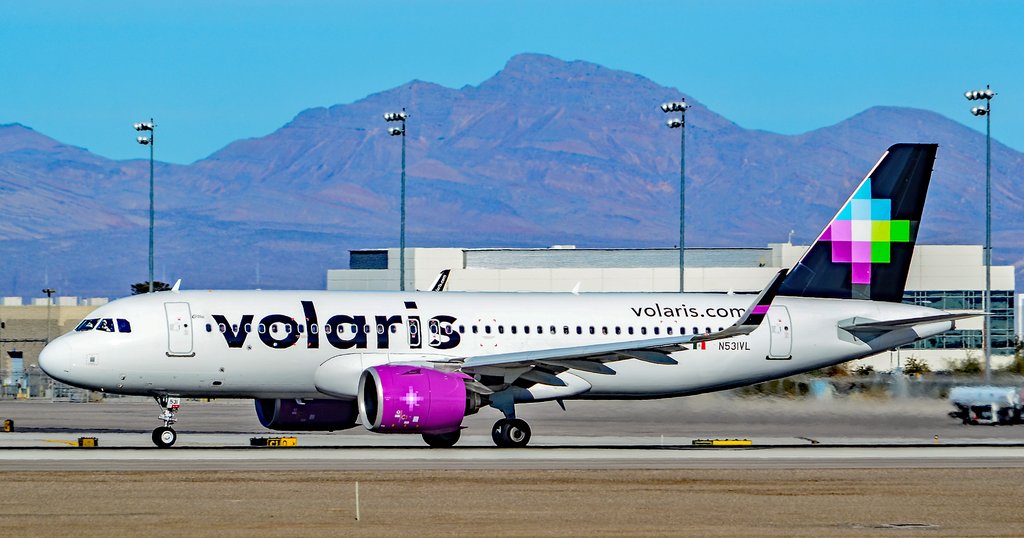
Concesionaria Vuela Compañía de Aviación S.A.B. de C.V., operating as Volaris, is a Mexican ultra low-cost airline based in Santa Fe, Álvaro Obregón, Mexico City, with its operating bases in Cancún, Culiacán, Guadalajara, León/Del Bajío, Mexicali, Mexico City, Monterrey, and Tijuana. It is Mexico's largest airline by transported passengers and serves domestic and international destinations within the Americas. It is the leading airline in the Mexican domestic airline market with a market share of 42%.
History
The pre-operations phase, the founding of the legal entities and setting up of the required infrastructure, started in August 2005 under the name Vuela Airlines. The idea for the airline was formed from the proposed "Vuelamex" project. Major initial shareholders of the company were Grupo Televisa (the world's biggest Spanish-language media conglomerate), Inbursa (an insurance company owned by multi-billionaire Carlos Slim), TACA Airlines, and the Discovery Americas Fund. Each of these partners invested 25% of the initial cost of activities, or 100 million USD.
In July 2010, it was announced that Televisa and Inbursa had sold their stake in Volaris, leaving the ownership of Volaris as follows: TACA Airlines with Roberto and Maria Cristina Kriete (50%), Investment fund Discovery Americas (over 25%), and Indigo Partners: Fund led by former America West CEO Bill Franke.
Ticket sales started in January 2006. Following the delivery of the airline's first aircraft, the first non-commercial flight was operated in February 2006. Scheduled revenue flights were launched on March 13, 2006, with the inaugural flight being between Toluca and Tijuana.
Volaris began service to Mexico City in September 2010 after absorbing flight routes from two defunct Mexican airlines, Aerocalifornia and Mexicana. In March 2011, the airline announced that its hub in Toluca would move to Guadalajara.
In June 2012, the airline launched a frequent flyer program called VClub. In June 2012, PayPal became a payment alternative for the airline, enabling customers to purchase tickets directly from the airline's website. In September 2012, Volaris announced a codeshare partnership with a German airline, Condor. Passengers of Condor are able to fly to more international destinations.
On March 13, 2013, the airline celebrated its seventh anniversary, offering passengers 70% off all flights, and has done this every year since then. Volaris announced the creation of a subsidiary, Volaris Costa Rica, in March 2016. The subsidiary, based at Juan Santamaría International Airport in the Costa Rican capital of San José, started operations in November 2016.
As of 2022, Volaris has faced multiple class-action lawsuits due to failure to properly refund flights canceled due to the COVID-19 pandemic.
In December 2025, Volaris and competitor Viva have signed an agreement to form a holding company, creating the largest low-cost airline group in Mexico. The deal aims to lower fleet costs, while both airlines would maintain their brands.
In 2025, Mexico's Federal Civil Aviation Agency (AFAC) authorized Volaris to operate 10 aircraft with foreign pilots between December 1, 2025, and January 12, 2026; the Association of Airline Pilots of Mexico (ASPA) claim the decision breaches Mexico's Constitution and Civil Aviation Law.
International operations
In November 2008, Volaris announced a codeshare agreement with U.S.-based low-cost carrier Southwest Airlines. In April 2009, Volaris announced the start of U.S.-bound flights out of Toluca and Guadalajara (initially to Los Angeles and Oakland) to feed into the hubs of Southwest Airlines. After Mexicana de Aviación's shutdown, Volaris took over many of Mexicana's international destinations and flights from its focus city, Guadalajara. The airline began using Guadalajara International Airport as an American gateway hub in late 2011.
In February 2013, Volaris and Southwest stopped codesharing. Southwest decided to focus more on the Mexican market with AirTran Airways, instead of codesharing with Volaris. In January 2018, Volaris announced a codeshare agreement with American low-cost carrier Frontier Airlines.
In June 2018, after Donald Trump signed an order ending the family separation policy, Volaris announced that they would offer free flights for children to reunite with family members who had been deported.
Corporate affairs
Business trends
The key trends for Volaris are (as of the financial year ending 31 December):
Headquarters
The airline is headquartered in Santa Fe, Álvaro Obregón, Mexico City. It formerly had its headquarters on the first floor of Prolongación Paseo de la Reforma 490 in Peña Blanca, Santa Fe.
Services
Volaris cabins are configured in a single class, high density layout.
Volaris does not provide complimentary meals or drinks on its flights. Passengers may purchase items on board from the "Entre nubes" buy on board program. Onboard sales are an important part of the airline's ancillary revenue. Items such as snacks, pillows, blankets and Volaris-branded items are sold on board. Volaris' monthly inflight magazine is called "V de Volaris".
The airline had previously provided in-flight entertainment (IFE) in most aircraft, utilizing drop-down screens on its Airbus aircraft. By 2019, all use of IFE had been discontinued.
Frequent flyer program
VClub is Volaris' frequent flyer program. It gives members exclusive deals on flights, baggage and packages. The airline offers individual and group memberships, with the option to pay monthly or annually. Volaris offers VPass, similar to Spirit's "$9 Fare Club". It offers a set subscription price, and charges customers only for taxes and additional services. Customers can book codeshare flights and earn points through fellow ultra-low-cost carrier, Frontier Airlines.
Corporate identity
Brand image
The Volaris logo, since its launch in 2005, has been a colorful, pixelated star against a black background. It represents the north star, Polaris, from which the airline's name is derived.
Advertising slogans
Volaris has used several slogans over the years:
2005–2008 – "Lo quieres, lo tienes" (You want it, you got it.)
2008–2012 – "Vive viajando" (Live travelling)
2013–2017 – "Tu decides" (You decide). Launched after the introduction of the "clean fare", which no longer included the cost of food, baggage, or seat selection in the airline's ticket prices.
2015 – "Queremos que todo el mundo vuele" (We want the whole world to fly)
2015–present – "Precios que te hacen viajar" (Prices that make you travel)
2016 – "Avión a precio de camión" (The plane at the price of a bus)
November 2018–present – "Don't just fly, vuela"
Destinations
Volaris operates scheduled flights to Mexico and elsewhere in the Americas from its hubs at Guadalajara International Airport in Guadalajara, Mexico City International Airport in Mexico City, and Tijuana International Airport in Tijuana. Focus cities include Cancún International Airport in Cancún, Bajío International Airport in León, and Monterrey International Airport in Monterrey.
Operating bases
Volaris operates crew bases at the following airports:
Cancún
Culiacán
Guadalajara
León/Del Bajío
Mexico City
Monterrey
Morelia
Tijuana
Codeshare agreements
Volaris codeshares with the following airlines:
Copa Airlines
Frontier Airlines
Hainan Airlines
Iberia
Turkish Airlines
Interline agreements
Condor
Fleet
Current fleet
As of October 2025, Volaris operates an all-Airbus A320 family fleet composed of the following aircraft:
Fleet development
Volaris became the first North American operator of the Airbus A320neo aircraft in September 2016.
In November 2017, during the Dubai Airshow, Indigo Partners announced an order for 430 aircraft of the Airbus A320neo family of which 80 will be for Volaris as follows: 46 Airbus A320neo aircraft and 34 Airbus A321neo aircraft.
In November 2021 during the Dubai Airshow, Volaris announced an order for 39 Airbus A321neo. An existing order for 20 Airbus A320neo aircraft was converted into A321neo.
On June 20, 2023, during the Paris Air Show, Volaris announced an order for 25 Airbus A321neo aircraft.
Incidents
On 8 December 2024, a passenger tried to enter the cockpit of a Volaris aircraft flying from Leon to Tijuana, forcing its diversion to Guadalajara, where the passenger was arrested after having been previously subdued by other passengers. The suspect said that he wanted to divert the aircraft to the United States after receiving a death threat from drug cartels.
แหล่งที่มา: Wikipedia (ภาษาอังกฤษ), CC BY-SA 4.0 · ดูบน Wikipedia ↗
ผลการดำเนินงาน 10 ปี แนวโน้มรายได้ กำไรสุทธิ อัตรากำไร และ EPS
การประเมินมูลค่า อัตราส่วน P/E, P/S, P/B, EV/EBITDA — หุ้นมีราคาแพงหรือถูก?
| ตัวชี้วัด | แนวโน้ม 5 ปี | VLRS | ค่าเฉลี่ย 5 ปี | ค่ามัธยฐานของกลุ่มอุตสาหกรรม | บทสรุป |
|---|---|---|---|---|---|
| P/E | -98.7ค่าเฉลี่ย 5 ปี ≈277.3 | ≈277.3 | · | · |
ค่ามัธยฐานของกลุ่มบริษัทคำนวณตามมาตรฐานสำหรับแต่ละตัวชี้วัด และอาจไม่ตรงกับเกณฑ์ TTM/MRQ ที่แสดงสำหรับหุ้นนี้เสมอไป
ความสามารถในการทำกำไร อัตรากำไรขั้นต้น, อัตรากำไรจากการดำเนินงาน และอัตรากำไรสุทธิ; ROE, ROA, ROIC
| ตัวชี้วัด | แนวโน้ม 5 ปี | VLRS | ค่าเฉลี่ย 5 ปี | ค่ามัธยฐานของกลุ่มอุตสาหกรรม | บทสรุป |
|---|---|---|---|---|---|
| ROA | -1.8%ค่าเฉลี่ย 5 ปี ≈0.31% | ≈0.31% | · | · | |
| ROE | -33.1%ค่าเฉลี่ย 5 ปี ≈5.6% | ≈5.6% | · | · | |
| ROIC | 45.0%ค่าเฉลี่ย 5 ปี ≈65.8% | ≈65.8% | · | · |
สุขภาพทางการเงิน หนี้สิน, สภาพคล่อง, ความสามารถในการชำระหนี้ — ความแข็งแกร่งของงบดุล
| ตัวชี้วัด | แนวโน้ม 5 ปี | VLRS | ค่าเฉลี่ย 5 ปี | ค่ามัธยฐานของกลุ่มอุตสาหกรรม | บทสรุป |
|---|---|---|---|---|---|
| Current Ratio (อัตราส่วนสภาพคล่อง) | 0.7ค่าเฉลี่ย 5 ปี ≈0.8 | ≈0.8 | · | · | |
| Quick Ratio (อัตราส่วนเงินสด) | 0.4ค่าเฉลี่ย 5 ปี ≈0.5 | ≈0.5 | · | · | |
| Interest Coverage (ความสามารถในการจ่ายดอกเบี้ย) | 0.4ค่าเฉลี่ย 5 ปี ≈1.2 | ≈1.2 | · | · |
การเติบโต การเติบโตของรายได้, EPS และกำไรสุทธิ: YoY, CAGR 3 ปี, CAGR 5 ปี
ยังไม่มีข้อมูลพื้นฐานเพียงพอที่จะคำนวณกลุ่มอัตราส่วนนี้
ประสิทธิภาพของเงินทุน อัตราหมุนเวียนสินทรัพย์, อัตราหมุนเวียนสินค้าคงคลัง, อัตราหมุนเวียนลูกหนี้
ยังไม่มีข้อมูลพื้นฐานเพียงพอที่จะคำนวณกลุ่มอัตราส่วนนี้
มูลค่า · ≈ ค่าเฉลี่ย 5 ปี · ค่าเฉลี่ยอุตสาหกรรม · การตัดสินใจเทียบกับค่าเฉลี่ย
ประวัติผลประกอบการ EPS จริงเทียบกับประมาณการ, เปอร์เซ็นต์ส่วนต่าง%, อัตราการชนะ, วันประกาศผลประกอบการครั้งถัดไป
| งวด | รายงาน | EPS Actual | EPS คาด | ส่วนต่าง |
|---|---|---|---|---|
| 30 มิถุนายน 2026 | $-0.11 | $-0.13 | 15.9% | |
| 31 มีนาคม 2026 | $-0.06 | $-0.08 | 27.7% | |
| 31 ธันวาคม 2025 | $0.00 | $0.02 | -81.0% | |
| 30 กันยายน 2025 | $0.01 | $-0.00 | — | |
| 30 มิถุนายน 2025 | $-0.05 | $-0.08 | 30.1% | |
| 31 มีนาคม 2025 | $0.00 | $0.02 | -81.0% |
ปัจจัยพื้นฐานฉบับเต็ม ตัวชี้วัดทั้งหมดรายปี — งบกำไรขาดทุน, งบดุล, งบกระแสเงินสด
งบกำไรขาดทุน
| ตัวชี้วัด | แนวโน้ม | 2025 | 2024 | 2023 | 2022 | 2021 | 2020 | 2019 | 2018 | 2017 | 2016 |
|---|---|---|---|---|---|---|---|---|---|---|---|
| Operating Income | $135M | $413M | $223M | $44M | $397M | $-134M | $4.36B | $535M | $1.24B | $2.70B | |
| Interest Expense | $314M | $294M | $219M | $193M | $139M | $138M | $2.27B | $1.88B | $1.52B | $35M | |
| Interest Income | $48M | $49M | $38M | $13M | $4M | $5M | $208M | $153M | $106M | $103M | |
| Pretax Income | $-118M | $183M | $7M | $-132M | $137M | $-253M | $3.73B | $-1.29B | $516M | $4.94B | |
| Income Tax | $-14M | $56M | $-377.0K | $-52M | $31M | $-62M | $1.09B | $-350M | $238M | $1.46B | |
| Net Income | $-104M | $126M | $8M | $-80M | $106M | $-192M | $2.64B | $-943M | $279M | $3.48B | |
| EPS (Basic) | $-0.09 | $0.11 | $0.01 | $-0.07 | $0.09 | $-0.19 | $2.61 | $-0.93 | $0.28 | $3.44 | |
| EPS (Diluted) | $-0.09 | $0.11 | $0.01 | $-0.07 | $0.09 | $-0.19 | $2.61 | $-0.93 | $0.28 | $3.44 | |
| Shares (Basic) | 1,149,208,000 | 1,150,743,000 | 1,152,609,000 | 1,155,030,000 | 1,152,256,000 | 1,004,965,000 | 1,011,877,000 | 1,011,877,000 | 1,011,877,000 | 1,011,877,000 | |
| Shares (Diluted) | 1,149,208,000 | 1,165,859,000 | 1,165,451,000 | 1,165,135,000 | 1,165,612,000 | 1,021,286,000 | 1,011,877,000 | 1,011,877,000 | 1,011,877,000 | 1,011,877,000 | |
| EBITDA | $343M | $596M | $357M | $141M | $448M | $-2.36B | $5.03B | $-380M | $567M | · |
งบดุล
| ตัวชี้วัด | แนวโน้ม | 2025 | 2024 | 2023 | 2022 | 2021 | 2020 | 2019 | 2018 | 2017 | 2016 |
|---|---|---|---|---|---|---|---|---|---|---|---|
| Cash & Equivalents | $754M | $908M | $774M | $712M | $741M | $506M | $7.98B | $423M | $6.95B | $7.07B | |
| Inventory | $17M | $17M | $16M | $16M | $14M | $279M | $302M | $297M | $295M | $244M | |
| Current Assets | $1.39B | $1.38B | $1.25B | $1.07B | $979M | $14.40B | $12.12B | $8.92B | $11.05B | $11.55B | |
| PP&E (Net) | $948M | $1.07B | $805M | $479M | $455M | $365M | $7.39B | $5.78B | $5.78B | $2.53B | |
| Intangibles | $38M | $26M | $16M | $13M | $13M | $192M | $167M | $179M | $190M | $114M | |
| Total Assets | $5.64B | $5.70B | $5.15B | $4.47B | $3.98B | $68.19B | $63.30B | $56.72B | $49.95B | $21.78B | |
| Current Liabilities | $1.92B | $1.77B | $1.62B | $1.42B | $1.25B | $20.97B | $17.32B | $14.08B | $13.56B | $7.96B | |
| Total Liabilities | $5.37B | $5.34B | $4.90B | $4.23B | $3.67B | $65.39B | $57.77B | $54.02B | $46.13B | $11.06B | |
| Retained Earnings | $-126M | $-22M | $-148M | $-156M | $-76M | $-3.86B | $438M | $-2.20B | $-1.26B | $5.85B | |
| Stockholders' Equity | $264M | $365M | $243M | $235M | $313M | $140M | $293M | $2.71B | $3.83B | $3.58B |
กระแสเงินสด
| ตัวชี้วัด | แนวโน้ม | 2025 | 2024 | 2023 | 2022 | 2021 | 2020 | 2019 | 2018 | 2017 | 2016 |
|---|---|---|---|---|---|---|---|---|---|---|---|
| D&A | $208M | $183M | $134M | $97M | $57M | $42M | $676M | $501M | $549M | $537M | |
| Other Non-cash | $646M | $780M | $588M | $596M | $612M | $7.75B | $6.20B | $748M | $1.03B | · | |
| Operating Cash Flow | $750M | $1.09B | $730M | $614M | $785M | $214M | $9.51B | $6.28B | $6.02B | $979M | |
| CapEx | $292M | $583M | $481M | $347M | $186M | $157M | $3.48B | $2.74B | $2.52B | $2.20B | |
| Investing Cash Flow | $-89M | $-473M | $-462M | $-131M | $-135M | $-3M | $-1.88B | $-1.39B | $-2.26B | $-28M | |
| Financing Cash Flow | $-819M | $-472M | $-214M | $-513M | $-435M | $-130M | $-5.24B | $-5.95B | $-3.63B | $11M | |
| Free Cash Flow | $458M | $507M | $249M | $266M | $588M | $983M | $6.03B | $-2.18B | $-1.54B | · | |
| Levered FCF | $182M | $304M | $19M | $150M | $480M | $-1.29B | $4.42B | $-2.27B | $-1.60B | · |
ความสามารถในการทำกำไร
| ตัวชี้วัด | แนวโน้ม | 2025 | 2024 | 2023 | 2022 | 2021 | 2020 | 2019 | 2018 | 2017 | 2016 |
|---|---|---|---|---|---|---|---|---|---|---|---|
| ROA | -1.8% | 2.3% | 0.16% | -1.9% | 2.8% | -6.5% | 4.4% | -1.9% | -2.7% | · | |
| ROE | -33.1% | 41.6% | 3.3% | -29.3% | 45.5% | -277.9% | 64.1% | -10.5% | -8.6% | · | |
| ROIC | 45.0% | 78.3% | 96.5% | 11.3% | 97.8% | -87.6% | 55.7% | -7.1% | 0.14% | · |
สภาพคล่องและความสามารถในการชำระหนี้
| ตัวชี้วัด | แนวโน้ม | 2025 | 2024 | 2023 | 2022 | 2021 | 2020 | 2019 | 2018 | 2017 | 2016 |
|---|---|---|---|---|---|---|---|---|---|---|---|
| Current Ratio | 0.7 | 0.8 | 0.8 | 0.8 | 0.8 | 0.7 | 0.7 | 1.0 | 1.2 | · | |
| Quick Ratio | 0.4 | 0.5 | 0.5 | 0.5 | 0.6 | 0.5 | 0.5 | 0.6 | 0.7 | · | |
| Interest Coverage | 0.4 | 1.4 | 1.0 | 0.2 | 2.8 | -1.1 | 1.9 | -7.3 | 0.2 | · |
ต่อหุ้น
| ตัวชี้วัด | แนวโน้ม | 2025 | 2024 | 2023 | 2022 | 2021 | 2020 | 2019 | 2018 | 2017 | 2016 |
|---|---|---|---|---|---|---|---|---|---|---|---|
| Cash Flow / Share | $0.65 | $0.93 | $0.63 | $0.53 | $0.66 | $4.27 | $9.40 | $0.56 | $0.97 | · | |
| EPS (TTM) | $-0.09 | $0.11 | $0.01 | $-0.07 | $0.09 | $-0.19 | $2.61 | $-0.93 | $0.28 | · |
การประเมินมูลค่า (TTM)
| ตัวชี้วัด | แนวโน้ม | 2025 | 2024 | 2023 | 2022 | 2021 | 2020 | 2019 | 2018 | 2017 | 2016 |
|---|---|---|---|---|---|---|---|---|---|---|---|
| Net Income TTM | $-104M | $126M | $8M | $-80M | $106M | $-192M | $2.64B | $-943M | $279M | · | |
| P/E | -98.7 | 68.9 | 1340.0 | -121.2 | 197.5 | -66.1 | 4.0 | -5.7 | 29.2 | · | |
| Earnings Yield | -1.0% | 1.5% | 0.07% | -0.83% | 0.51% | -1.5% | 25.0% | -17.4% | 3.4% | · |
ต่อหุ้น
| ตัวชี้วัด | แนวโน้ม | Q4 2016 | Q4 2015 | Q4 2014 | Q4 2013 |
|---|---|---|---|---|---|
| EPS (TTM) | $3.44 | $2.44 | · | · |
การประเมินมูลค่า (TTM)
| ตัวชี้วัด | แนวโน้ม | Q4 2016 | Q4 2015 | Q4 2014 | Q4 2013 |
|---|---|---|---|---|---|
| Net Income TTM | $3.48B | $2.46B | · | · | |
| P/E | 4.4 | 7.0 | · | · | |
| Earnings Yield | 22.9% | 14.2% | · | · |
ช่วงเวลาล่าสุดอยู่ทางซ้าย · ค่า null แสดงเป็น ·
งบการเงิน งบกำไรขาดทุน, งบดุล, งบกระแสเงินสด — รายปี, 5 ปีล่าสุด
| ตัวชี้วัด | 2025-12-31 | 2024-12-31 | 2023-12-31 | 2022-12-31 | 2021-12-31 |
|---|---|---|---|---|---|
| กำไรสุทธิ | $-104M | $126M | $8M | $-80M | $106M |
| EPS ที่ปรับลดแล้ว | $-0.09 | $0.11 | $0.01 | $-0.07 | $0.09 |
| ตัวชี้วัด | 2025-12-31 | 2024-12-31 | 2023-12-31 | 2022-12-31 | 2021-12-31 |
|---|---|---|---|---|---|
| อัตราส่วนสภาพคล่อง | 0.7 | 0.8 | 0.8 | 0.8 | 0.8 |
| อัตราส่วนเงินสด | 0.4 | 0.5 | 0.5 | 0.5 | 0.6 |
| ตัวชี้วัด | 2025-12-31 | 2024-12-31 | 2023-12-31 | 2022-12-31 | 2021-12-31 |
|---|---|---|---|---|---|
| กระแสเงินสดอิสระ | $458M | $507M | $249M | $266M | $588M |
ผู้ถือครองสถาบัน (13F) 85 รายงาน · $379.5M ทั้งหมด · ณ วันที่ 30 กันยายน 2026
สถาบันที่รายงานการถือครองหุ้นนี้ในเอกสาร SEC Form 13F รายไตรมาสของตน เฉพาะสถานะ Long; ผู้ยื่นคำร้องรายเดียวอาจปรากฏสองครั้งสำหรับสัญญาออปชันที่แยกจากกัน ขา put/call ขนาดใหญ่ที่หักล้างกันมักสะท้อนถึงการทำตลาด (market-making) หรือสินค้าคงคลังที่มีการป้องกันความเสี่ยง (hedged inventory) ไม่ใช่การเชื่อมั่นในทิศทาง
| พอร์ตใหม่ | ตำแหน่งที่ปิดไปแล้ว | เพิ่มขึ้น | ลดลง | การเปลี่ยนแปลงสุทธิของจำนวนหุ้น |
|---|---|---|---|---|
| 12 (-22 เทียบกับไตรมาสก่อน) | 23 (+12 เทียบกับไตรมาสก่อน) | 21 (-6 เทียบกับไตรมาสก่อน) | 26 (+7 เทียบกับไตรมาสก่อน) | -624K |
เปรียบเทียบกับ Q1 2026. การยื่นแบบฟอร์ม 13F ของ SEC จะครบกำหนดภายใน 45 วันนับจากสิ้นสุดไตรมาส บวกกับระยะเวลาผ่อนผันสั้นๆ สำหรับผู้ยื่นล่าช้า — ไตรมาสที่ยังอยู่ในช่วงเวลานี้จะถูกข้ามไปเพื่อใช้คู่ที่รายงานล่าสุดอย่างสมบูรณ์
| สถาบัน | มูลค่า | หุ้น | % ของ 13F ที่ติดตาม | ประเภท |
|---|---|---|---|---|
| Indigo Partners LLC | $199,183,393 | 21,257,566 | 52.49% | หุ้น |
| WELLINGTON MANAGEMENT GROUP LLP | $43,285,119 | 4,619,543 | 11.41% | หุ้น |
| Thomist Capital Management, LP | $16,441,670 | 1,754,714 | 4.33% | หุ้น |
| Long Focus Capital Management, LLC | $15,366,800 | 1,640,000 | 4.05% | หุ้น |
| Teewinot Capital Advisers, L.L.C. | $14,008,731 | 1,495,062 | 3.69% | หุ้น |
| MORGAN STANLEY | $11,212,197 | 1,196,606 | 2.95% | หุ้น |
| DISCOVERY CAPITAL MANAGEMENT, LLC / CT | $9,034,282 | 964,171 | 2.38% | หุ้น |
| GOLDMAN SACHS GROUP INC | $7,267,981 | 775,665 | 1.92% | หุ้น |
| AMERICAN CENTURY COMPANIES INC | $7,193,255 | 767,690 | 1.90% | หุ้น |
| Walleye Capital LLC | $6,703,364 | 715,407 | 1.77% | หุ้น |
| BANK OF AMERICA CORP /DE/ | $6,039,405 | 644,547 | 1.59% | หุ้น |
| ARROWSTREET CAPITAL, LIMITED PARTNERSHIP | $4,609,890 | 491,984 | 1.21% | หุ้น |
| Ancient Art, L.P. | $3,805,522 | 406,139 | 1.00% | หุ้น |
| JPMORGAN CHASE & CO | $2,956,898 | 318,975 | 0.78% | หุ้น |
| BARCLAYS PLC | $2,471,497 | 263,767 | 0.65% | หุ้น |
| Diametric Capital, LP | $2,370,225 | 252,959 | 0.62% | หุ้น |
| Jump Financial, LLC | $2,351,851 | 250,998 | 0.62% | หุ้น |
| Empowered Funds, LLC | $2,313,078 | 246,860 | 0.61% | หุ้น |
| JANE STREET GROUP, LLC | $2,244,762 | 239,569 | 0.59% | หุ้น |
| DIMENSIONAL FUND ADVISORS LP | $2,150,405 | 229,532 | 0.57% | หุ้น |
| DIVERSIFY WEALTH MANAGEMENT, LLC | $1,657,591 | 212,240 | 0.44% | หุ้น |
| Diversify Advisory Services, LLC | $1,657,591 | 212,240 | 0.44% | หุ้น |
| BNP PARIBAS FINANCIAL MARKETS | $1,403,626 | 149,800 | 0.37% | หุ้น |
| Birnam Oak Advisors, LP | $1,219,580 | 130,158 | 0.32% | หุ้น |
| M&T Bank Corp | $1,189,194 | 126,915 | 0.31% | หุ้น |
| WOLVERINE TRADING, LLC | $897,512 | 131,600 | 0.24% | สัญญาซื้อล่วงหน้า |
| UBS Group AG | $846,505 | 90,342 | 0.22% | หุ้น |
| Numerai GP LLC | $658,046 | 70,229 | 0.17% | หุ้น |
| WINTON GROUP Ltd | $653,089 | 69,700 | 0.17% | หุ้น |
| ANTIPODES PARTNERS Ltd | $615,112 | 65,647 | 0.16% | หุ้น |
| Farther Finance Advisors, LLC | $599,689 | 64,001 | 0.16% | หุ้น |
| STATE STREET CORP | $553,879 | 59,112 | 0.15% | หุ้น |
| STIFEL FINANCIAL CORP | $469,928 | 50,153 | 0.12% | หุ้น |
| XTX Topco Ltd | $453,752 | 48,426 | 0.12% | หุ้น |
| Engineers Gate Manager LP | $412,046 | 43,975 | 0.11% | หุ้น |
| Cresset Asset Management, LLC | $388,892 | 41,504 | 0.10% | หุ้น |
| PRIMECAP MANAGEMENT CO/CA/ | $384,170 | 41,000 | 0.10% | หุ้น |
| CITADEL ADVISORS LLC | $374,697 | 39,989 | 0.10% | หุ้น |
| PRELUDE CAPITAL MANAGEMENT, LLC | $318,692 | 34,012 | 0.08% | หุ้น |
| HB Wealth Management, LLC | $309,379 | 33,018 | 0.08% | หุ้น |
| PEAK6 LLC | $297,966 | 31,800 | 0.08% | สัญญาซื้อล่วงหน้า |
| WOLVERINE TRADING, LLC | $255,839 | 37,513 | 0.07% | หุ้น |
| MARSHALL WACE, LLP | $220,364 | 23,518 | 0.06% | หุ้น |
| CONFLUENCE INVESTMENT MANAGEMENT LLC | $212,128 | 32,386 | 0.06% | หุ้น |
| Inspire Advisors, LLC | $193,849 | 20,724 | 0.05% | หุ้น |
| OPPENHEIMER & CO INC | $191,617 | 20,450 | 0.05% | หุ้น |
| Savant Capital, LLC | $190,748 | 20,357 | 0.05% | หุ้น |
| NewEdge Wealth, LLC | $187,400 | 20,000 | 0.05% | หุ้น |
| CWM, LLC | $186,003 | 25,691 | 0.05% | หุ้น |
| State of Wyoming | $142,443 | 15,202 | 0.04% | หุ้น |
นักเคลื่อนไหวและเจ้าของ %+ 5 1 รายการ
นักลงทุนที่ยื่น SEC Schedule 13D — กรรมสิทธิ์ตามผลประโยชน์ที่แท้จริงสูงกว่า % 5 โดยมีเจตนาที่จะมีอิทธิพลต่อผู้ออกหลักทรัพย์ (การถือหุ้นของนักเคลื่อนไหว, การรณรงค์ในคณะกรรมการ, M&A) แต่ละแถวแสดงสถานะล่าสุดที่ทราบของตำแหน่งของผู้ยื่นคำร้องรายนั้น
| ผู้ยื่นคำร้อง | ยื่นแล้ว | ส่วนได้เสีย | สถานะ | วัตถุประสงค์ | การยื่นคำร้อง |
|---|---|---|---|---|---|
| Long Bar LatAM LLC, Indigo Mexico Cooperatief U.A., Indigo LatAm LP, Long Bar LatAm II LP, Indigo Mexico LLC, FRANKE WILLIAM A ×2 เอกสารยื่นคำร้อง | 22 ธันวาคม 2025 | 18.20% | การแก้ไข | · | SEC |
Purpose is an automated classification of the filer's own stated purpose (SEC Item 4) — not investment advice. "—" means no clear purpose was stated or the text could not be classified.
ผู้บริหารบริษัท 13 รายชื่อผู้บริหาร · ผู้บริหาร 0 คน · กรรมการ 5 คน
| ผู้บริหารภายใน | บทบาท | กิจกรรมล่าสุด | หุ้นที่ถือครอง | ซื้อ 12 เดือน | ขาย 12 เดือน | สุทธิ 12 เดือน |
|---|---|---|---|---|---|---|
| William Dean Donovan | กรรมการ | 28 พฤษภาคม 2026 S | 2,946,050 | 0 | 3 | $-1,127,000 |
| Margain Guadalupe Phillips | กรรมการ | 28 เมษายน 2026 M | 363,379 | 0 | 0 | $0 |
| Brian H. Franke | กรรมการ | 28 เมษายน 2026 M | 3,496,120 | 0 | 0 | $0 |
| Andrew S. Broderick | กรรมการ | 28 เมษายน 2026 M | 97,700 | 0 | 0 | $0 |
| Yanez Ricardo Maldonado | กรรมการ | 28 เมษายน 2026 M | 405,712 | 0 | 0 | $0 |
| John Slowik | · | 28 เมษายน 2026 M | 312,710 | 0 | 0 | $0 |
| Enrique Javier Beltranena Mejicano | · | 28 เมษายน 2026 M | 13,965,052 | 0 | 0 | $0 |
| Monica Aspe Bernal | · | 28 เมษายน 2026 M | 196,414 | 0 | 0 | $0 |
| Ricardo Maldonado Yanez | · | 28 เมษายน 2026 M | 405,712 | 0 | 0 | $0 |
| Fernandez Jose Luis Fernandez | · | 28 เมษายน 2026 M | 446,927 | 0 | 0 | $0 |
| Stan L Pace | · | 28 เมษายน 2026 M | 349,240 | 0 | 0 | $0 |
| Joaquin Alberto Palomo Deneke | · | 28 เมษายน 2026 M | 222,710 | 0 | 0 | $0 |
| Marco Baldocchi Kriete | · | 24 เมษายน 2026 A | · | 0 | 0 | $0 |
ผู้บริหารจากเอกสาร SEC Form 3/4/5; สุทธิ = เฉพาะการซื้อขายในตลาดเปิด
VLRS ความเห็นหลายต่อหลายของนักวิเคราะห์ มุมมองนักวิเคราะห์ทั้งเชิงบวกและเชิงลบ, ราคาเป้าหมาย 12 เดือน, อัพไซด์
ราคาเป้าหมาย 12 เดือน
13 นักวิเคราะห์ · 2026-10-02ราคาเป้าหมายค่าเฉลี่ย $9.46 +45.8%
การเปรียบเทียบกับบริษัทคู่เทียบ (อุตสาหกรรมย่อย GICS) เมตริกสำคัญเทียบกับบริษัทในกลุ่มอุตสาหกรรมเดียวกัน
ตามปีงบประมาณ ราคา ณ ราคาปิดสิ้นสุดปีงบประมาณล่าสุดของแต่ละบริษัท
| Ticker | มูลค่าตลาด | P/E | รายได้ YoY | อัตรากำไรสุทธิ | ROE | อัตรากำไรขั้นต้น |
|---|---|---|---|---|---|---|
| VLRS | · | -98.7 | · | · | -33.1% | · |
| AERO | · | 91.5 | · | 6.6% | -47.0% | · |
ตัวชี้วัดของฉัน รายการเฝ้าดูส่วนตัวของคุณ — แถวที่เลือกจากข้อมูลพื้นฐานฉบับเต็ม
เลือกตัวชี้วัดที่สำคัญสำหรับคุณ — คลิกเครื่องหมาย + ถัดจากแถวใดก็ได้ใน Fundamentals ฉบับเต็มด้านบน
การเลือกของคุณถูกบันทึกและจะติดตามคุณไปในทุกสัญลักษณ์หุ้น