
VLRS Controladora Vuela Compania de Aviacion, S.A.B. de C.V. American Depositary Shares, each representing ten (10) Ordinary Participation Certificates
NYSE · Airlines · Переглянути на SEC EDGAR ↗ закриття Жов 2, 2026 10-K/10-Q Кві 28, 2026VLRS Знімок акцій Ціна, ринкова капіталізація, P/E, EPS, ROE, борг/власний капітал, діапазон 52 тижнів
VLRS Графік ціни акцій Денні OHLCV з технічними індикаторами — панування, масштабування та налаштування вашого представлення
Гранулярність стовпчиків адаптується до вибраного періоду — наведіть курсор на графік, щоб побачити відкриття/максимум/мінімум/закриття для стовпчика.
Про Controladora Vuela Compania de Aviacion, S.A.B. de C.V. American Depositary Shares, each representing ten (10) Ordinary Participation Certificates Огляд компанії з Wikipedia
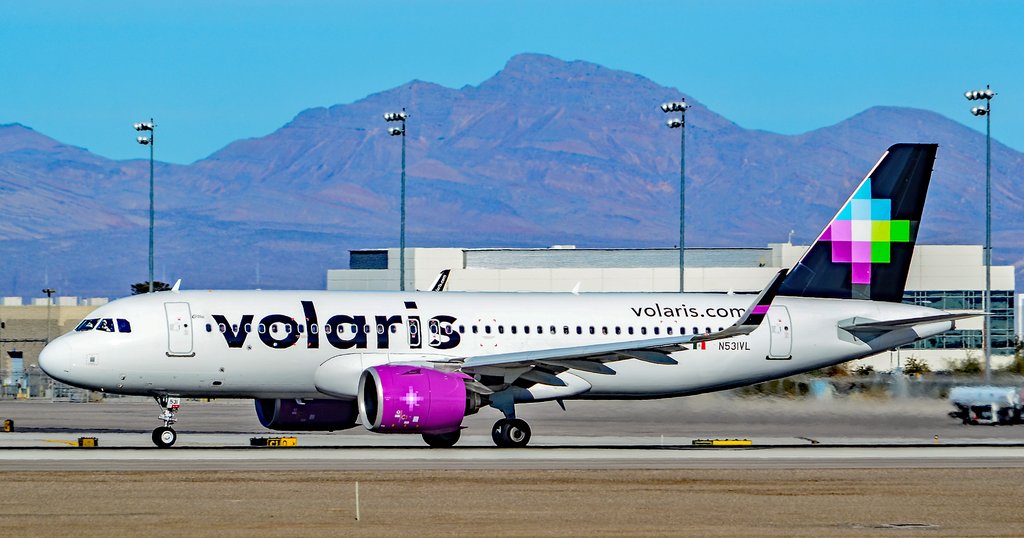
Concesionaria Vuela Compañía de Aviación S.A.B. de C.V., operating as Volaris, is a Mexican ultra low-cost airline based in Santa Fe, Álvaro Obregón, Mexico City, with its operating bases in Cancún, Culiacán, Guadalajara, León/Del Bajío, Mexicali, Mexico City, Monterrey, and Tijuana. It is Mexico's largest airline by transported passengers and serves domestic and international destinations within the Americas. It is the leading airline in the Mexican domestic airline market with a market share of 42%.
History
The pre-operations phase, the founding of the legal entities and setting up of the required infrastructure, started in August 2005 under the name Vuela Airlines. The idea for the airline was formed from the proposed "Vuelamex" project. Major initial shareholders of the company were Grupo Televisa (the world's biggest Spanish-language media conglomerate), Inbursa (an insurance company owned by multi-billionaire Carlos Slim), TACA Airlines, and the Discovery Americas Fund. Each of these partners invested 25% of the initial cost of activities, or 100 million USD.
In July 2010, it was announced that Televisa and Inbursa had sold their stake in Volaris, leaving the ownership of Volaris as follows: TACA Airlines with Roberto and Maria Cristina Kriete (50%), Investment fund Discovery Americas (over 25%), and Indigo Partners: Fund led by former America West CEO Bill Franke.
Ticket sales started in January 2006. Following the delivery of the airline's first aircraft, the first non-commercial flight was operated in February 2006. Scheduled revenue flights were launched on March 13, 2006, with the inaugural flight being between Toluca and Tijuana.
Volaris began service to Mexico City in September 2010 after absorbing flight routes from two defunct Mexican airlines, Aerocalifornia and Mexicana. In March 2011, the airline announced that its hub in Toluca would move to Guadalajara.
In June 2012, the airline launched a frequent flyer program called VClub. In June 2012, PayPal became a payment alternative for the airline, enabling customers to purchase tickets directly from the airline's website. In September 2012, Volaris announced a codeshare partnership with a German airline, Condor. Passengers of Condor are able to fly to more international destinations.
On March 13, 2013, the airline celebrated its seventh anniversary, offering passengers 70% off all flights, and has done this every year since then. Volaris announced the creation of a subsidiary, Volaris Costa Rica, in March 2016. The subsidiary, based at Juan Santamaría International Airport in the Costa Rican capital of San José, started operations in November 2016.
As of 2022, Volaris has faced multiple class-action lawsuits due to failure to properly refund flights canceled due to the COVID-19 pandemic.
In December 2025, Volaris and competitor Viva have signed an agreement to form a holding company, creating the largest low-cost airline group in Mexico. The deal aims to lower fleet costs, while both airlines would maintain their brands.
In 2025, Mexico's Federal Civil Aviation Agency (AFAC) authorized Volaris to operate 10 aircraft with foreign pilots between December 1, 2025, and January 12, 2026; the Association of Airline Pilots of Mexico (ASPA) claim the decision breaches Mexico's Constitution and Civil Aviation Law.
International operations
In November 2008, Volaris announced a codeshare agreement with U.S.-based low-cost carrier Southwest Airlines. In April 2009, Volaris announced the start of U.S.-bound flights out of Toluca and Guadalajara (initially to Los Angeles and Oakland) to feed into the hubs of Southwest Airlines. After Mexicana de Aviación's shutdown, Volaris took over many of Mexicana's international destinations and flights from its focus city, Guadalajara. The airline began using Guadalajara International Airport as an American gateway hub in late 2011.
In February 2013, Volaris and Southwest stopped codesharing. Southwest decided to focus more on the Mexican market with AirTran Airways, instead of codesharing with Volaris. In January 2018, Volaris announced a codeshare agreement with American low-cost carrier Frontier Airlines.
In June 2018, after Donald Trump signed an order ending the family separation policy, Volaris announced that they would offer free flights for children to reunite with family members who had been deported.
Corporate affairs
Business trends
The key trends for Volaris are (as of the financial year ending 31 December):
Headquarters
The airline is headquartered in Santa Fe, Álvaro Obregón, Mexico City. It formerly had its headquarters on the first floor of Prolongación Paseo de la Reforma 490 in Peña Blanca, Santa Fe.
Services
Volaris cabins are configured in a single class, high density layout.
Volaris does not provide complimentary meals or drinks on its flights. Passengers may purchase items on board from the "Entre nubes" buy on board program. Onboard sales are an important part of the airline's ancillary revenue. Items such as snacks, pillows, blankets and Volaris-branded items are sold on board. Volaris' monthly inflight magazine is called "V de Volaris".
The airline had previously provided in-flight entertainment (IFE) in most aircraft, utilizing drop-down screens on its Airbus aircraft. By 2019, all use of IFE had been discontinued.
Frequent flyer program
VClub is Volaris' frequent flyer program. It gives members exclusive deals on flights, baggage and packages. The airline offers individual and group memberships, with the option to pay monthly or annually. Volaris offers VPass, similar to Spirit's "$9 Fare Club". It offers a set subscription price, and charges customers only for taxes and additional services. Customers can book codeshare flights and earn points through fellow ultra-low-cost carrier, Frontier Airlines.
Corporate identity
Brand image
The Volaris logo, since its launch in 2005, has been a colorful, pixelated star against a black background. It represents the north star, Polaris, from which the airline's name is derived.
Advertising slogans
Volaris has used several slogans over the years:
2005–2008 – "Lo quieres, lo tienes" (You want it, you got it.)
2008–2012 – "Vive viajando" (Live travelling)
2013–2017 – "Tu decides" (You decide). Launched after the introduction of the "clean fare", which no longer included the cost of food, baggage, or seat selection in the airline's ticket prices.
2015 – "Queremos que todo el mundo vuele" (We want the whole world to fly)
2015–present – "Precios que te hacen viajar" (Prices that make you travel)
2016 – "Avión a precio de camión" (The plane at the price of a bus)
November 2018–present – "Don't just fly, vuela"
Destinations
Volaris operates scheduled flights to Mexico and elsewhere in the Americas from its hubs at Guadalajara International Airport in Guadalajara, Mexico City International Airport in Mexico City, and Tijuana International Airport in Tijuana. Focus cities include Cancún International Airport in Cancún, Bajío International Airport in León, and Monterrey International Airport in Monterrey.
Operating bases
Volaris operates crew bases at the following airports:
Cancún
Culiacán
Guadalajara
León/Del Bajío
Mexico City
Monterrey
Morelia
Tijuana
Codeshare agreements
Volaris codeshares with the following airlines:
Copa Airlines
Frontier Airlines
Hainan Airlines
Iberia
Turkish Airlines
Interline agreements
Condor
Fleet
Current fleet
As of October 2025, Volaris operates an all-Airbus A320 family fleet composed of the following aircraft:
Fleet development
Volaris became the first North American operator of the Airbus A320neo aircraft in September 2016.
In November 2017, during the Dubai Airshow, Indigo Partners announced an order for 430 aircraft of the Airbus A320neo family of which 80 will be for Volaris as follows: 46 Airbus A320neo aircraft and 34 Airbus A321neo aircraft.
In November 2021 during the Dubai Airshow, Volaris announced an order for 39 Airbus A321neo. An existing order for 20 Airbus A320neo aircraft was converted into A321neo.
On June 20, 2023, during the Paris Air Show, Volaris announced an order for 25 Airbus A321neo aircraft.
Incidents
On 8 December 2024, a passenger tried to enter the cockpit of a Volaris aircraft flying from Leon to Tijuana, forcing its diversion to Guadalajara, where the passenger was arrested after having been previously subdued by other passengers. The suspect said that he wanted to divert the aircraft to the United States after receiving a death threat from drug cartels.
Джерело: Wikipedia (Англійська), CC BY-SA 4.0 · Переглянути на Wikipedia ↗
10-річна ефективність Тренди виручки, чистого прибутку, маржі та EPS
Оцінка Співвідношення P/E, P/S, P/B, EV/EBITDA — акція дорога чи дешева?
| Метрика | 5-річний тренд | VLRS | середнє за 5 років | Медіана аналогів | Висновок |
|---|---|---|---|---|---|
| P/E | -98.7середнє за 5 років ≈277.3 | ≈277.3 | · | · |
Медіана аналогічних компаній розраховується на стандартизованій основі для кожного показника і може не завжди відповідати базі TTM/MRQ, показаній для цієї акції.
Прибутковість Валова, операційна та чиста маржа; ROE, ROA, ROIC
| Метрика | 5-річний тренд | VLRS | середнє за 5 років | Медіана аналогів | Висновок |
|---|---|---|---|---|---|
| ROA | -1.8%середнє за 5 років ≈0.31% | ≈0.31% | · | · | |
| ROE | -33.1%середнє за 5 років ≈5.6% | ≈5.6% | · | · | |
| ROIC | 45.0%середнє за 5 років ≈65.8% | ≈65.8% | · | · |
Фінансове здоровʼя Борг, ліквідність, платоспроможність — міцність балансу
| Метрика | 5-річний тренд | VLRS | середнє за 5 років | Медіана аналогів | Висновок |
|---|---|---|---|---|---|
| Current Ratio (Поточний коефіцієнт) | 0.7середнє за 5 років ≈0.8 | ≈0.8 | · | · | |
| Quick Ratio (Коефіцієнт швидкої ліквідності) | 0.4середнє за 5 років ≈0.5 | ≈0.5 | · | · | |
| Interest Coverage (Покриття відсотків) | 0.4середнє за 5 років ≈1.2 | ≈1.2 | · | · |
Зростання Зростання виручки, EPS та чистого прибутку: рік до року, 3-річний CAGR, 5-річний CAGR
Ще недостатньо фундаментальних даних для обчислення цієї групи коефіцієнтів.
Ефективність капіталу Оборотність активів, оборотність запасів, оборотність дебіторської заборгованості
Ще недостатньо фундаментальних даних для обчислення цієї групи коефіцієнтів.
значення · ≈ середнє за 5 років · медіана галузі · вердикт відносно медіани
Історія прибутків EPS фактичний проти прогнозу, сюрприз %, коефіцієнт перевищення, дата наступного звіту про прибутки
| Період | Звіт | EPS (факт) | EPS прогноз | Сюрприз |
|---|---|---|---|---|
| 30 червня 2026 р. | $-0.11 | $-0.13 | 15.9% | |
| 31 березня 2026 р. | $-0.06 | $-0.08 | 27.7% | |
| 31 грудня 2025 р. | $0.00 | $0.02 | -81.0% | |
| 30 вересня 2025 р. | $0.01 | $-0.00 | — | |
| 30 червня 2025 р. | $-0.05 | $-0.08 | 30.1% | |
| 31 березня 2025 р. | $0.00 | $0.02 | -81.0% |
Повні фундаментальні показники Усі показники за роками — звіт про прибутки та збитки, баланс, рух грошових коштів
Звіт про прибутки та збитки
| Метрика | Тенденція | 2025 | 2024 | 2023 | 2022 | 2021 | 2020 | 2019 | 2018 | 2017 | 2016 |
|---|---|---|---|---|---|---|---|---|---|---|---|
| Operating Income | $135M | $413M | $223M | $44M | $397M | $-134M | $4.36B | $535M | $1.24B | $2.70B | |
| Interest Expense | $314M | $294M | $219M | $193M | $139M | $138M | $2.27B | $1.88B | $1.52B | $35M | |
| Interest Income | $48M | $49M | $38M | $13M | $4M | $5M | $208M | $153M | $106M | $103M | |
| Pretax Income | $-118M | $183M | $7M | $-132M | $137M | $-253M | $3.73B | $-1.29B | $516M | $4.94B | |
| Income Tax | $-14M | $56M | $-377.0K | $-52M | $31M | $-62M | $1.09B | $-350M | $238M | $1.46B | |
| Net Income | $-104M | $126M | $8M | $-80M | $106M | $-192M | $2.64B | $-943M | $279M | $3.48B | |
| EPS (Basic) | $-0.09 | $0.11 | $0.01 | $-0.07 | $0.09 | $-0.19 | $2.61 | $-0.93 | $0.28 | $3.44 | |
| EPS (Diluted) | $-0.09 | $0.11 | $0.01 | $-0.07 | $0.09 | $-0.19 | $2.61 | $-0.93 | $0.28 | $3.44 | |
| Shares (Basic) | 1,149,208,000 | 1,150,743,000 | 1,152,609,000 | 1,155,030,000 | 1,152,256,000 | 1,004,965,000 | 1,011,877,000 | 1,011,877,000 | 1,011,877,000 | 1,011,877,000 | |
| Shares (Diluted) | 1,149,208,000 | 1,165,859,000 | 1,165,451,000 | 1,165,135,000 | 1,165,612,000 | 1,021,286,000 | 1,011,877,000 | 1,011,877,000 | 1,011,877,000 | 1,011,877,000 | |
| EBITDA | $343M | $596M | $357M | $141M | $448M | $-2.36B | $5.03B | $-380M | $567M | · |
Баланс
| Метрика | Тенденція | 2025 | 2024 | 2023 | 2022 | 2021 | 2020 | 2019 | 2018 | 2017 | 2016 |
|---|---|---|---|---|---|---|---|---|---|---|---|
| Cash & Equivalents | $754M | $908M | $774M | $712M | $741M | $506M | $7.98B | $423M | $6.95B | $7.07B | |
| Inventory | $17M | $17M | $16M | $16M | $14M | $279M | $302M | $297M | $295M | $244M | |
| Current Assets | $1.39B | $1.38B | $1.25B | $1.07B | $979M | $14.40B | $12.12B | $8.92B | $11.05B | $11.55B | |
| PP&E (Net) | $948M | $1.07B | $805M | $479M | $455M | $365M | $7.39B | $5.78B | $5.78B | $2.53B | |
| Intangibles | $38M | $26M | $16M | $13M | $13M | $192M | $167M | $179M | $190M | $114M | |
| Total Assets | $5.64B | $5.70B | $5.15B | $4.47B | $3.98B | $68.19B | $63.30B | $56.72B | $49.95B | $21.78B | |
| Current Liabilities | $1.92B | $1.77B | $1.62B | $1.42B | $1.25B | $20.97B | $17.32B | $14.08B | $13.56B | $7.96B | |
| Total Liabilities | $5.37B | $5.34B | $4.90B | $4.23B | $3.67B | $65.39B | $57.77B | $54.02B | $46.13B | $11.06B | |
| Retained Earnings | $-126M | $-22M | $-148M | $-156M | $-76M | $-3.86B | $438M | $-2.20B | $-1.26B | $5.85B | |
| Stockholders' Equity | $264M | $365M | $243M | $235M | $313M | $140M | $293M | $2.71B | $3.83B | $3.58B |
Грошовий потік
| Метрика | Тенденція | 2025 | 2024 | 2023 | 2022 | 2021 | 2020 | 2019 | 2018 | 2017 | 2016 |
|---|---|---|---|---|---|---|---|---|---|---|---|
| D&A | $208M | $183M | $134M | $97M | $57M | $42M | $676M | $501M | $549M | $537M | |
| Other Non-cash | $646M | $780M | $588M | $596M | $612M | $7.75B | $6.20B | $748M | $1.03B | · | |
| Operating Cash Flow | $750M | $1.09B | $730M | $614M | $785M | $214M | $9.51B | $6.28B | $6.02B | $979M | |
| CapEx | $292M | $583M | $481M | $347M | $186M | $157M | $3.48B | $2.74B | $2.52B | $2.20B | |
| Investing Cash Flow | $-89M | $-473M | $-462M | $-131M | $-135M | $-3M | $-1.88B | $-1.39B | $-2.26B | $-28M | |
| Financing Cash Flow | $-819M | $-472M | $-214M | $-513M | $-435M | $-130M | $-5.24B | $-5.95B | $-3.63B | $11M | |
| Free Cash Flow | $458M | $507M | $249M | $266M | $588M | $983M | $6.03B | $-2.18B | $-1.54B | · | |
| Levered FCF | $182M | $304M | $19M | $150M | $480M | $-1.29B | $4.42B | $-2.27B | $-1.60B | · |
Прибутковість
| Метрика | Тенденція | 2025 | 2024 | 2023 | 2022 | 2021 | 2020 | 2019 | 2018 | 2017 | 2016 |
|---|---|---|---|---|---|---|---|---|---|---|---|
| ROA | -1.8% | 2.3% | 0.16% | -1.9% | 2.8% | -6.5% | 4.4% | -1.9% | -2.7% | · | |
| ROE | -33.1% | 41.6% | 3.3% | -29.3% | 45.5% | -277.9% | 64.1% | -10.5% | -8.6% | · | |
| ROIC | 45.0% | 78.3% | 96.5% | 11.3% | 97.8% | -87.6% | 55.7% | -7.1% | 0.14% | · |
Ліквідність та платоспроможність
| Метрика | Тенденція | 2025 | 2024 | 2023 | 2022 | 2021 | 2020 | 2019 | 2018 | 2017 | 2016 |
|---|---|---|---|---|---|---|---|---|---|---|---|
| Current Ratio | 0.7 | 0.8 | 0.8 | 0.8 | 0.8 | 0.7 | 0.7 | 1.0 | 1.2 | · | |
| Quick Ratio | 0.4 | 0.5 | 0.5 | 0.5 | 0.6 | 0.5 | 0.5 | 0.6 | 0.7 | · | |
| Interest Coverage | 0.4 | 1.4 | 1.0 | 0.2 | 2.8 | -1.1 | 1.9 | -7.3 | 0.2 | · |
На акцію
| Метрика | Тенденція | 2025 | 2024 | 2023 | 2022 | 2021 | 2020 | 2019 | 2018 | 2017 | 2016 |
|---|---|---|---|---|---|---|---|---|---|---|---|
| Cash Flow / Share | $0.65 | $0.93 | $0.63 | $0.53 | $0.66 | $4.27 | $9.40 | $0.56 | $0.97 | · | |
| EPS (TTM) | $-0.09 | $0.11 | $0.01 | $-0.07 | $0.09 | $-0.19 | $2.61 | $-0.93 | $0.28 | · |
Оцінка (TTM)
| Метрика | Тенденція | 2025 | 2024 | 2023 | 2022 | 2021 | 2020 | 2019 | 2018 | 2017 | 2016 |
|---|---|---|---|---|---|---|---|---|---|---|---|
| Net Income TTM | $-104M | $126M | $8M | $-80M | $106M | $-192M | $2.64B | $-943M | $279M | · | |
| P/E | -98.7 | 68.9 | 1340.0 | -121.2 | 197.5 | -66.1 | 4.0 | -5.7 | 29.2 | · | |
| Earnings Yield | -1.0% | 1.5% | 0.07% | -0.83% | 0.51% | -1.5% | 25.0% | -17.4% | 3.4% | · |
На акцію
| Метрика | Тенденція | Q4 2016 | Q4 2015 | Q4 2014 | Q4 2013 |
|---|---|---|---|---|---|
| EPS (TTM) | $3.44 | $2.44 | · | · |
Оцінка (TTM)
| Метрика | Тенденція | Q4 2016 | Q4 2015 | Q4 2014 | Q4 2013 |
|---|---|---|---|---|---|
| Net Income TTM | $3.48B | $2.46B | · | · | |
| P/E | 4.4 | 7.0 | · | · | |
| Earnings Yield | 22.9% | 14.2% | · | · |
Найновіший період ліворуч · нульові значення показані як ·
Фінансова звітність Звіт про прибутки та збитки, баланс, рух грошових коштів — річні, за останні 5 років
| Метрика | 2025-12-31 | 2024-12-31 | 2023-12-31 | 2022-12-31 | 2021-12-31 |
|---|---|---|---|---|---|
| Чистий прибуток | $-104M | $126M | $8M | $-80M | $106M |
| Розбавлений EPS | $-0.09 | $0.11 | $0.01 | $-0.07 | $0.09 |
| Метрика | 2025-12-31 | 2024-12-31 | 2023-12-31 | 2022-12-31 | 2021-12-31 |
|---|---|---|---|---|---|
| Поточний коефіцієнт | 0.7 | 0.8 | 0.8 | 0.8 | 0.8 |
| Коефіцієнт швидкої ліквідності | 0.4 | 0.5 | 0.5 | 0.5 | 0.6 |
| Метрика | 2025-12-31 | 2024-12-31 | 2023-12-31 | 2022-12-31 | 2021-12-31 |
|---|---|---|---|---|---|
| Вільний грошовий потік | $458M | $507M | $249M | $266M | $588M |
Інституційні власники (13F) 85 подавачів звітності · $379.5M всього · Станом на 30 вересня 2026 р.
Інституційні інвестори, які звітують про володіння цими акціями у своїй квартальній формі SEC 13F. Тільки довгі позиції; один подавець звітності може з'явитися двічі для окремих опціонних контрактів. Великі протилежні опціонні позиції (пут/кол) зазвичай відображають маркет-мейкінг або хеджування запасів, а не спрямованість переконань.
| Нові позиції | Закриті позиції | Збільшено | Зменшено | Зміна чистих акцій |
|---|---|---|---|---|
| 12 (-22 проти попереднього кв.) | 23 (+12 проти попереднього кв.) | 21 (-6 проти попереднього кв.) | 26 (+7 проти попереднього кв.) | -624K |
Порівняно з Q1 2026. Звіти SEC Form 13F подаються протягом 45 днів після закінчення кварталу плюс невеликий буфер для тих, хто подає із запізненням — квартали, що ще знаходяться в цьому вікні, пропускаються на користь останньої повністю звітної пари.
| Інституційний інвестор | Вартість | Акції | % від відстежуваного 13F | Тип |
|---|---|---|---|---|
| Indigo Partners LLC | $199 183 393 | 21 257 566 | 52,49% | Акції |
| WELLINGTON MANAGEMENT GROUP LLP | $43 285 119 | 4 619 543 | 11,41% | Акції |
| Thomist Capital Management, LP | $16 441 670 | 1 754 714 | 4,33% | Акції |
| Long Focus Capital Management, LLC | $15 366 800 | 1 640 000 | 4,05% | Акції |
| Teewinot Capital Advisers, L.L.C. | $14 008 731 | 1 495 062 | 3,69% | Акції |
| MORGAN STANLEY | $11 212 197 | 1 196 606 | 2,95% | Акції |
| DISCOVERY CAPITAL MANAGEMENT, LLC / CT | $9 034 282 | 964 171 | 2,38% | Акції |
| GOLDMAN SACHS GROUP INC | $7 267 981 | 775 665 | 1,92% | Акції |
| AMERICAN CENTURY COMPANIES INC | $7 193 255 | 767 690 | 1,90% | Акції |
| Walleye Capital LLC | $6 703 364 | 715 407 | 1,77% | Акції |
| BANK OF AMERICA CORP /DE/ | $6 039 405 | 644 547 | 1,59% | Акції |
| ARROWSTREET CAPITAL, LIMITED PARTNERSHIP | $4 609 890 | 491 984 | 1,21% | Акції |
| Ancient Art, L.P. | $3 805 522 | 406 139 | 1,00% | Акції |
| JPMORGAN CHASE & CO | $2 956 898 | 318 975 | 0,78% | Акції |
| BARCLAYS PLC | $2 471 497 | 263 767 | 0,65% | Акції |
| Diametric Capital, LP | $2 370 225 | 252 959 | 0,62% | Акції |
| Jump Financial, LLC | $2 351 851 | 250 998 | 0,62% | Акції |
| Empowered Funds, LLC | $2 313 078 | 246 860 | 0,61% | Акції |
| JANE STREET GROUP, LLC | $2 244 762 | 239 569 | 0,59% | Акції |
| DIMENSIONAL FUND ADVISORS LP | $2 150 405 | 229 532 | 0,57% | Акції |
| DIVERSIFY WEALTH MANAGEMENT, LLC | $1 657 591 | 212 240 | 0,44% | Акції |
| Diversify Advisory Services, LLC | $1 657 591 | 212 240 | 0,44% | Акції |
| BNP PARIBAS FINANCIAL MARKETS | $1 403 626 | 149 800 | 0,37% | Акції |
| Birnam Oak Advisors, LP | $1 219 580 | 130 158 | 0,32% | Акції |
| M&T Bank Corp | $1 189 194 | 126 915 | 0,31% | Акції |
| WOLVERINE TRADING, LLC | $897 512 | 131 600 | 0,24% | Опціон кол |
| UBS Group AG | $846 505 | 90 342 | 0,22% | Акції |
| Numerai GP LLC | $658 046 | 70 229 | 0,17% | Акції |
| WINTON GROUP Ltd | $653 089 | 69 700 | 0,17% | Акції |
| ANTIPODES PARTNERS Ltd | $615 112 | 65 647 | 0,16% | Акції |
| Farther Finance Advisors, LLC | $599 689 | 64 001 | 0,16% | Акції |
| STATE STREET CORP | $553 879 | 59 112 | 0,15% | Акції |
| STIFEL FINANCIAL CORP | $469 928 | 50 153 | 0,12% | Акції |
| XTX Topco Ltd | $453 752 | 48 426 | 0,12% | Акції |
| Engineers Gate Manager LP | $412 046 | 43 975 | 0,11% | Акції |
| Cresset Asset Management, LLC | $388 892 | 41 504 | 0,10% | Акції |
| PRIMECAP MANAGEMENT CO/CA/ | $384 170 | 41 000 | 0,10% | Акції |
| CITADEL ADVISORS LLC | $374 697 | 39 989 | 0,10% | Акції |
| PRELUDE CAPITAL MANAGEMENT, LLC | $318 692 | 34 012 | 0,08% | Акції |
| HB Wealth Management, LLC | $309 379 | 33 018 | 0,08% | Акції |
| PEAK6 LLC | $297 966 | 31 800 | 0,08% | Опціон кол |
| WOLVERINE TRADING, LLC | $255 839 | 37 513 | 0,07% | Акції |
| MARSHALL WACE, LLP | $220 364 | 23 518 | 0,06% | Акції |
| CONFLUENCE INVESTMENT MANAGEMENT LLC | $212 128 | 32 386 | 0,06% | Акції |
| Inspire Advisors, LLC | $193 849 | 20 724 | 0,05% | Акції |
| OPPENHEIMER & CO INC | $191 617 | 20 450 | 0,05% | Акції |
| Savant Capital, LLC | $190 748 | 20 357 | 0,05% | Акції |
| NewEdge Wealth, LLC | $187 400 | 20 000 | 0,05% | Акції |
| CWM, LLC | $186 003 | 25 691 | 0,05% | Акції |
| State of Wyoming | $142 443 | 15 202 | 0,04% | Акції |
Активісти та власники %+ 5 1 холдинг
Інвестори, які подали Розклад SEC 13D — бенефіціарна власність понад 5% з наміром вплинути на емітента (активістські частки, кампанії в раді директорів, M&A). Кожен рядок показує останній відомий стан позиції цього подавця.
| Подавець | Подано | Частка | Статус | Мета | Подача |
|---|---|---|---|---|---|
| Long Bar LatAM LLC, Indigo Mexico Cooperatief U.A., Indigo LatAm LP, Long Bar LatAm II LP, Indigo Mexico LLC, FRANKE WILLIAM A ×2 подання | 22 грудня 2025 р. | 18,20% | Поправка | · | SEC |
Purpose is an automated classification of the filer's own stated purpose (SEC Item 4) — not investment advice. "—" means no clear purpose was stated or the text could not be classified.
Інсайдери компанії 13 інсайдерів · 0 керівники · 5 директори
| Інсайдер | Роль | Остання активність | Кількість акцій у власності | Купівлі за 12 міс. | Продажі за 12 міс. | Нетто 12 міс |
|---|---|---|---|---|---|---|
| William Dean Donovan | Директор | 28 травня 2026 р. S | 2 946 050 | 0 | 3 | $-1 127 000 |
| Margain Guadalupe Phillips | Директор | 28 квітня 2026 р. M | 363 379 | 0 | 0 | $0 |
| Brian H. Franke | Директор | 28 квітня 2026 р. M | 3 496 120 | 0 | 0 | $0 |
| Andrew S. Broderick | Директор | 28 квітня 2026 р. M | 97 700 | 0 | 0 | $0 |
| Yanez Ricardo Maldonado | Директор | 28 квітня 2026 р. M | 405 712 | 0 | 0 | $0 |
| John Slowik | · | 28 квітня 2026 р. M | 312 710 | 0 | 0 | $0 |
| Enrique Javier Beltranena Mejicano | · | 28 квітня 2026 р. M | 13 965 052 | 0 | 0 | $0 |
| Monica Aspe Bernal | · | 28 квітня 2026 р. M | 196 414 | 0 | 0 | $0 |
| Ricardo Maldonado Yanez | · | 28 квітня 2026 р. M | 405 712 | 0 | 0 | $0 |
| Fernandez Jose Luis Fernandez | · | 28 квітня 2026 р. M | 446 927 | 0 | 0 | $0 |
| Stan L Pace | · | 28 квітня 2026 р. M | 349 240 | 0 | 0 | $0 |
| Joaquin Alberto Palomo Deneke | · | 28 квітня 2026 р. M | 222 710 | 0 | 0 | $0 |
| Marco Baldocchi Kriete | · | 24 квітня 2026 р. A | · | 0 | 0 | $0 |
Інсайдери згідно з формами SEC 3/4/5; чистий результат = лише відкритий ринок купівлі/продажу
VLRS Консенсус аналітиків Бичачі та ведмежі думки аналітиків, 12-місячна цільова ціна, потенціал зростання
12-місячна цільова ціна
13 аналітиків · 2026-10-02Середня цільова ціна $9.46 +45,8%
Порівняння з аналогами (підгалузь GICS) Ключові показники порівняно з аналогами в секторі
База за фінансовий рік, ціни на момент закриття останнього фінансового року кожної компанії.
| Тікер | Капіталізація | P/E | Виручка рік до року | Чиста маржа | ROE | Валова маржа |
|---|---|---|---|---|---|---|
| VLRS | · | -98.7 | · | · | -33.1% | · |
| AERO | · | 91.5 | · | 6.6% | -47.0% | · |
Мої показники Ваш персональний список спостереження — вибрані рядки з Повних фундаментальних даних
Виберіть показники, які для вас важливі — натисніть + поруч із будь-яким рядком у розділі Повна фундаментальна інформація вище.
Ваш вибір збережено і він буде застосовуватися до всіх тікерів.