
EDN Empresa Distribuidora Y Comercializadora Norte S.A. (Edenor) American Depositary Shares
NYSE · Utilities · 在 SEC EDGAR 上查看 ↗ 收盘 十月 2, 2026 10-K/10-Q 四月 15, 2026EDN 股票快照 价格、市值、P/E、EPS、ROE、负债/权益、52周范围
EDN 股价图表 包含技术指标的日 OHLCV — 平移、缩放和自定义您的视图
柱状图粒度会根据所选周期进行调整 — 将鼠标悬停在图表上可查看柱状图的开盘价/最高价/最低价/收盘价。
关于 Empresa Distribuidora Y Comercializadora Norte S.A. (Edenor) American Depositary Shares 公司概况(来自维基百科)
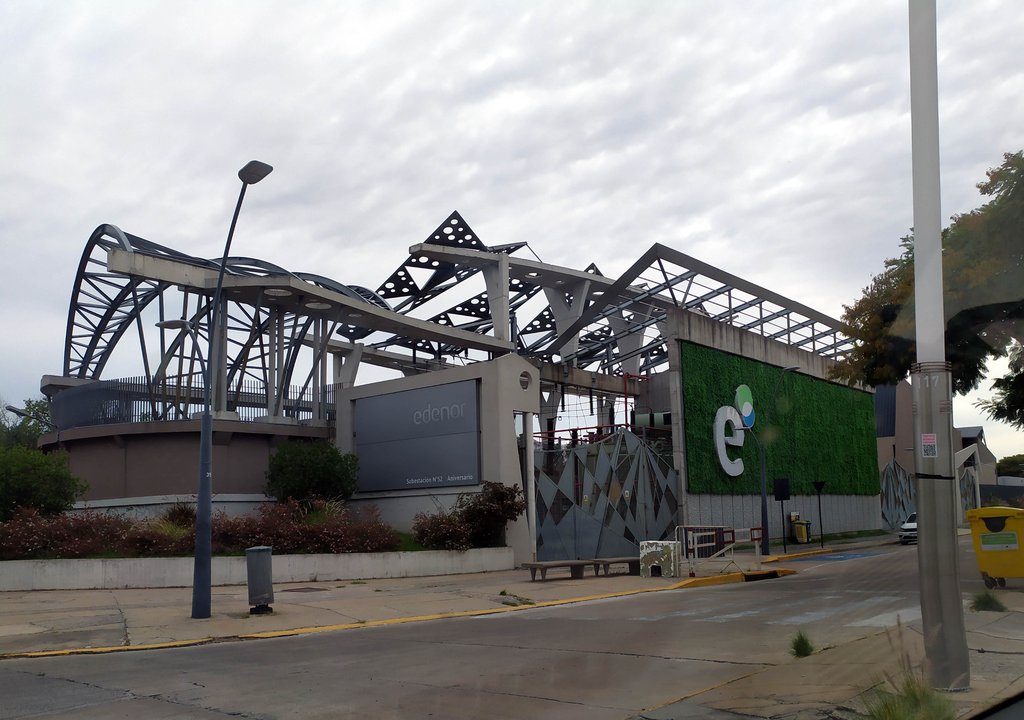
Edenor is a public Argentine electricity distribution company founded in 1992 and headquartered in Buenos Aires. The company has an exclusive concession to distribute electricity in the northwestern section of Greater Buenos Aires, and in the north of Buenos Aires proper, selling electric power to residential, commercial, industrial, and government customers.
Edenor's 34,500 kilometers of network and 2.5 million customers represent 18.5% of the Argentine market in its industry.
History
Edenor was established on July 21, 1992, as part of the broader privatization of Servicios Eléctricos del Gran Buenos Aires S.A. (SEGBA), a state-owned entity responsible for electricity distribution in Buenos Aires. SEGBA was split into three distribution companies—Edenor, Edesur, and Edelap—as well as several generation companies. This restructuring was intended to promote competition and efficiency in the sector.
EDF International S.A., was among the international investors that acquired a controlling interest in Edenor through an Argentine holding company named EASA. The concession agreement granted to Edenor was set for 95 years, lasting until 2087. By September 1992, EASA had secured a majority shareholding in the company.
In the early 1990s, Edenor faced significant challenges, particularly with electricity theft, which was rampant in certain areas, especially in shantytowns. The company attempted to mitigate these losses by installing automatic circuit breakers to regulate power usage. However, community and political activists put up opposition, resulting in compromises that allowed people to continue using electricity while trying to limit usage of high-energy appliances.
The 2000s were a period of significant change for Edenor. During this decade, ownership of the company changed hands several times. In 2002, EDF sold a majority stake to the Dolphin Group, which later became part of the Grupo Emes. This group eventually integrated Edenor into Pampa Energía S.A., a major player in Argentina's energy sector.
In the 2010s, Edenor responded to regulation changes and tried to modernize its operations. The Argentine government implemented a Comprehensive Tariff Review in 2017, adjusting electricity rates to reflect operational costs more accurately. This process included public hearings and aimed to address the financial instability of the sector, which had been affected by currency devaluation and inflation.
Edenor also embraced digital transformation during this period, launching the Edenor Digital platform in 2017. This platform, accessible via a website and mobile application, enabled customers to manage their accounts, view and pay bills, and monitor electricity consumption online. The company's modernization efforts also extended to sustainability, as Edenor adopted the United Nations Sustainable Development Goals in 2017 and began piloting renewable energy initiatives.
Financial activity
For the period ending September 30, 2024, Edenor reported a profit of ARS 235,069 million attributable to its shareholders. The company’s total equity was recorded at ARS 1,119,525 million.
In October 2024, Edenor completed a private exchange offer for its 9.75% Senior Notes due 2025. As part of the transaction, the company issued new 9.75% Senior Notes maturing in 2030, with approximately 85.12% of the existing notes tendered and accepted in the exchange. Additionally, Edenor issued an extra US$135 million in new notes.
In November 2024, Fitch Ratings upgraded Edenor’s Foreign and Local Currency Issuer Default Ratings from CCC to CCC+. The company’s bonds were also raised to a B− rating, accompanied by an improved Recovery Rating of RR3.
Edenor shareholder José Luis Manzano, along with partners Daniel Vila and Mauricio Filiberti, agreed in 2026 to buy YPF's roughly 70% stake in Metrogas and MetroEnergía for US $780 million, following a competitive sale process run by Citigroup on YPF's behalf. The deal gave Manzano control of Argentina's largest gas distributor, adding to a 9.23% stake he already held through Integra Gas Distribution, and extended his energy holdings beyond his position in Edenor. The sale was part of YPF's broader strategy under CEO Horacio Marín to divest non-core assets and concentrate investment in Vaca Muerto oil and gas development.
Renewable energy
In March 2018, Edenor became the first company in Argentina to purchase a fully electric vehicle, adding the Renault Kangoo ZE to its fleet in Buenos Aires.
That same year, the company started testing small-scale power generation systems with energy consumption between 10 and 50 kW in Buenos Aires City and Greater Buenos Aires.
Edenor also installed solar panels at their building on Avenida Andrés Rolón in San Isidro, which allowed them to generate and feed electricity back into the grid.
== References ==
来源:维基百科 (英语), CC BY-SA 4.0 · 在维基百科上查看 ↗
10年表现 收入、净利润、利润率和每股收益趋势
估值 P/E、P/S、P/B、EV/EBITDA 比率 — 该股票是昂贵还是便宜?
| 指标 | 5年趋势 | EDN | 5年均值 | 同行中位数 | 结论 |
|---|---|---|---|---|---|
| P/E | 0.15年均值 ≈0.0 | ≈0.0 | · | · |
同行中位数按每项指标的标准化基础计算,可能与本股票显示的TTM/MRQ基础不完全匹配。
盈利能力 毛利率、营业利润率和净利率;股本回报率 (ROE)、资产回报率 (ROA)、投入资本回报率 (ROIC)
| 指标 | 5年趋势 | EDN | 5年均值 | 同行中位数 | 结论 |
|---|---|---|---|---|---|
| Gross Margin (毛利率) | 22.8%5年均值 ≈12.5% | ≈12.5% | · | · | |
| Operating Margin (营业利润率) | 4.8%5年均值 ≈-5.9% | ≈-5.9% | · | · | |
| EBITDA Margin (息税折旧摊销前利润率) | 11.6%5年均值 ≈2.7% | ≈2.7% | · | · | |
| Pretax Margin (税前利润率) | 9.7%5年均值 ≈7.8% | ≈7.8% | · | · | |
| Net Profit Margin (净利润率) | 8.0%5年均值 ≈0.17% | ≈0.17% | · | · | |
| ROA | 4.4%5年均值 ≈0.19% | ≈0.19% | · | · | |
| ROE | 11.4%5年均值 ≈4.9% | ≈4.9% | · | · | |
| ROIC | 5.3%5年均值 ≈-37.0% | ≈-37.0% | · | · |
财务健康 债务、流动性、偿付能力 — 资产负债表强度
| 指标 | 5年趋势 | EDN | 5年均值 | 同行中位数 | 结论 |
|---|---|---|---|---|---|
| Current Ratio (流动比率) | 1.15年均值 ≈0.7 | ≈0.7 | · | · | |
| Quick Ratio (速动比率) | 0.45年均值 ≈0.3 | ≈0.3 | · | · | |
| Interest Coverage (利息保障倍数) | 0.55年均值 ≈0.0 | ≈0.0 | · | · |
成长 营收、每股收益 (EPS) 和净利润增长:同比、3年复合年增长率 (CAGR)、5年复合年增长率 (CAGR)
基本面数据不足,尚无法计算此比率组。
资本效率 资产周转率、库存周转率、应收账款周转率
| 指标 | 5年趋势 | EDN | 5年均值 | 同行中位数 | 结论 |
|---|---|---|---|---|---|
| Asset Turnover (资产周转率) | 0.55年均值 ≈0.5 | ≈0.5 | · | · | |
| Receivables Turnover (应收账款周转率) | 6.05年均值 ≈6.4 | ≈6.4 | · | · | |
| Revenue / Employee (年营业收入 ÷ 员工人数(报告的 headcount,yfinance)。衍生数据 — 非存储的 SEC-XBRL 概念。) | ≈$653.6M | · | · | · |
价值 · ≈ 5年均值 · 行业中值 · 相对于中值的评判
收益历史 每股收益实际值 vs 预估值,惊喜%,达标率,下次财报日期
| 期间 | 报告 | EPS Actual | EPS 预期 | 惊喜 |
|---|---|---|---|---|
| 2024年12月31日 | $42.35 | $-4.24 | 1098.3% | |
| 2024年9月30日 | $130.79 | $-0.40 | 32473.8% | |
| 2024年6月30日 | $54.02 | $-2.34 | 2405.4% | |
| 2024年3月31日 | $58.13 | $-2.51 | 2411.4% | |
| 2023年12月31日 | $-5.20 | $-3.85 | -35.1% | |
| 2023年3月31日 | $-272.87 | — | — |
完整基本面 所有年度指标 — 损益表、资产负债表、现金流量表
损益表
| 指标 | 趋势 | 2025 | 2024 | 2023 | 2022 | 2021 | 2020 | 2019 | 2018 | 2017 | 2016 |
|---|---|---|---|---|---|---|---|---|---|---|---|
| Revenue | $2.99T | $2.69T | $2.01T | $1.40T | $688.50B | $268.39B | $184.74B | $117.12B | $60.90B | $25.83B | |
| Gross Profit | $680.58B | $519.09B | $79.42B | $50.82B | $88.49B | $39.74B | $34.41B | $27.56B | $14.66B | $573M | |
| Operating Income | $143.14B | $55.35B | $-343.14B | $-211.91B | $-26.67B | $-58.53B | $9.76B | $9.48B | $3.65B | $-2.79B | |
| Interest Expense | $313.71B | $447.81B | $915.07B | $595.22B | $163.54B | $27.26B | $-13.89B | $10.42B | $3.95B | $2.59B | |
| Interest Income | $1.80B | $1.61B | $1.05B | $442M | $395M | $162M | $118M | $176M | $698M | $385M | |
| Pretax Income | $291.33B | $254.26B | $521.88B | $-17.88B | $-34.63B | $-62.49B | $46.85B | $12.93B | $8.60B | $388M | |
| Income Tax | $52.10B | $-103.72B | $270.11B | $26.14B | $94.84B | $-10.47B | $21.92B | $3.93B | $784M | $147M | |
| Net Income | $240.38B | $360.97B | $249.07B | $-46.90B | $-128.69B | $-51.79B | $24.91B | $8.99B | $7.84B | $250M | |
| EPS (Basic) | $273.41 | $409.12 | $287.73 | $-50.30 | $-147.97 | $-59.45 | $18.88 | $10.11 | · | · | |
| EPS (Diluted) | $273.41 | $409.12 | $287.73 | $-50.30 | $-147.97 | · | · | · | · | · | |
| Shares (Diluted) | 875,000,000 | 875,000,000 | 875,000,000 | 875,000,000 | 875,000,000 | 875 | 875,000,000 | 890 | 898,280,000 | 897,043,000 | |
| EBITDA | $346.41B | $196.63B | $-37.03B | $-13.06B | $4.70B | $-13.41B | $3.60B | $3.94B | $2.49B | · |
资产负债表
| 指标 | 趋势 | 2025 | 2024 | 2023 | 2022 | 2021 | 2020 | 2019 | 2018 | 2017 | 2016 |
|---|---|---|---|---|---|---|---|---|---|---|---|
| Cash & Equivalents | $136.91B | $26.55B | $4.00B | $2.70B | $2.96B | $2.47B | $218M | $42M | $-375M | $259M | |
| Receivables | $496.26B | $506.77B | $145.02B | $189.82B | $34.21B | $21.35B | $16.96B | $11.67B | $8.39B | $3.90B | |
| Inventory | $233.31B | $197.02B | $86.70B | $43.66B | $6.70B | $2.82B | $2.62B | $1.94B | $650M | $288M | |
| Current Assets | $1.56T | $1.27T | $505.68B | $565.97B | $81.82B | $35.17B | $24.33B | $21.08B | $13.75B | $6.62B | |
| PP&E (Net) | $4.13T | $3.95T | $3.65T | $2.69T | $1.19T | $367.14B | $208.06B | $130.77B | $119.44B | $50.89B | |
| Total Assets | $5.76T | $5.24T | $3.29T | $3.26T | $463.27B | $224.51B | $162.63B | $118.39B | $70.88B | $18.93B | |
| Accounts Payable | $527.05B | $998.15B | $524.70B | $1.22T | $148.39B | $33.02B | $17.29B | $22.46B | $13.58B | $6.82B | |
| Current Liabilities | $1.46T | $1.43T | $774.64B | $1.35T | $189.96B | $63.62B | $33.46B | $32.26B | $18.52B | $9.56B | |
| Total Liabilities | $3.54T | $3.25T | $2.05T | $2.21T | $319.72B | $129.61B | $82.11B | $70.77B | $43.09B | $18.57B | |
| Retained Earnings | $239.24B | $334.25B | $-18.04B | $-209.43B | $-41.58B | $-26.70B | $16.52B | $20.32B | $8.98B | $-1.19B | |
| Stockholders' Equity | $2.22T | $1.98T | $1.62T | $1.37T | $1.09T | $575.68B | $236.66B | $97.81B | $58.18B | $34.88B |
现金流
| 指标 | 趋势 | 2025 | 2024 | 2023 | 2022 | 2021 | 2020 | 2019 | 2018 | 2017 | 2016 |
|---|---|---|---|---|---|---|---|---|---|---|---|
| D&A | $203.27B | $203.32B | $237.06B | $123.38B | $55.21B | $19.11B | $9.50B | $5.36B | · | · | |
| Other Non-cash | $-251.62B | $-183.04B | $-58.71B | $35.13B | $33.46B | $28.45B | · | · | · | · | |
| Operating Cash Flow | $192.04B | $323.50B | $204.74B | $240.24B | $129.50B | $50.94B | $20.87B | $20.14B | $11.17B | $4.97B | |
| CapEx | $368.47B | $473.53B | $343.13B | $215.14B | $89.33B | $28.94B | $19.25B | $17.31B | $12.14B | $4.23B | |
| Investing Cash Flow | $-461.55B | $-746.20B | $-226.48B | $-253.35B | $-154.96B | $-36.60B | $-4.53B | $-17.43B | $-13.08B | $-4.07B | |
| Financing Cash Flow | $435.08B | $348.84B | $21.02B | $-32.29B | $-8.72B | $-18.08B | $-10.42B | $-4.39B | $1.33B | $-947M | |
| Free Cash Flow | $-176.43B | $-114.05B | $-48.31B | $3.70B | $6.62B | $7.49B | $788M | $1.35B | $-349M | · | |
| Levered FCF | $-434.04B | $-593.34B | $-133.12B | $-578.39B | $107.44B | $-232M | $-2.81B | $-2.11B | $587M | · |
盈利能力
| 指标 | 趋势 | 2025 | 2024 | 2023 | 2022 | 2021 | 2020 | 2019 | 2018 | 2017 | 2016 |
|---|---|---|---|---|---|---|---|---|---|---|---|
| Gross Margin | 22.8% | 19.3% | 4.0% | 3.7% | 12.8% | 14.8% | 18.6% | 23.5% | 27.5% | · | |
| Operating Margin | 4.8% | 2.1% | -17.1% | -15.2% | -3.9% | -21.8% | 4.0% | 7.0% | 10.2% | · | |
| Net Margin | 8.0% | 13.4% | 6.8% | -8.7% | -18.7% | -19.3% | 13.5% | 7.7% | 2.8% | · | |
| Pretax Margin | 9.7% | 9.5% | 26.0% | -1.3% | -5.0% | -23.3% | 25.4% | 11.0% | 4.6% | · | |
| EBITDA Margin | 11.6% | 9.6% | -5.3% | -6.3% | 4.1% | -14.7% | 4.0% | 7.0% | 10.2% | · | |
| ROA | 4.4% | 7.5% | 2.0% | -3.8% | -9.2% | -11.3% | 10.2% | 5.8% | 3.1% | · | |
| ROE | 11.4% | 17.5% | 5.2% | -2.9% | -6.5% | -11.8% | 15.4% | 9.6% | 3.9% | · | |
| ROIC | 5.3% | 3.9% | -7.2% | -164.9% | -22.3% | -26.4% | 3.2% | 8.9% | 142.8% | · |
流动性与偿付能力
| 指标 | 趋势 | 2025 | 2024 | 2023 | 2022 | 2021 | 2020 | 2019 | 2018 | 2017 | 2016 |
|---|---|---|---|---|---|---|---|---|---|---|---|
| Current Ratio | 1.1 | 0.9 | 0.7 | 0.4 | 0.4 | 0.6 | 0.7 | 0.7 | 0.7 | · | |
| Quick Ratio | 0.4 | 0.4 | 0.2 | 0.1 | 0.2 | 0.4 | 0.5 | 0.4 | 0.5 | · | |
| Interest Coverage | 0.5 | 0.1 | -0.4 | -0.4 | 0.2 | -2.1 | 0.5 | 0.8 | -1.6 | · |
效率
| 指标 | 趋势 | 2025 | 2024 | 2023 | 2022 | 2021 | 2020 | 2019 | 2018 | 2017 | 2016 |
|---|---|---|---|---|---|---|---|---|---|---|---|
| Asset Turnover | 0.5 | 0.6 | 0.3 | 0.4 | 0.5 | 0.6 | 0.8 | 0.8 | 1.1 | · | |
| Receivables Turnover | 6.0 | 8.1 | 5.5 | 6.6 | 5.8 | 5.9 | 7.5 | 7.0 | 5.1 | · |
每股
| 指标 | 趋势 | 2025 | 2024 | 2023 | 2022 | 2021 | 2020 | 2019 | 2018 | 2017 | 2016 |
|---|---|---|---|---|---|---|---|---|---|---|---|
| Revenue / Share | $3418.16 | $2335.00 | $801.25 | $235240000.00 | $129.71 | $104361142.86 | $102.59 | $62.83 | · | · | |
| Cash Flow / Share | $219.47 | $281.05 | $81.68 | $40486857.14 | $24.40 | $19812571.43 | $11.59 | $10.80 | · | · | |
| EPS (TTM) | $273.41 | $409.12 | $287.73 | $-50.30 | $-147.97 | · | · | · | · | · |
估值 (TTM)
| 指标 | 趋势 | 2025 | 2024 | 2023 | 2022 | 2021 | 2020 | 2019 | 2018 | 2017 | 2016 |
|---|---|---|---|---|---|---|---|---|---|---|---|
| Revenue TTM | $2.99T | $2.69T | $2.01T | $1.40T | $688.50B | $268.39B | $184.74B | $117.12B | $60.90B | · | |
| Net Income TTM | $240.38B | $360.97B | $249.07B | $-46.90B | $-128.69B | $-51.79B | $24.91B | $8.99B | $7.84B | · | |
| P/E | 0.1 | 0.1 | 0.1 | -0.2 | -0.0 | · | · | · | · | · | |
| Earnings Yield | 912.6% | 953.4% | 1485.4% | -629.5% | -2791.9% | · | · | · | · | · |
估值 (TTM)
| 指标 | 趋势 | Q4 2017 | Q4 2016 | Q4 2015 | Q4 2014 | Q4 2013 | Q4 2012 | Q4 2011 | Q4 2010 | Q4 2009 | Q4 2008 | Q4 2007 |
|---|---|---|---|---|---|---|---|---|---|---|---|---|
| Revenue TTM | $60.90B | $25.83B | $3.80B | · | · | · | · | · | · | · | · | |
| Net Income TTM | $7.84B | $250M | $1.14B | · | · | · | · | · | · | · | · |
最近期在左侧 · 空值显示为 ·
财务报表 损益表、资产负债表、现金流量表 — 年度,近5年
| 指标 | 2025-12-31 | 2024-12-31 | 2023-12-31 | 2022-12-31 | 2021-12-31 |
|---|---|---|---|---|---|
| 收入 | $2.99T | $2.69T | $2.01T | $1.40T | $688.50B |
| 毛利率 % | 22.8% | 19.3% | 4.0% | 3.7% | 12.8% |
| 营业利润率 % | 4.8% | 2.1% | -17.1% | -15.2% | -3.9% |
| 净收入 | $240.38B | $360.97B | $249.07B | $-46.90B | $-128.69B |
| 稀释后每股收益 (EPS) | $273.41 | $409.12 | $287.73 | $-50.30 | $-147.97 |
| 指标 | 2025-12-31 | 2024-12-31 | 2023-12-31 | 2022-12-31 | 2021-12-31 |
|---|---|---|---|---|---|
| 流动比率 | 1.1 | 0.9 | 0.7 | 0.4 | 0.4 |
| 速动比率 | 0.4 | 0.4 | 0.2 | 0.1 | 0.2 |
| 指标 | 2025-12-31 | 2024-12-31 | 2023-12-31 | 2022-12-31 | 2021-12-31 |
|---|---|---|---|---|---|
| 自由现金流 | $-176.43B | $-114.05B | $-48.31B | $3.70B | $6.62B |
机构持有人 (13F) 28 家申报者 · $48.4M 总计 · 截至 2026年6月30日
在其季度SEC表格13F中报告持有此股票的机构。仅限多头头寸;单个申报人可能因单独的期权腿而出现两次。 大的抵消性看跌/看涨腿通常反映做市或对冲库存,而非方向性判断。
| 新仓位 | 已退出持仓 | 增加 | 减少 | 净股数变动 |
|---|---|---|---|---|
| 8 (+2 与上一季度对比) | 8 (+4 与上一季度对比) | 6 (-4 与上一季度对比) | 8 (+2 与上一季度对比) | -408K |
与Q1 2026对比。 SEC 13F表格的提交截止日期是季度末后45天,外加少量延迟提交的缓冲期——在此窗口期内的季度将被跳过,优先显示最近一个已完整报告的季度对。
激进投资者及 5%+ 股东 1 持仓
提交了 SEC Schedule 13D 的投资者 — 持有超过 5% 的受益所有权,意图影响发行人(激进股东持股、董事会活动、并购)。每一行显示该申报人持仓的最新已知状态。
| 申报人 | 已申报 | 持股 | 状态 | 目的 | 申报 |
|---|---|---|---|---|---|
| Pampa Inversiones S.A., Pampa Energía S.A. (Pampa Energy Inc.) ×6 申报 | 2013年12月11日 | · | 初始申报 | · | SEC |
Purpose is an automated classification of the filer's own stated purpose (SEC Item 4) — not investment advice. "—" means no clear purpose was stated or the text could not be classified.
ETF持仓 由 1 只交易所交易基金持有
权重仅反映直接股权持仓(N-PORT);杠杆基金或基于衍生品的基金可能持有未显示的额外掉期敞口。
| 基金 | 权重 | 单位 | 截至 | 来源 |
|---|---|---|---|---|
| ARGT · Global X Funds | 1.75% | 552507 NS | 2026年7月31日 | N-PORT |
EDN 分析师共识 看涨和看跌分析师观点、12个月价格目标、上涨空间
12个月价格目标
2 位分析师 · 2026-10-03平均目标 $38.50 +93.1%
我的指标 您的个人关注列表 — 来自完整基本面的选定行
选择对您重要的指标 — 点击上方完整基本面中任意行的 + 号。
您的选择已保存,并会跟随您浏览所有股票。