
ACM AECOM Common Stock
NYSE · Construction · Visualizza su SEC EDGAR ↗ 10-K/10-Q Ago 11, 2026ACM Snapshot del titolo Prezzo, capitalizzazione di mercato, P/E, EPS, ROE, debito/capitale proprio, intervallo 52 settimane
ACM Grafico del prezzo delle azioni OHLCV giornaliero con indicatori tecnici — panoramica, zoom e personalizza la tua visualizzazione
La granularità delle barre si adatta al periodo selezionato — passa il mouse sul grafico per vedere apertura/massimo/minimo/chiusura di una barra.
Informazioni su AECOM Common Stock Panoramica della società da Wikipedia
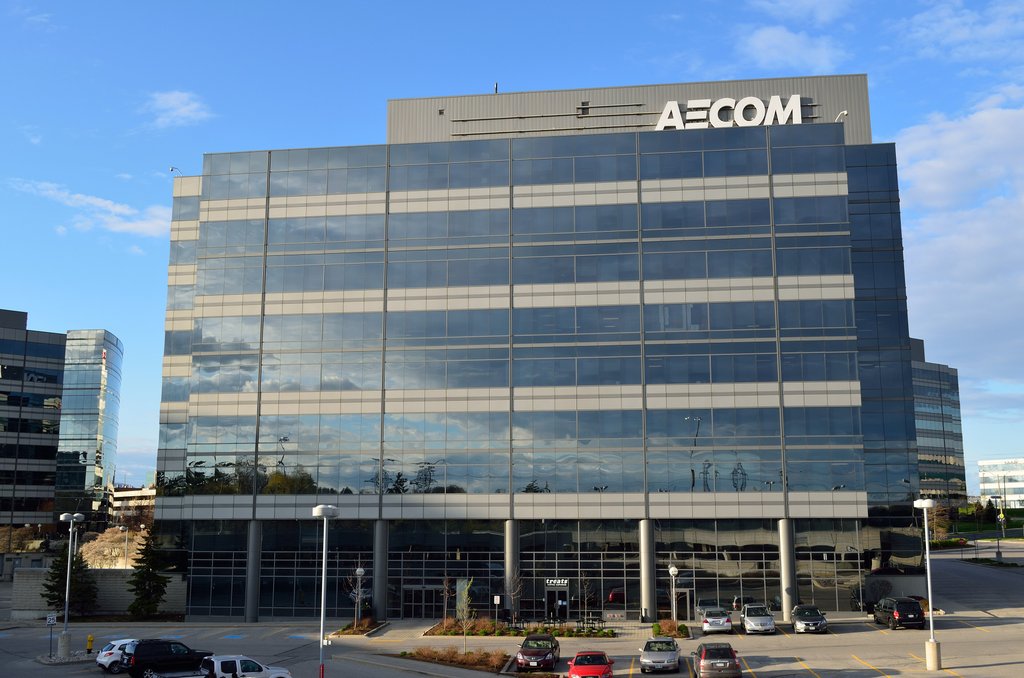
AECOM (, ay-ee-KOM; formerly AECOM Technology Corporation) is an American multinational infrastructure consulting firm headquartered in Dallas, Texas.
The company's official name from 1990 to 2015 was AECOM Technology Corporation, and is now AECOM. The company is listed on the New York Stock Exchange (NYSE) under the ticker symbol ACM.
As of 2023, AECOM had approximately 51,000 employees, and was number 291 on the 2023 Fortune 500 list.
History
1910–1990
AECOM traces its origins to Kentucky-based Ashland Oil & Refining Company, which in turn grew out of Swiss Drilling Company, founded in Oklahoma in 1910 by J. Fred Miles. He gained control of some 200,000 acres and formed Swiss Oil Company in Lexington. In 1924, Miles launched a refining operation called Ashland Refining Company, headed by Paul Blazer. While the parent company struggled, leading to the ouster of Miles, Ashland prospered under Blazer's leadership, and in 1936, he was named chief executive officer of the reorganized company, Ashland Oil & Refining Company. In 1966, Ashland acquired Warren Brothers and became involved in highway construction and construction materials. The company was able to take advantage of refinery byproducts to produce asphalt. Ashland grew into one of the nation's major road-construction firms, and laid a foundation for AECOM. Through a series of acquisitions and technological developments, Ashland grew to include chemical, petrochemical, highway construction, and construction materials firms within its realm, laying the groundwork for a management buyout of Ashland Technology in 1985.
In the 1970s, Ashland Oil & Refining became Ashland Oil, Inc. Five years later the company consolidated its construction assets into a construction division and also formed a coal company subsidiary, indicative of a changing focus at Ashland. Although it generated more than $1 billion a year in sales, Ashland was a small player in the oil industry at a time when the cost of exploration was prohibitively expensive. By 1980, Ashland sold its production assets, and a year later was reorganized as a modified holding company. A new corporate strategy was implemented as Ashland now focused on refining and marketing and sought to grow its non-refining businesses.
In 1984, Ashland acquired Daniel, Mann, Johnson & Mendenhall (DMJM), an architectural firm located in Los Angeles, California. Originally focused on military architecture projects, after World War II it had become one of the first integrated engineering and architectural firms in the western United States. The acquisition of DMJM also included its president, Richard G. Newman. In 1985, DMJM became part of a new subsidiary, Ashland Technology Corporation. Two years later Newman was named its new chief executive and president.
When Ashland chose to return to its core petroleum refining business in the late 1980s, Newman recommended an employee buyback proposal, resulting in the spin-off of Ashland Technology and the creation of AECOM (Architecture, Engineering, Construction, Operations, and Management) in 1990. The company went on to acquire a number of engineering, design and planning firms including urbanism/sustainability practice EDAW, consultancy firm Economic Research Associates (ERA), environmental firms ENSR and The RETEC Group, architectural firm Ellerbe Becket and construction consultants Davis Langdon.
2000–present
In 2000, AECOM acquired Metcalf and Eddy, a water and wastewater engineering firm based in Massachusetts and London-based Guy Maunsell International, expanding the firm's reach in the United Kingdom, Hong Kong/China, Australia and the Middle East. In 2003, AECOM developed an award-winning landscape plan for Jinji Lake in Suzhou Industrial Park; the lake was developed from a shallow and marshy pond into one of the largest lake front parks in China.
In September 2004, it acquired the Canadian company, UMA Engineering Ltd. ENSR and EDAW joined AECOM in 2005.
AECOM went public during May 2007 with an initial public offering on the NYSE, netting $468.3 million. In January 2008, AECOM acquired The Services Group, Inc., a provider of consulting services to the US Agency for International Development (USAID) and other multi-lateral donor organizations. In July 2008, AECOM purchased Earth Tech Inc., a consulting and engineering firm, from Tyco International for $510 million. On July 14, 2010, AECOM announced its acquisition of Tishman Construction Corp., a leading provider of construction management services in the United States, whose projects include both the building of the original Twin Towers in New York City in 1973 and One World Trade Center (Freedom Tower) in the aftermath of 9/11. On July 13, 2014, AECOM announced its acquisition of URS Corporation, an engineering, construction, and technical services firm for US$56.31 per share in cash and stock, pegging the enterprise value of URS at approximately $6 billion. Effective July 10, 2014, it acquired ACE International Consultants SL, a Madrid-based provider of consulting services. In July 2014, it acquired Hunt Construction Group, adding to AECOM's construction services business. In July 2017, AECOM acquired Shimmick Construction Company. Officials at the Golden Gate Bridge, Highway and Transportation District blamed the acquisition for delaying construction of a safety barrier at the bridge by 2 years.
In 2018, AECOM along with 91 additional Fortune 500 companies had "paid an effective federal tax rate of 0% or less" as a result of Donald Trump's Tax Cuts and Jobs Act of 2017.
In October 2019, AECOM announced plans to sell their Management Services division to private equity firm American Securities LLC and Lindsay Goldberg for $2.405 billion. Management Services provides services and support to governmental clients including the Department of Energy and Department of Defense. On January 31, 2020, this transaction was completed with the new company being called Amentum. In October 2020, AECOM announced the sale of its Power construction business to private equity firm CriticalPoint Capital. In December 2020, AECOM announced the sale of its Civil construction business, including Shimmick Construction, to private equity firm Oroco Capital, which completed January 5, 2021. AECOM explained these divestitures as a "transformation into a higher-margin, lower-risk Professional Services business".
In August 2021, AECOM announced plans to relocate its global headquarters from Los Angeles, California to Dallas, Texas.
In 2025, AECOM acquired Norway-based artificial intelligence start-up company Consigli.
Services
AECOM provides Archaeology, Architecture & Design, Urban Planning, Landscape Architecture, Asset Management, Construction, Cost Management, Decommissioning & Closure, Economics, Engineering, Environmental Services, International Development, IT & Cyber Security, Operations & Maintenance, Planning & Consulting, Program Management/Construction Management, Risk Management & Resilience and Technical Services.
Management
AECOM's first president and CEO was Richard G. Newman, who came to Ashland through its acquisition of Daniel, Mann, Johnson & Mendenhall (DMJM). Under Ashland Oil's ownership, he was president and chief operating officer of DMJM from October 1985 to December 1988. While president of Ashland Technology Corp. from December 1988 until May 1990, Newman was instrumental in taking it from a division of Ashland Oil to an independent company. He was president when the company changed its name to AECOM Technology Corporation in April 1990. Newman was president until 1993, and then chairman, president and CEO from May 1993 to October 2000, and chairman and CEO from 2000 to 2005.
In October 2005, John M. Dionisio succeeded Newman as president and CEO of AECOM. In 2011, Dionisio became chairman of the company, having been COO from October 2003 to October 2005 and president and CEO of the subsidiary DMJM+Harris from October 2000 to October 2003.
In October 2011, Michael S. Burke succeeded Dionisio as president and then in March 2014 succeeded him as CEO. Burke joined AECOM in 2005 and was appointed CFO in 2006.
In 2011, Stephen M. Kadenacy was named chief financial officer, later promoted to president and COO. In 2017, Kadenacy left the company and was succeeded as COO by Randy Wotring.
In November 2019, AECOM announced that Burke would retire as chairman and CEO. The change was announced to be effective after either the next annual meeting or completion of the search for a replacement. At the same time, AECOM said that the board of directors would be expanded to include representatives of activist-shareholder Starboard Value, the fifth largest shareholder. Amid market speculation that AECOM would be acquired by WSP Global, AECOM announced the selection of W. Troy Rudd to be CEO. The change will be effective as of October 1, 2020. Before his appointment as CEO, Rudd was CFO for the company. The announcement included naming Lara Poloni as the new president. The announcement resulted in the resignation of the Starboard Value board member in protest over the selection. AECOM was included on Fortune's list of the world's most admired companies in 2024.
As of April 2026, key leadership were:
Troy Rudd, Chairman and Chief Executive Officer
Lara Poloni, President
Gaurav Kapoor, Chief Financial & Operations Officer
David Gan, Chief Legal Officer
Emily Gepner, Chief Human Resources Officer
Corporate affairs
AECOM is headquartered in Dallas, Texas, United States, with clients in more than 150 countries. The company reported revenue of US$16.1 billion during the 12 months that ended September 30, 2025.
Fonte: Wikipedia (Inglese), CC BY-SA 4.0 · Vedi su Wikipedia ↗
Performance decennale Andamento di ricavi, utile netto, margini e EPS
Valutazione Rapporti P/E, P/S, P/B, EV/EBITDA — il titolo è costoso o economico?
| Metrica | Tendenza 5 anni | ACM | media 5 anni | Mediana dei peer | Verdetto |
|---|---|---|---|---|---|
| P/E (TTM) | 27.9 | · | 34.6 | Sottovalutato | |
| P/S | 0.5 | · | 2.0 | Sottovalutato | |
| P/B | 3.1 | · | 6.4 | Valore equo | |
| EV / EBITDA | 5.2 | · | 19.2 | Sottovalutato | |
| Price / FCF (Prezzo / FCF) | 11.4 | · | · | · | |
| Price / Cash Flow (Prezzo / Flusso di cassa) | 9.5 | · | 21.0 | Valore equo | |
| EV / Revenue (EV / Ricavi) | 0.4 | · | · | · | |
| EV / FCF | 9.1 | · | · | · |
La mediana dei peer viene calcolata su base standardizzata per metrica e potrebbe non corrispondere sempre alla base TTM/MRQ mostrata per questo titolo.
Redditività Margini lordi, operativi e netti; ROE, ROA, ROIC
| Metrica | Tendenza 5 anni | ACM | media 5 anni | Mediana dei peer | Verdetto |
|---|---|---|---|---|---|
| Margine lordo (TTM) | 5.7% | · | 24.2% | Debole | |
| Margine Operativo (TTM) | 4.1% | · | 7.8% | Debole | |
| Margine EBITDA (TTM) | 5.5% | · | 7.9% | Debole | |
| Margine ante imposte (TTM) | 3.4% | · | 6.5% | Debole | |
| Margine di Profitto Netto (TTM) | 1.9% | · | 5.2% | Debole | |
| ROA | 4.6% | · | 4.7% | In linea | |
| ROE | 24.0% | · | 15.2% | Di prim'ordine | |
| ROIC | 31.9% | · | 13.5% | Di prim'ordine |
Salute finanziaria Debito, liquidità, solvibilità — solidità del bilancio
| Metrica | Tendenza 5 anni | ACM | media 5 anni | Mediana dei peer | Verdetto |
|---|---|---|---|---|---|
| Debt / Equity (Debito / Patrimonio Netto) | 0.0 | · | 0.3 | Basso indebitamento | |
| Current Ratio (Rapporto corrente) | 1.1 | · | 1.5 | Bassa liquidità | |
| Quick Ratio | 0.7 | · | 1.0 | Bassa liquidità |
Crescita Crescita di ricavi, EPS e utile netto: YoY, CAGR 3Y, CAGR 5Y
| Metrica | Tendenza 5 anni | ACM | media 5 anni | Mediana dei peer | Verdetto |
|---|---|---|---|---|---|
| Revenue YoY (Ricavi YoY) | 0.21% | · | · | · | |
| Revenue CAGR 3Y (CAGR Ricavi 3Y) | 7.1% | · | · | · | |
| Revenue CAGR 5Y (CAGR Ricavi 5Y) | 4.0% | · | · | · | |
| EPS YoY | 42.7% | · | · | · | |
| Net Income YoY (Utile Netto YoY) | 39.6% | · | · | · | |
| EPS CAGR 3Y (CAGR EPS 3 anni) | 24.5% | · | · | · | |
| Net Income CAGR 3Y (CAGR Utile Netto 3 anni) | 21.8% | · | · | · |
Efficienza del Capitale Rotazione delle attività, rotazione delle scorte, rotazione dei crediti
| Metrica | Tendenza 5 anni | ACM | media 5 anni | Mediana dei peer | Verdetto |
|---|---|---|---|---|---|
| Asset Turnover (Rotazione delle attività) | 1.3 | · | 1.3 | In linea | |
| Receivables Turnover (Rotazione dei crediti) | 6.1 | · | 6.3 | In linea | |
| Revenue / Employee (Ricavi / Dipendente) | ≈$316.5K | · | · | · |
valore · ≈ media 5 anni · mediana del settore · giudizio rispetto alla mediana
Dividendi Rendimento, payout ratio, storico dividendi, CAGR 5Y
| Data ex-dividendo | Importo | Valuta | Rendimento |
|---|---|---|---|
| Ott 14, 2026 | $0,31 | USD | ≈2.1% |
| Lug 1, 2026 | $0,31 | USD | ≈1.8% |
| Apr 1, 2026 | $0,31 | USD | ≈1.3% |
| Gen 7, 2026 | $0,31 | USD | ≈1.1% |
| Ott 1, 2025 | $0,26 | USD | ≈0.80% |
| Lug 2, 2025 | $0,26 | USD | ≈0.87% |
| Apr 2, 2025 | $0,26 | USD | ≈1.0% |
| Gen 2, 2025 | $0,26 | USD | ≈0.87% |
| Ott 2, 2024 | $0,22 | USD | ≈0.86% |
| Lug 3, 2024 | $0,22 | USD | ≈0.97% |
| Apr 23, 2024 | $0,22 | USD | ≈0.85% |
| Gen 3, 2024 | $0,22 | USD | ≈0.85% |
| Ott 4, 2023 | $0,18 | USD | ≈0.89% |
| Lug 5, 2023 | $0,18 | USD | ≈0.81% |
| Apr 4, 2023 | $0,18 | USD | ≈0.81% |
| Gen 3, 2023 | $0,18 | USD | ≈0.75% |
| Ott 4, 2022 | $0,15 | USD | ≈0.82% |
| Lug 5, 2022 | $0,15 | USD | ≈0.71% |
| Apr 5, 2022 | $0,15 | USD | ≈0.40% |
| Gen 4, 2022 | $0,15 | USD | ≈0.19% |
Cronologia utili EPS effettivo vs stima, surprise %, tasso di superamento, data prossimi utili
| Periodo | Rapporto | EPS Actual | EPS Stimato | Sorpresa |
|---|---|---|---|---|
| 30 Settembre 2026 | Ago 10, 2026 | $-0.50 | $1.48 | -133.8% |
| 30 Giugno 2026 | $-0.50 | $1.48 | -133.8% | |
| 31 Marzo 2026 | $1.59 | $1.57 | 1.5% | |
| 31 Dicembre 2025 | $1.29 | $1.18 | 9.6% | |
| 30 Settembre 2025 | $1.36 | $1.35 | 0.67% | |
| 30 Giugno 2025 | $1.34 | $1.27 | 5.1% | |
| 31 Marzo 2025 | $1.25 | $1.20 | 3.8% |
Fondamentali Completi Tutte le metriche per anno — conto economico, stato patrimoniale, rendiconto finanziario
Conto Economico
| Metrica | Tendenza | 2025 | 2024 | 2023 | 2022 | 2021 | 2020 | 2019 | 2018 | 2017 |
|---|---|---|---|---|---|---|---|---|---|---|
| Revenue | $16.14B | $16.11B | $14.38B | $13.15B | $13.34B | $13.24B | $13.64B | $13.88B | $18.20B | |
| Cost of Revenue | $14.92B | $15.02B | $13.43B | $12.30B | $12.54B | $12.53B | $13.03B | $13.40B | $17.52B | |
| Gross Profit | $1.22B | $1.08B | $945M | $848M | $798M | $710M | $612M | $479M | $684M | |
| SG&A Expense | $158M | $160M | $154M | $147M | $155M | $189M | $148M | $136M | $133M | |
| Operating Income | $1.03B | $827M | $324M | $647M | $630M | $381M | $396M | $393M | $654M | |
| Interest Income | $63M | $59M | $40M | $8M | $7M | · | · | · | · | |
| Other Non-op | $-2M | $2M | $-5M | $14M | $18M | $11M | $15M | $21M | $7M | |
| Pretax Income | $916M | $718M | $213M | $551M | $409M | $233M | $249M | $212M | $429M | |
| Income Tax | $204M | $153M | $56M | $136M | $89M | $46M | $13M | $-3M | $8M | |
| Net Income | $562M | $402M | $55M | $311M | $173M | $-186M | $-261M | $136M | $339M | |
| EPS (Basic) | $4.24 | $2.97 | $0.40 | $2.21 | $1.18 | $-1.17 | $-1.66 | $0.86 | $2.18 | |
| EPS (Diluted) | $4.21 | $2.95 | $0.39 | $2.18 | $1.16 | $-1.16 | $-1.63 | $0.84 | $2.13 | |
| Shares (Basic) | 132,373,000 | 135,544,000 | 138,614,000 | 140,768,000 | 147,279,000 | 159,005,000 | 157,044,000 | 159,101,000 | 155,728,000 | |
| Shares (Diluted) | 133,311,000 | 136,453,000 | 140,109,000 | 142,696,000 | 149,676,000 | 161,292,000 | 159,684,000 | 162,261,000 | 159,135,000 | |
| EBITDA | $1.20B | $1.01B | $500M | $818M | $806M | $619M | $286M | · | · |
Stato Patrimoniale
| Metrica | Tendenza | 2025 | 2024 | 2023 | 2022 | 2021 | 2020 | 2019 | 2018 | 2017 |
|---|---|---|---|---|---|---|---|---|---|---|
| Cash & Equivalents | $1.59B | $1.58B | $1.26B | $1.17B | $1.23B | $1.71B | $886M | $887M | $802M | |
| Receivables | $2.50B | $2.79B | $2.54B | $2.32B | $2.62B | $2.92B | $2.87B | $3.31B | $5.13B | |
| Prepaid Expense | $716M | $638M | $730M | $759M | $739M | $692M | $516M | $585M | $697M | |
| Current Assets | $6.73B | $7.06B | $6.17B | $5.82B | $6.17B | $7.53B | $7.53B | $7.13B | $6.68B | |
| PP&E (Net) | $416M | $354M | $383M | $428M | $399M | $382M | $406M | $614M | $621M | |
| PP&E (Gross) | $1.14B | $1.06B | $1.15B | $1.12B | $1.08B | $1.05B | $1.09B | $1.35B | $1.30B | |
| Accum. Depreciation | $725M | $707M | $772M | $697M | $682M | $665M | $684M | $734M | $677M | |
| Goodwill | $3.70B | $3.48B | $3.42B | $3.38B | $3.50B | $3.48B | $3.48B | $5.92B | $5.99B | |
| Intangibles | $183M | $7M | $18M | $36M | $55M | $77M | $100M | $320M | $415M | |
| Other Non-current Assets | $254M | $268M | $219M | $293M | $308M | $160M | $172M | $229M | $150M | |
| Total Assets | $12.20B | $12.06B | $11.23B | $11.14B | $11.73B | $13.00B | $14.55B | $14.68B | $14.40B | |
| Accounts Payable | $2.26B | $2.56B | $2.19B | $2.03B | $2.09B | $2.36B | $2.41B | $2.73B | $2.25B | |
| Accrued Liabilities | $2.49B | $2.39B | $2.29B | $2.18B | $2.17B | $2.25B | $1.88B | $2.27B | $2.25B | |
| Short-term Debt | $4M | $3M | $3M | $5M | $4M | $223.0K | $48M | $8M | $1M | |
| Current Liabilities | $5.93B | $6.37B | $5.85B | $5.40B | $5.52B | $6.09B | $6.46B | $6.13B | $5.58B | |
| Capital Leases | $516M | $511M | $549M | $595M | $679M | $745M | · | · | · | |
| Deferred Tax | $68M | $28M | $17M | $9M | $5M | $3M | $5M | $47M | $21M | |
| Other Non-current Liabilities | $211M | $156M | $124M | $136M | $145M | $163M | $266M | $329M | $322M | |
| Total Liabilities | $9.50B | $9.69B | $8.85B | $8.53B | $8.90B | $9.59B | $10.65B | $10.40B | $10.18B | |
| Total Debt | $4M | $3M | $3M | $5M | $4M | $223.0K | $48M | · | · | |
| Common Stock | $1M | $1M | $1M | $1M | $1M | $2M | $2M | $2M | $2M | |
| Paid-in Capital | $4.61B | $4.35B | $4.24B | $4.16B | $4.12B | $4.04B | $3.95B | $3.85B | $3.73B | |
| Retained Earnings | $-1.22B | $-1.28B | $-1.10B | $-702M | $-504M | $174M | $600M | $948M | $962M | |
| AOCI | $-893M | $-883M | $-927M | $-980M | $-900M | $-919M | $-864M | $-703M | $-701M | |
| Stockholders' Equity | $2.49B | $2.18B | $2.21B | $2.48B | $2.71B | $3.29B | $3.69B | $4.09B | $4.00B | |
| Liabilities + Equity | $12.20B | $12.06B | $11.23B | $11.14B | $11.73B | $13.00B | $14.55B | $14.68B | $14.40B | |
| Shares Outstanding | 131,782,371 | 132,552,407 | 136,210,883 | 138,933,907 | 143,168,815 | 157,044,687 | 157,482,983 | 156,983,356 | 157,529,419 |
Flusso di cassa
| Metrica | Tendenza | 2025 | 2024 | 2023 | 2022 | 2021 | 2020 | 2019 | 2018 | 2017 |
|---|---|---|---|---|---|---|---|---|---|---|
| D&A | $42M | $179M | $176M | $171M | $176M | $237M | $261M | $268M | $279M | |
| Stock-based Comp | $61M | $62M | $46M | $38M | $45M | $54M | $64M | $73M | $84M | |
| Deferred Tax | $33M | $153M | $-136M | $22M | $-3M | $11M | $-98M | $37M | $-50M | |
| Amort. of Intangibles | $2M | $19M | $19M | $19M | $23M | $24M | $25M | $97M | $103M | |
| Other Non-cash | $-10M | $32M | $555M | $194M | $359M | $213M | $812M | · | · | |
| Operating Cash Flow | $822M | $827M | $696M | $714M | $705M | $330M | $778M | $775M | $697M | |
| CapEx | $137M | $120M | $106M | $137M | $136M | $115M | $101M | $113M | $86M | |
| Investing Cash Flow | $-413M | $-211M | $-138M | $-175M | $-421M | $2.04B | $-147M | $-59M | $-203M | |
| Stock Issued | $40M | $35M | $33M | $27M | $26M | $26M | $30M | $35M | $30M | |
| Stock Repurchased | $388M | $479M | $379M | $473M | $867M | $187M | $98M | $179M | $25M | |
| Net Stock Activity | $-348M | $-444M | $-346M | $-446M | $-841M | $-161M | $-68M | · | · | |
| Dividends Paid | $134M | $115M | $96M | $63M | · | · | · | · | · | |
| Financing Cash Flow | $-404M | $-295M | $-473M | $-588M | $-873M | $-1.63B | $-433M | $-625M | $-386M | |
| Net Change in Cash | $877.0K | $323M | $85M | $-58M | $-583M | $738M | $194M | $84M | $110M | |
| Taxes Paid | $-92M | $-140M | $-78M | $-105M | $-114M | $-71M | $-2M | $-41M | $12M | |
| Free Cash Flow | $685M | $708M | $590M | $577M | $568M | $215M | $677M | · | · |
Redditività
| Metrica | Tendenza | 2025 | 2024 | 2023 | 2022 | 2021 | 2020 | 2019 | 2018 | 2017 |
|---|---|---|---|---|---|---|---|---|---|---|
| Gross Margin | 7.5% | 6.7% | 6.6% | 6.5% | 6.0% | 5.4% | 4.0% | · | · | |
| Operating Margin | 6.4% | 5.1% | 2.2% | 4.9% | 4.7% | 2.9% | 0.12% | · | · | |
| Net Margin | 3.5% | 2.5% | 0.38% | 2.4% | 1.3% | -1.4% | -1.3% | · | · | |
| Pretax Margin | 5.7% | 4.5% | 1.5% | 4.2% | 3.1% | 1.8% | -0.91% | · | · | |
| EBITDA Margin | 7.4% | 6.2% | 3.5% | 6.2% | 6.0% | 4.7% | 1.4% | · | · | |
| ROA | 4.6% | 3.5% | 0.49% | 2.7% | 1.4% | -1.4% | -1.8% | · | · | |
| ROE | 24.0% | 18.3% | 2.4% | 12.0% | 5.8% | -5.3% | -6.7% | · | · | |
| ROIC | 31.9% | 29.8% | 10.8% | 19.6% | 18.1% | 9.3% | 0.67% | · | · |
Liquidità e Solvibilità
| Metrica | Tendenza | 2025 | 2024 | 2023 | 2022 | 2021 | 2020 | 2019 | 2018 | 2017 |
|---|---|---|---|---|---|---|---|---|---|---|
| Current Ratio | 1.1 | 1.1 | 1.1 | 1.1 | 1.1 | 1.2 | 1.2 | · | · | |
| Quick Ratio | 0.7 | 0.7 | 0.7 | 0.6 | 0.7 | 0.8 | 0.7 | · | · | |
| Debt / Equity | 0.0 | 0.0 | 0.0 | 0.0 | 0.0 | 0.0 | 0.0 | · | · |
Efficienza
| Metrica | Tendenza | 2025 | 2024 | 2023 | 2022 | 2021 | 2020 | 2019 | 2018 | 2017 |
|---|---|---|---|---|---|---|---|---|---|---|
| Asset Turnover | 1.3 | 1.4 | 1.3 | 1.1 | 1.1 | 1.0 | 1.4 | · | · | |
| Receivables Turnover | 6.1 | 6.0 | 5.9 | 5.3 | 4.8 | 4.6 | 5.9 | · | · |
Per Azione
| Metrica | Tendenza | 2025 | 2024 | 2023 | 2022 | 2021 | 2020 | 2019 | 2018 | 2017 |
|---|---|---|---|---|---|---|---|---|---|---|
| Book Value / Share | $18.91 | $16.48 | $16.24 | $17.83 | $18.95 | $20.97 | $23.43 | · | · | |
| Revenue / Share | $121.07 | $118.03 | $102.62 | $92.14 | $89.13 | $82.09 | $128.46 | · | · | |
| Cash Flow / Share | $6.16 | $6.06 | $4.97 | $5.00 | $4.71 | $2.04 | $4.95 | · | · | |
| Cash / Share | $12.03 | $11.93 | $9.25 | $8.44 | $8.59 | $10.88 | $6.86 | · | · | |
| EPS (TTM) | $4.21 | $2.95 | $0.39 | $2.18 | $1.16 | $-1.16 | $-1.63 | · | · |
Tassi di Crescita
| Metrica | Tendenza | 2025 | 2024 | 2023 | 2022 | 2021 | 2020 | 2019 | 2018 | 2017 |
|---|---|---|---|---|---|---|---|---|---|---|
| Revenue YoY | 0.21% | 12.0% | 9.4% | -1.4% | 0.76% | · | · | · | · | |
| Revenue CAGR 3Y | 7.1% | 6.5% | 2.8% | · | · | · | · | · | · | |
| Revenue CAGR 5Y | 4.0% | · | · | · | · | · | · | · | · | |
| EPS YoY | 42.7% | 656.4% | -82.1% | 87.9% | · | · | · | · | · | |
| EPS CAGR 3Y | 24.5% | 36.5% | · | · | · | · | · | · | · | |
| Net Income YoY | 39.6% | 627.0% | -82.2% | 79.3% | · | · | · | · | · | |
| Net Income CAGR 3Y | 21.8% | 32.4% | · | · | · | · | · | · | · |
Valutazione (TTM)
| Metrica | Tendenza | 2025 | 2024 | 2023 | 2022 | 2021 | 2020 | 2019 | 2018 | 2017 |
|---|---|---|---|---|---|---|---|---|---|---|
| Revenue TTM | $16.14B | $16.11B | $14.38B | $13.15B | $13.34B | $13.24B | $13.64B | · | · | |
| Net Income TTM | $562M | $402M | $55M | $311M | $173M | $-186M | $-261M | · | · | |
| Market Cap | $17.19B | $13.69B | $11.31B | $9.50B | $9.04B | $6.57B | $5.92B | · | · | |
| Enterprise Value | $15.61B | $12.11B | $10.05B | $8.33B | $7.82B | $4.86B | $4.88B | · | · | |
| P/E | 31.0 | 35.0 | 212.9 | 31.4 | 54.4 | -36.1 | -23.0 | · | · | |
| P/S | 1.1 | 0.8 | 0.8 | 0.7 | 0.7 | 0.5 | 0.4 | · | · | |
| P/B | 6.9 | 6.3 | 5.1 | 3.8 | 3.3 | 2.0 | 1.6 | · | · | |
| P / Cash Flow | 20.9 | 16.5 | 16.3 | 13.3 | 12.8 | 19.9 | 7.6 | · | · | |
| P / FCF | 25.1 | 19.3 | 19.2 | 16.5 | 15.9 | 30.6 | 8.7 | · | · | |
| EV / EBITDA | 13.0 | 12.0 | 20.1 | 10.2 | 9.7 | 7.9 | 17.1 | · | · | |
| EV / FCF | 22.8 | 17.1 | 17.0 | 14.4 | 13.8 | 22.6 | 7.2 | · | · | |
| EV / Revenue | 1.0 | 0.8 | 0.7 | 0.6 | 0.6 | 0.4 | 0.4 | · | · | |
| Dividend Yield | 0.78% | 0.84% | 0.85% | 0.67% | · | · | · | · | · | |
| Earnings Yield | 3.2% | 2.9% | 0.47% | 3.2% | 1.8% | -2.8% | -4.3% | · | · | |
| Payout Ratio | 23.8% | 28.6% | 173.8% | 20.4% | · | · | · | · | · | |
| Annual Payout | $134M | $115M | $96M | $63M | · | · | · | · | · |
Conto Economico
| Metrica | Tendenza | Q4 2026 | Q3 2026 | Q2 2026 | Q4 2025 | Q1 2026 | Q3 2025 | Q2 2025 | Q1 2025 | Q4 2024 | Q3 2024 | Q2 2024 | Q1 2024 | Q4 2023 | Q3 2023 |
|---|---|---|---|---|---|---|---|---|---|---|---|---|---|---|---|
| Revenue | · | $3.59B | $3.80B | · | $3.83B | $4.18B | $3.77B | $4.01B | $4.11B | $4.15B | $3.94B | $3.90B | $3.84B | $3.66B | |
| Cost of Revenue | · | $3.62B | $3.50B | · | $3.55B | $3.85B | $3.48B | $3.75B | $3.82B | $3.87B | $3.68B | $3.66B | $3.59B | $3.41B | |
| Gross Profit | · | $-34M | $296M | · | $281M | $327M | $291M | $268M | $294M | $285M | $261M | $244M | $252M | $250M | |
| SG&A Expense | · | $34M | $44M | · | $41M | $38M | $40M | $40M | $43M | $36M | $45M | $36M | $41M | $43M | |
| Operating Income | · | $-76M | $248M | · | $222M | $294M | $258M | $237M | $236M | $227M | $200M | $163M | $80M | $-105M | |
| Interest Expense | · | · | · | · | · | · | · | · | · | · | $48M | $41M | · | $39M | |
| Interest Income | · | $12M | $14M | · | $14M | $14M | $15M | $17M | $15M | $16M | $15M | $12M | $16M | $9M | |
| Other Non-op | · | $5M | $11M | · | $8M | $823.0K | $-9M | $7M | $-4M | $963.0K | $3M | · | · | · | |
| Pretax Income | · | $-107M | $222M | · | $198M | $269M | $221M | $218M | $218M | $193M | $171M | $137M | $57M | $-134M | |
| Income Tax | · | $-27M | $27M | · | $39M | $65M | $51M | $29M | $35M | $46M | $45M | $27M | $9M | $-20M | |
| Net Income | · | $-87M | $180M | · | $75M | $131M | $143M | $167M | $173M | $134M | $1M | $94M | $25M | $-135M | |
| EPS (Basic) | · | $-0.67 | $1.40 | · | $0.57 | $0.99 | $1.08 | $1.26 | $1.28 | $0.99 | $0.01 | $0.69 | $0.19 | $-0.97 | |
| EPS (Diluted) | · | $-0.67 | $1.39 | · | $0.56 | $0.98 | $1.08 | $1.25 | $1.27 | $0.98 | $0.01 | $0.69 | $0.18 | $-0.97 | |
| Shares (Basic) | · | 128,564,000 | 128,728,000 | · | 130,888,000 | 132,301,000 | 132,432,000 | 132,500,000 | · | 136,025,000 | 136,006,000 | 135,897,000 | · | 138,741,000 | |
| Shares (Diluted) | · | 128,564,000 | 129,235,000 | · | 131,982,000 | 133,078,000 | 133,139,000 | 133,625,000 | · | 136,790,000 | 136,712,000 | 137,101,000 | · | 138,741,000 | |
| EBITDA | · | · | · | · | · | $294M | $258M | $280M | · | $227M | $200M | $206M | · | $-105M |
Stato Patrimoniale
| Metrica | Tendenza | Q4 2026 | Q3 2026 | Q2 2026 | Q4 2025 | Q1 2026 | Q3 2025 | Q2 2025 | Q1 2025 | Q4 2024 | Q3 2024 | Q2 2024 | Q1 2024 | Q4 2023 | Q3 2023 |
|---|---|---|---|---|---|---|---|---|---|---|---|---|---|---|---|
| Cash & Equivalents | · | · | · | · | · | $1.79B | $1.60B | $1.58B | $1.58B | $1.64B | $1.19B | $1.19B | · | $1.26B | |
| Receivables | · | · | · | · | · | $2.60B | $2.52B | $2.65B | $2.79B | $2.66B | $2.65B | $2.52B | · | $2.52B | |
| Prepaid Expense | · | · | · | · | · | $855M | $793M | $758M | $638M | $732M | $726M | $723M | · | $720M | |
| Current Assets | · | · | · | · | · | $7.27B | $6.93B | $7.00B | $7.06B | $7.12B | $6.50B | $6.28B | · | $6.27B | |
| PP&E (Net) | · | · | · | · | · | $404M | $359M | $363M | $354M | $357M | $372M | $390M | · | $417M | |
| PP&E (Gross) | · | · | · | · | · | · | · | · | $1.06B | · | · | · | · | · | |
| Accum. Depreciation | · | · | · | · | · | · | · | · | $707M | · | · | · | · | · | |
| Goodwill | · | · | · | · | · | $3.49B | $3.44B | $3.43B | $3.48B | $3.45B | $3.45B | $3.46B | · | $3.44B | |
| Intangibles | · | · | · | · | · | $5M | $6M | $6M | $7M | $12M | $16M | $21M | · | $22M | |
| Other Non-current Assets | · | · | · | · | · | $120M | $127M | $141M | $268M | $152M | $119M | $209M | · | $232M | |
| Total Assets | · | · | · | · | · | $12.25B | $11.78B | $11.82B | $12.06B | $12.05B | $11.46B | $11.39B | · | $11.43B | |
| Accounts Payable | · | · | · | · | · | $2.45B | $2.31B | $2.35B | $2.56B | $2.44B | $2.30B | $2.11B | · | $2.11B | |
| Accrued Liabilities | · | · | · | · | · | $2.50B | $2.35B | $2.36B | $2.39B | $2.41B | $2.39B | $2.42B | · | $2.22B | |
| Short-term Debt | · | · | · | · | · | $5M | $3M | $4M | $3M | $3M | $3M | $3M | · | $4M | |
| Current Liabilities | · | · | · | · | · | $6.23B | $6.02B | $6.14B | $6.37B | $6.29B | $6.14B | $6.00B | · | $5.71B | |
| Capital Leases | · | · | · | · | · | $521M | $496M | $485M | $511M | $497M | $508M | $523M | · | $586M | |
| Deferred Tax | · | · | · | · | · | $45M | $44M | $29M | $28M | $18M | $17M | $17M | · | $10M | |
| Other Non-current Liabilities | · | · | · | · | · | $159M | $153M | $153M | $156M | $123M | $120M | $117M | · | $121M | |
| Total Liabilities | · | · | · | · | · | $9.55B | $9.32B | $9.42B | $9.69B | $9.55B | $9.06B | $8.96B | · | $8.80B | |
| Total Debt | · | · | · | · | · | $5M | $3M | $4M | · | $3M | $3M | $3M | · | $4M | |
| Common Stock | · | · | · | · | · | $1M | $1M | $1M | $1M | $1M | $1M | $1M | · | $1M | |
| Paid-in Capital | · | · | · | · | · | $4.43B | $4.38B | $4.35B | $4.35B | $4.32B | $4.27B | $4.25B | · | $4.23B | |
| Retained Earnings | · | · | · | · | · | $-1.06B | $-1.15B | $-1.18B | $-1.28B | $-1.11B | $-1.16B | $-1.11B | · | $-873M | |
| AOCI | · | · | · | · | · | $-875M | $-943M | $-965M | $-883M | $-915M | $-910M | $-890M | · | $-901M | |
| Stockholders' Equity | · | · | · | · | · | $2.49B | $2.29B | $2.20B | $2.18B | $2.30B | $2.20B | $2.25B | · | $2.45B | |
| Liabilities + Equity | · | · | · | · | · | $12.25B | $11.78B | $11.82B | $12.06B | $12.05B | $11.46B | $11.39B | · | $11.43B | |
| Shares Outstanding | · | · | · | · | · | 132,318,294 | 132,019,854 | 132,638,253 | 132,552,407 | 135,702,623 | 135,872,491 | 136,018,182 | · | 138,499,043 |
Flusso di cassa
| Metrica | Tendenza | Q4 2026 | Q3 2026 | Q2 2026 | Q4 2025 | Q1 2026 | Q3 2025 | Q2 2025 | Q1 2025 | Q4 2024 | Q3 2024 | Q2 2024 | Q1 2024 | Q4 2023 | Q3 2023 |
|---|---|---|---|---|---|---|---|---|---|---|---|---|---|---|---|
| D&A | · | $56M | $59M | · | $52M | $45M | $42M | $42M | $45M | $46M | $44M | $43M | $45M | $43M | |
| Stock-based Comp | · | $-4M | $15M | · | $16M | $15M | $14M | $17M | $17M | $14M | $16M | $15M | $5M | $16M | |
| Amort. of Intangibles | · | $14M | $17M | · | $13M | $300.0K | $400.0K | $1M | $5M | $5M | $5M | $5M | · | $5M | |
| Other Non-cash | · | · | · | · | · | · | · | $-75M | · | · | · | $-10M | · | · | |
| Operating Cash Flow | · | $95M | $4M | · | $70M | $284M | $191M | $151M | $299M | $291M | $94M | $143M | $285M | $279M | |
| CapEx | · | $40M | $31M | · | $28M | $22M | $12M | $40M | $24M | $19M | $20M | $56M | $22M | $14M | |
| Investing Cash Flow | · | $-72M | $-40M | · | $-35M | $-47M | $-61M | $-25M | $-25M | $-64M | $-35M | $-87M | $-32M | $-23M | |
| Stock Issued | · | $12M | $7M | · | $11M | $5M | $11M | $6M | $9M | $11M | $5M | $10M | $11M | $9M | |
| Stock Repurchased | · | $-6.0K | $116M | · | $326M | $5M | $78M | $55M | $315M | $50M | $21M | $92M | $234M | $50M | |
| Net Stock Activity | · | · | · | · | · | · | · | $-49M | · | · | · | $-82M | · | · | |
| Dividends Paid | · | $40M | $40M | · | $35M | $35M | $35M | $29M | $30M | $30M | $31M | $24M | $25M | $25M | |
| Financing Cash Flow | · | $-43M | $-173M | · | $-374M | $-45M | $-115M | $-121M | $-340M | $233M | $-62M | $-126M | $-269M | $-57M | |
| Net Change in Cash | · | $-21M | $-212M | · | $-339M | $194M | $15M | $-136.0K | $-63M | $459M | $-4M | $-69M | $-18M | $199M | |
| Free Cash Flow | · | · | · | · | · | · | · | $111M | · | · | · | $87M | · | · | |
| Levered FCF | · | · | · | · | · | · | · | · | · | · | · | $54M | · | · |
Redditività
| Metrica | Tendenza | Q4 2026 | Q3 2026 | Q2 2026 | Q4 2025 | Q1 2026 | Q3 2025 | Q2 2025 | Q1 2025 | Q4 2024 | Q3 2024 | Q2 2024 | Q1 2024 | Q4 2023 | Q3 2023 |
|---|---|---|---|---|---|---|---|---|---|---|---|---|---|---|---|
| Gross Margin | · | · | · | · | · | 7.8% | 7.7% | 6.7% | · | 6.9% | 6.6% | 6.3% | · | 6.8% | |
| Operating Margin | · | · | · | · | · | 7.0% | 6.8% | 5.9% | · | 5.5% | 5.1% | 4.2% | · | -2.9% | |
| Net Margin | · | · | · | · | · | 3.1% | 3.8% | 4.2% | · | 3.2% | 0.03% | 2.4% | · | -3.7% | |
| Pretax Margin | · | · | · | · | · | 6.4% | 5.9% | 5.4% | · | 4.7% | 4.3% | 3.5% | · | -3.6% | |
| EBITDA Margin | · | · | · | · | · | 7.0% | 6.8% | 7.0% | · | 5.5% | 5.1% | 5.3% | · | -2.9% | |
| ROA | · | · | · | · | · | 1.1% | 1.2% | 1.4% | · | 1.1% | 0.01% | 0.83% | · | -1.2% | |
| ROE | · | · | · | · | · | 5.5% | 6.4% | 7.5% | · | 5.7% | 0.04% | 3.9% | · | -5.5% | |
| ROIC | · | · | · | · | · | 8.9% | 8.6% | 9.3% | · | 7.5% | 6.7% | 5.8% | · | -3.6% |
Liquidità e Solvibilità
| Metrica | Tendenza | Q4 2026 | Q3 2026 | Q2 2026 | Q4 2025 | Q1 2026 | Q3 2025 | Q2 2025 | Q1 2025 | Q4 2024 | Q3 2024 | Q2 2024 | Q1 2024 | Q4 2023 | Q3 2023 |
|---|---|---|---|---|---|---|---|---|---|---|---|---|---|---|---|
| Current Ratio | · | · | · | · | · | 1.2 | 1.2 | 1.1 | · | 1.1 | 1.1 | 1.0 | · | 1.1 | |
| Quick Ratio | · | · | · | · | · | 0.7 | 0.7 | 0.7 | · | 0.7 | 0.6 | 0.6 | · | 0.7 | |
| Debt / Equity | · | · | · | · | · | 0.0 | 0.0 | 0.0 | · | 0.0 | 0.0 | 0.0 | · | 0.0 | |
| Interest Coverage | · | · | · | · | · | · | · | · | · | · | 4.2 | 4.0 | · | -2.7 |
Efficienza
| Metrica | Tendenza | Q4 2026 | Q3 2026 | Q2 2026 | Q4 2025 | Q1 2026 | Q3 2025 | Q2 2025 | Q1 2025 | Q4 2024 | Q3 2024 | Q2 2024 | Q1 2024 | Q4 2023 | Q3 2023 |
|---|---|---|---|---|---|---|---|---|---|---|---|---|---|---|---|
| Asset Turnover | · | · | · | · | · | 0.3 | 0.3 | 0.3 | · | 0.4 | 0.3 | 0.3 | · | 0.3 | |
| Receivables Turnover | · | · | · | · | · | 1.6 | 1.5 | 1.6 | · | 1.6 | 1.6 | 1.6 | · | 1.5 |
Per Azione
| Metrica | Tendenza | Q4 2026 | Q3 2026 | Q2 2026 | Q4 2025 | Q1 2026 | Q3 2025 | Q2 2025 | Q1 2025 | Q4 2024 | Q3 2024 | Q2 2024 | Q1 2024 | Q4 2023 | Q3 2023 |
|---|---|---|---|---|---|---|---|---|---|---|---|---|---|---|---|
| Book Value / Share | · | · | · | · | · | $18.84 | $17.31 | $16.62 | · | $16.94 | $16.18 | $16.52 | · | $17.72 | |
| Revenue / Share | · | · | · | · | · | $31.40 | $28.33 | $30.04 | · | $30.35 | $28.85 | $28.45 | · | $26.41 | |
| Cash Flow / Share | · | · | · | · | · | · | · | $1.13 | · | · | · | $1.04 | · | · | |
| Cash / Share | · | · | · | · | · | $13.56 | $12.12 | $11.92 | · | $12.12 | $8.73 | $8.77 | · | $9.08 | |
| Dividend / Share | · | $0.31 | $0.31 | · | $0.31 | $0.26 | $0.26 | $0.26 | · | · | · | · | · | · | |
| EPS (TTM) | $2.26 | $2.18 | $3.83 | $3.87 | $3.52 | $4.58 | $4.58 | $3.51 | · | $1.86 | $-0.09 | $0.45 | · | $0.95 |
Valutazione (TTM)
| Metrica | Tendenza | Q4 2026 | Q3 2026 | Q2 2026 | Q4 2025 | Q1 2026 | Q3 2025 | Q2 2025 | Q1 2025 | Q4 2024 | Q3 2024 | Q2 2024 | Q1 2024 | Q4 2023 | Q3 2023 |
|---|---|---|---|---|---|---|---|---|---|---|---|---|---|---|---|
| Revenue TTM | $15.40B | $15.39B | $15.99B | $15.80B | $15.96B | $16.07B | $16.05B | $16.22B | · | $15.84B | $15.35B | $14.90B | · | $13.96B | |
| Net Income TTM | $299M | $288M | $506M | $516M | $469M | $614M | $617M | $475M | · | $255M | $-14M | $62M | · | $135M | |
| Market Cap | · | · | · | · | · | $14.93B | $12.24B | $14.17B | · | $11.96B | $13.33B | $12.57B | · | $11.73B | |
| Enterprise Value | · | · | · | · | · | $13.14B | $10.65B | $12.59B | · | $10.32B | $12.14B | $11.38B | · | $10.48B | |
| P/E | 30.0 | 32.0 | 22.1 | 24.9 | 27.1 | 24.6 | 20.2 | 30.4 | · | 47.4 | -1089.8 | 205.4 | · | 89.1 | |
| P/S | · | · | · | · | · | 0.9 | 0.8 | 0.9 | · | 0.8 | 0.9 | 0.8 | · | 0.8 | |
| P/B | · | · | · | · | · | 6.0 | 5.4 | 6.4 | · | 5.2 | 6.1 | 5.6 | · | 4.8 | |
| P / Cash Flow | · | · | · | · | · | · | · | 93.8 | · | · | · | 87.9 | · | · | |
| EV / Revenue | · | · | · | · | · | 0.8 | 0.7 | 0.8 | · | 0.7 | 0.8 | 0.8 | · | 0.8 | |
| Dividend Yield | · | · | · | · | · | 0.86% | 1.0% | 0.85% | · | 0.92% | 0.79% | 0.79% | · | 0.79% | |
| Earnings Yield | 3.3% | 3.1% | 4.5% | 4.0% | 3.7% | 4.1% | 4.9% | 3.3% | · | 2.1% | -0.09% | 0.49% | · | 1.1% | |
| Payout Ratio | · | · | · | · | · | · | · | 17.4% | · | · | · | 25.9% | · | · | |
| Annual Payout | · | $150M | $145M | · | $140M | $129M | $124M | $120M | · | $110M | $105M | $100M | · | $92M |
Periodo più recente a sinistra · valori nulli mostrati come ·
Bilanci Conto economico, stato patrimoniale, flusso di cassa — annuale, ultimi 5 anni
| Metrica | 2026-06-30 | 2026-03-31 | 2025-12-31 | 2025-09-30 | 2024-09-30 |
|---|---|---|---|---|---|
| Ricavi | · | · | · | $16.14B | $16.11B |
| Margine Lordo % | · | · | · | 7.5% | 6.7% |
| Margine Operativo % | · | · | · | 6.4% | 5.1% |
| Utile netto | · | · | · | $562M | $402M |
| EPS Diluito | · | · | · | $4.21 | $2.95 |
| Metrica | 2026-06-30 | 2026-03-31 | 2025-12-31 | 2025-09-30 | 2024-09-30 |
|---|---|---|---|---|---|
| Debito / Patrimonio Netto | · | · | · | 0.0 | 0.0 |
| Rapporto corrente | · | · | · | 1.1 | 1.1 |
| Quick Ratio | · | · | · | 0.7 | 0.7 |
| Metrica | 2026-06-30 | 2026-03-31 | 2025-12-31 | 2025-09-30 | 2024-09-30 |
|---|---|---|---|---|---|
| Flusso di cassa libero | · | · | · | $685M | $708M |
Proprietari istituzionali (13F) 614 filer · $9.4B totale · Aggiornato al 30 Settembre 2026
Istituzioni che segnalano il possesso di questo titolo nel loro Modulo SEC 13F trimestrale. Solo posizioni lunghe; un singolo depositante può apparire due volte per diverse gambe di opzioni. Grandi posizioni put/call contrapposte riflettono tipicamente market-making o inventario coperto, non convinzione direzionale.
| Nuove posizioni | Posizioni chiuse | Aumentato | Diminuito | Variazione netta delle azioni |
|---|---|---|---|---|
| 81 (-30 vs trimestre precedente) | 121 (+15 vs trimestre precedente) | 186 (-39 vs trimestre precedente) | 232 (+28 vs trimestre precedente) | +6.9M |
Confrontato con Q1 2026. Le dichiarazioni SEC Form 13F sono dovute entro 45 giorni dalla fine del trimestre più un breve margine per i dichiaranti in ritardo — i trimestri ancora all'interno di questa finestra vengono saltati a favore della coppia più recente completamente riportata.
| Istituzione | Valore | Azioni | % di 13F tracciati | Tipo |
|---|---|---|---|---|
| VANGUARD GROUP INC | $1.171.205.505 | 12.285.802 | 12,47% | Azioni |
| BlackRock, Inc. | $1.003.698.738 | 14.379.638 | 10,69% | Azioni |
| PRIMECAP MANAGEMENT CO/CA/ | $613.335.602 | 8.787.043 | 6,53% | Azioni |
| VANGUARD CAPITAL MANAGEMENT LLC | $405.401.332 | 5.808.042 | 4,32% | Azioni |
| BARROW HANLEY MEWHINNEY & STRAUSS LLC | $383.701.279 | 5.497.153 | 4,09% | Azioni |
| VANGUARD PORTFOLIO MANAGEMENT LLC | $382.967.263 | 5.486.637 | 4,08% | Azioni |
| UBS AM, a distinct business unit of UBS ASSET MANAGEMENT AMERICAS LLC | $295.340.103 | 3.481.963 | 3,14% | Azioni |
| STATE STREET CORP | $286.605.640 | 4.106.098 | 3,05% | Azioni |
| FMR LLC | $262.321.822 | 3.758.192 | 2,79% | Azioni |
| Invesco Ltd. | $222.792.760 | 3.191.873 | 2,37% | Azioni |
| GEODE CAPITAL MANAGEMENT, LLC | $170.754.730 | 2.445.738 | 1,82% | Azioni |
| FIRST TRUST ADVISORS LP | $170.737.149 | 2.446.092 | 1,82% | Azioni |
| Impax Asset Management Group plc | $148.558.062 | 2.128.339 | 1,58% | Azioni |
| Qube Research & Technologies Ltd | $147.941.030 | 2.119.499 | 1,58% | Azioni |
| ARROWSTREET CAPITAL, LIMITED PARTNERSHIP | $146.366.063 | 2.096.935 | 1,56% | Azioni |
| NORGES BANK | $129.341.843 | 1.853.035 | 1,38% | Azioni |
| AQR CAPITAL MANAGEMENT LLC | $124.007.075 | 1.795.383 | 1,32% | Azioni |
| D. E. Shaw & Co., Inc. | $119.438.758 | 1.711.157 | 1,27% | Azioni |
| UBS Group AG | $118.339.199 | 1.695.404 | 1,26% | Azioni |
| DIMENSIONAL FUND ADVISORS LP | $114.526.869 | 1.640.760 | 1,22% | Azioni |
| MORGAN STANLEY | $114.362.469 | 1.638.429 | 1,22% | Azioni |
| MANUFACTURERS LIFE INSURANCE COMPANY, THE | $94.429.209 | 1.352.854 | 1,01% | Azioni |
| MILLENNIUM MANAGEMENT LLC | $92.226.461 | 1.321.296 | 0,98% | Azioni |
| Amundi | $91.674.676 | 1.312.233 | 0,98% | Azioni |
| Bank of New York Mellon Corp | $79.518.792 | 1.139.237 | 0,85% | Azioni |
| NORTHERN TRUST CORP | $78.590.193 | 1.125.934 | 0,84% | Azioni |
| MIRAE ASSET GLOBAL ETFS HOLDINGS Ltd. | $73.339.094 | 1.050.704 | 0,78% | Azioni |
| CHARLES SCHWAB INVESTMENT MANAGEMENT INC | $67.614.911 | 968.695 | 0,72% | Azioni |
| CIBC Bancorp USA Inc. | $64.577.774 | 925.183 | 0,69% | Azioni |
| TWO SIGMA INVESTMENTS, LP | $61.117.369 | 875.607 | 0,65% | Azioni |
| VANGUARD FIDUCIARY TRUST CO | $56.719.969 | 812.607 | 0,60% | Azioni |
| GOLDMAN SACHS GROUP INC | $53.764.874 | 770.270 | 0,57% | Azioni |
| RENAISSANCE TECHNOLOGIES LLC | $52.132.015 | 746.877 | 0,56% | Azioni |
| BANK OF AMERICA CORP /DE/ | $51.811.464 | 742.285 | 0,55% | Azioni |
| BARCLAYS PLC | $50.829.338 | 728.214 | 0,54% | Azioni |
| CITADEL ADVISORS LLC | $47.308.416 | 677.771 | 0,50% | Azioni |
| ALLIANCEBERNSTEIN L.P. | $47.233.035 | 556.862 | 0,50% | Azioni |
| TUDOR INVESTMENT CORP ET AL | $46.757.764 | 669.882 | 0,50% | Azioni |
| PFA Pension, Forsikringsaktieselskab | $43.141.108 | 618.067 | 0,46% | Azioni |
| Ninety One UK Ltd | $43.043.409 | 730.168 | 0,46% | Azioni |
| HSBC HOLDINGS PLC | $39.293.475 | 567.740 | 0,42% | Azioni |
| JANE STREET GROUP, LLC | $37.315.150 | 534.601 | 0,40% | Azioni |
| AXA Investment Managers S.A. | $36.701.863 | 281.305 | 0,39% | Azioni |
| PRUDENTIAL FINANCIAL INC | $35.786.669 | 512.703 | 0,38% | Azioni |
| Squarepoint Ops LLC | $34.732.550 | 497.601 | 0,37% | Azioni |
| JPMORGAN CHASE & CO | $34.484.452 | 488.288 | 0,37% | Azioni |
| BNP PARIBAS FINANCIAL MARKETS | $33.160.654 | 475.081 | 0,35% | Azioni |
| Perpetual Ltd | $32.089.609 | 544.353 | 0,34% | Azioni |
| Gotham Asset Management, LLC | $31.727.590 | 454.550 | 0,34% | Azioni |
| Nuveen, LLC | $30.946.584 | 443.361 | 0,33% | Azioni |
Attivisti e proprietari del 5%+ 2 partecipazioni
Investitori che hanno depositato SEC Schedule 13D — proprietà effettiva superiore al 5% con l'intento di influenzare l'emittente (partecipazioni attiviste, campagne per il consiglio di amministrazione, M&A). Ogni riga mostra lo stato più recente noto della posizione di quel depositante.
| Depositante | Depositato | Partecipazione | Stato | Scopo | Deposito |
|---|---|---|---|---|---|
| AECOM ×3 depositi | 27 Settembre 2024 | · | Deposito iniziale | · | SEC |
| STARBOARD VALUE LP, STARBOARD VALUE AND OPPORTUNITY MASTER FUND LTD, STARBOARD VALUE AND OPPORTUNITY S LLC, STARBOARD VALUE AND OPPORTUNITY C LP, STARBOARD P FUND LP, STARBOARD VALUE P GP LLC, STARBOARD VALUE R LP, STARBOARD VALUE AND OPPORTUNITY MASTER FUND L LP, STARBOARD VALUE L LP, STARBOARD VALUE R GP LLC, STARBOARD LEADERS YANKEE LLC, STARBOARD LEADERS FUND LP, STARBOARD LEADERS SELECT X LP, STARBOARD LEADERS SELECT X GP LLC, STARBOARD VALUE A LP, STARBOARD VALUE A GP LLC, STARBOARD VALUE X MASTER FUND LTD, STARBOARD VALUE GP LLC, STARBOARD PRINCIPAL CO LP, STARBOARD PRINCIPAL CO GP LLC, JEFFREY C. SMITH, PETER A. FELD ×3 depositi | 27 Gennaio 2023 | · | Deposito iniziale | · | SEC |
Purpose is an automated classification of the filer's own stated purpose (SEC Item 4) — not investment advice. "—" means no clear purpose was stated or the text could not be classified.
Insider aziendali 59 insider · 27 dirigenti · 25 direttori
| Insider | Ruolo | Ultima attività | Azioni possedute | Acquisti 12m | Vendite 12m | Netto 12m |
|---|---|---|---|---|---|---|
| Troy Rudd | CHIEF EXECUTIVE OFFICER | 14 Maggio 2026 P | 142.207 | 1 | 0 | $300.060 |
| Michael S Burke | Chairman & CEO | 17 Marzo 2020 M | 807.744 | 0 | 0 | $0 |
| Gaurav Kapoor | CHIEF FINANCIAL OFFICER (PAO) | 14 Maggio 2026 P | 88.053 | 1 | 0 | $100.990 |
| Lara Poloni | PRESIDENT | 16 Giugno 2026 P | 153.446 | 1 | 2 | $-1.402.794 |
| Chuan-Sheng Chiao | President, Asia Pacific | 20 Agosto 2020 S | 38.214 | 0 | 0 | $0 |
| John C. Vollmer | Group President, MS | 27 Gennaio 2020 M | 37.975 | 0 | 0 | $0 |
| Steve Morriss | Group President, Design and Co | 15 Dicembre 2019 A | 7.460 | 0 | 0 | $0 |
| McQuade Daniel P | President, Construction Srvcs. | 13 Marzo 2018 S | 2.642 | 0 | 0 | $0 |
| Stephen M Kadenacy | President and COO | 30 Giugno 2017 M | 134.308 | 0 | 0 | $0 |
| Nigel C Robinson | President, Global Geographies | 15 Dicembre 2012 M | 105.551 | 0 | 0 | $0 |
| Alan P Krusi | President, Strategic Dev | 28 Novembre 2012 A | 24.348 | 0 | 0 | $0 |
| James M Jaska | President, Americas/Government | 28 Novembre 2012 A | 57.282 | 0 | 0 | $0 |
| Randall A Wotring | Chief Operating Officer | 15 Dicembre 2019 A | 139.134 | 0 | 0 | $0 |
| David Y. Gan | CHIEF LEGAL OFFICER | 15 Dicembre 2025 M | 41.549 | 0 | 2 | $-1.514.889 |
| Todd Battley | CHIEF STRATEGY OFFICER | 05 Gennaio 2023 S | 16.295 | 0 | 0 | $0 |
| Shirley A Adams | CHIEF HUMAN RESOURCES OFFICER | 16 Dicembre 2022 M | 14.750 | 0 | 0 | $0 |
| Carla J Christofferson | EVP, Chief Legal Officer | 15 Dicembre 2019 M | 15.759 | 0 | 0 | $0 |
| Mary E Finch | EVP, CHRO | 15 Dicembre 2018 A | 17.005 | 0 | 0 | $0 |
| Frederick W Werner | Pres, Design & Conslt Services | 04 Gennaio 2017 S | 50.125 | 0 | 0 | $0 |
| Ronald E Osborne | SVP, Controller | 15 Dicembre 2016 A | 28.169 | 0 | 0 | $0 |
| Kevin A. Lynch | EVP, Chief Strategy Officer | 08 Luglio 2015 S | 3.141 | 0 | 0 | $0 |
| George Nash | Pres, Energy, Infr & Ind Const | 19 Novembre 2014 A | 21.477 | 0 | 0 | $0 |
| Joseph Masters | General Counsel | 17 Ottobre 2014 A | 28.409 | 0 | 0 | $0 |
| Anthony Chun Kin Shum | Chairman, Asia | 16 Ottobre 2014 A | 189.765 | 0 | 0 | $0 |
| John M Renfro | EVP, Chief HR Officer | 28 Novembre 2012 A | · | 0 | 0 | $0 |
| James R Royer | Vice Chairman | 13 Febbraio 2009 S | 195.144 | 0 | 0 | $0 |
| Raymond W Holdsworth Jr | Vice Chairman, Corp Develop | 15 Febbraio 2008 M | 352.817 | 0 | 0 | $0 |
| Kristy Pipes | Direttore | 03 Marzo 2026 A | 8.623 | 0 | 0 | $0 |
| Janet Carol Wolfenbarger | Direttore | 03 Marzo 2026 A | 38.822 | 0 | 0 | $0 |
| Daniel R. Tishman | Direttore | 03 Marzo 2026 A | 23.677 | 0 | 0 | $0 |
| Lydia H Kennard | Direttore | 19 Marzo 2024 A | 10.456 | 0 | 0 | $0 |
| Robert G Card | Direttore | 01 Marzo 2023 M | 11.242 | 0 | 0 | $0 |
| CREEL DIANE C | Direttore | 01 Marzo 2023 M | 4.970 | 0 | 0 | $0 |
| Clarence T Schmitz | Direttore | 01 Marzo 2022 A | 40.219 | 0 | 0 | $0 |
| Jacqueline C. Hinman | Direttore | 24 Febbraio 2022 M | 8.927 | 0 | 0 | $0 |
| Rob J Routs | Direttore | 24 Febbraio 2021 M | 33.129 | 0 | 0 | $0 |
| Steven A Kandarian | Direttore | 24 Febbraio 2021 M | 9.641 | 0 | 0 | $0 |
| Peter A. Feld | Direttore | 11 Marzo 2020 A | 1.876 | 0 | 0 | $0 |
| William H. Frist | Direttore | 06 Marzo 2020 M | 51.603 | 0 | 0 | $0 |
| James H Fordyce | Direttore | 06 Marzo 2019 A | 147.676 | 0 | 0 | $0 |
| Linda M Griego | Direttore | 06 Marzo 2019 A | 36.910 | 0 | 0 | $0 |
| David W Joos | Direttore | 28 Febbraio 2018 M | 30.926 | 0 | 0 | $0 |
| William P Rutledge | Direttore | 02 Marzo 2016 M | 38.656 | 0 | 0 | $0 |
| William G Ouchi | Direttore | 02 Marzo 2016 M | 8.439 | 0 | 0 | $0 |
| John M Dionisio | Direttore | 29 Dicembre 2015 M | 174.188 | 0 | 0 | $0 |
| Richard G Newman | Direttore | 04 Marzo 2015 M | 115.539 | 0 | 0 | $0 |
| Francis S Y Bong | Direttore | 15 Dicembre 2013 M | 8.145 | 0 | 0 | $0 |
| Robert J Lowe | Direttore | 12 Giugno 2013 M | 110.783 | 0 | 0 | $0 |
| Norman Y Mineta | Direttore | 15 Dicembre 2010 S | 3.679 | 0 | 0 | $0 |
| Frederick H Christie | Direttore | 15 Dicembre 2010 S | 30.699 | 0 | 0 | $0 |
| Noordende Alexander M Van 'T | · | 03 Marzo 2026 A | 12.423 | 0 | 0 | $0 |
| Brad W Buss | · | 03 Marzo 2026 A | 28.513 | 0 | 0 | $0 |
| Douglas Stotlar | · | 03 Marzo 2026 A | 38.804 | 0 | 0 | $0 |
| Derek J Kerr | · | 03 Marzo 2026 A | 3.677 | 0 | 0 | $0 |
| Michael John Donnelly | · | 27 Luglio 2016 S | 7.180 | 0 | 0 | $0 |
| Jane A Chmielinski | · | 25 Marzo 2014 M | 3.114 | 0 | 0 | $0 |
| Stephen Malcolm Gillis | · | 07 Marzo 2013 A | 4.885 | 0 | 0 | $0 |
| J. H. Whitney Equity Partners VI, LLC | · | 15 Maggio 2007 C | 638.213 | 0 | 0 | $0 |
| J H Whitney VI L P | · | 15 Maggio 2007 C | 638.213 | 0 | 0 | $0 |
Insider dai depositi SEC Modulo 3/4/5; netto = solo acquisti/vendite di mercato
Proprietà ETF Posseduti da 76 ETF
Il peso riflette solo le partecipazioni azionarie dirette (N-PORT); fondi a leva o basati su derivati possono detenere ulteriore esposizione swap non mostrata.
| Fondo | Peso | Unità | Aggiornato al | Fonte |
|---|---|---|---|---|
| PHO · Invesco Exchange-Traded Fund Trust | 3,06% | 1.004.583 SH | 23 Ottobre 2026 | Giornaliero |
| RUNN · Strategic Trust | 1,38% | 85.194 NS | 31 Agosto 2026 | N-PORT |
| QIDX · Spinnaker ETF Series | 1,02% | 5.460 NS | 31 Luglio 2026 | N-PORT |
| GRPM · Invesco Exchange-Traded Fund Trust | 0,93% | 93.569 SH | 23 Ottobre 2026 | Giornaliero |
| XMHQ · Invesco Exchange-Traded Fund Trust | 0,89% | 817.181 SH | 23 Ottobre 2026 | Giornaliero |
| SMDX · Tidal Trust III | 0,88% | 15.826 NS | 31 Luglio 2026 | N-PORT |
| FXR · First Trust Exchange-Traded AlphaDE… | 0,70% | 71.434 NS | 31 Luglio 2026 | N-PORT |
| SDVD · First Trust Exchange-Traded Fund IV | 0,62% | 77.644 NS | 31 Luglio 2026 | N-PORT |
| RWK · Invesco Exchange-Traded Fund Trust … | 0,59% | 126.243 SH | 23 Ottobre 2026 | Giornaliero |
| HSMV · First Trust Exchange-Traded Fund III | 0,50% | 2.452 NS | 31 Luglio 2026 | N-PORT |
| IQSM · New York Life Investments ETF Trust | 0,35% | 15.951 NS | 31 Luglio 2026 | N-PORT |
| IVOV · VANGUARD ADMIRAL FUNDS | 0,29% | 61.806 SH | 19 Agosto 2026 | Giornaliero |
| FBUF · Fidelity Greenwood Street Trust | 0,27% | 897 NS | 31 Luglio 2026 | N-PORT |
| QVMM · Invesco Exchange-Traded Fund Trust … | 0,27% | 18.334 SH | 23 Ottobre 2026 | Giornaliero |
| PTMC · Pacer Funds Trust | 0,26% | 14.214 NS | 31 Luglio 2026 | N-PORT |
| FHEQ · Fidelity Greenwood Street Trust | 0,25% | 32.376 NS | 31 Luglio 2026 | N-PORT |
| IVOO · VANGUARD ADMIRAL FUNDS | 0,25% | 207.785 SH | 19 Agosto 2026 | Giornaliero |
| AFMC · First Trust Exchange-Traded Fund VI… | 0,23% | 7.359 NS | 31 Agosto 2026 | N-PORT |
| RDVI · First Trust Exchange-Traded Fund IV | 0,23% | 115.550 NS | 31 Luglio 2026 | N-PORT |
| BKMC · BNY Mellon ETF Trust | 0,22% | 19.674 NS | 31 Luglio 2026 | N-PORT |
| IVOG · VANGUARD ADMIRAL FUNDS | 0,21% | 55.799 SH | 19 Agosto 2026 | Giornaliero |
| BBMC · J.P. Morgan Exchange-Traded Fund Tr… | 0,20% | 56.240 NS | 31 Luglio 2026 | N-PORT |
| MIDU · Direxion Shares ETF Trust | 0,20% | 1.887 NS | 31 Luglio 2026 | N-PORT |
| VBR · VANGUARD INDEX FUNDS | 0,19% | 1.871.253 SH | 19 Agosto 2026 | Giornaliero |
| FYEE · Fidelity Greenwood Street Trust | 0,18% | 5.311 NS | 31 Luglio 2026 | N-PORT |
| FSMD · FIDELITY COVINGTON TRUST | 0,16% | 56.494 NS | 31 Luglio 2026 | N-PORT |
| TEXN · iShares Trust | 0,13% | 401 SH | 11 Settembre 2026 | Giornaliero |
| FIDU · FIDELITY COVINGTON TRUST | 0,13% | 42.461 NS | 31 Luglio 2026 | N-PORT |
| VIS · VANGUARD WORLD FUND | 0,12% | 157.119 SH | 19 Agosto 2026 | Giornaliero |
| ISCG · iShares Trust | 0,12% | 17.998 SH | 11 Settembre 2026 | Giornaliero |
| DFAS · Dimensional ETF Trust | 0,11% | 239.579 NS | 31 Luglio 2026 | N-PORT |
| SMMD · iShares Trust | 0,11% | 68.973 SH | 11 Settembre 2026 | Giornaliero |
| VB · VANGUARD INDEX FUNDS | 0,11% | 2.947.967 SH | 19 Agosto 2026 | Giornaliero |
| IYJ · iShares Trust | 0,10% | 30.710 SH | 11 Settembre 2026 | Giornaliero |
| VXF · VANGUARD INDEX FUNDS | 0,10% | 1.475.164 SH | 19 Agosto 2026 | Giornaliero |
| ESML · iShares Trust | 0,10% | 43.023 SH | 11 Settembre 2026 | Giornaliero |
| TILT · FlexShares Trust | 0,09% | 27.176 NS | 31 Luglio 2026 | N-PORT |
| IWS · iShares Trust | 0,08% | 191.453 SH | 11 Settembre 2026 | Giornaliero |
| WSML · iShares Trust | 0,08% | 8.163 SH | 11 Settembre 2026 | Giornaliero |
| DFSU · Dimensional ETF Trust | 0,06% | 19.877 NS | 31 Luglio 2026 | N-PORT |
| JVAL · J.P. Morgan Exchange-Traded Fund Tr… | 0,06% | 6.890 NS | 31 Luglio 2026 | N-PORT |
| IWR · iShares Trust | 0,06% | 527.396 SH | 11 Settembre 2026 | Giornaliero |
| DEUS · DBX ETF Trust | 0,05% | 2.427 NS | 31 Agosto 2026 | N-PORT |
| DIVB · iShares Trust | 0,05% | 17.279 SH | 11 Settembre 2026 | Giornaliero |
| DXUV · Dimensional ETF Trust | 0,05% | 4.029 NS | 31 Luglio 2026 | N-PORT |
| EQAL · Invesco Exchange-Traded Fund Trust … | 0,04% | 5.567 SH | 23 Ottobre 2026 | Giornaliero |
| IUS · Invesco Exchange-Traded Self-Indexe… | 0,04% | 6.503 SH | 23 Ottobre 2026 | Giornaliero |
| DFAC · Dimensional ETF Trust | 0,04% | 249.244 NS | 31 Luglio 2026 | N-PORT |
| DFUV · Dimensional ETF Trust | 0,03% | 66.964 NS | 31 Luglio 2026 | N-PORT |
| VONV · VANGUARD SCOTTSDALE FUNDS | 0,03% | 77.801 SH | 19 Agosto 2026 | Giornaliero |
| MNZL · EA Series Trust | 0,03% | 90 NS | 31 Luglio 2026 | N-PORT |
| PRF · Invesco Exchange-Traded Fund Trust | 0,02% | 41.034 SH | 23 Ottobre 2026 | Giornaliero |
| DCOR · Dimensional ETF Trust | 0,02% | 11.064 NS | 31 Luglio 2026 | N-PORT |
| QARP · DBX ETF Trust | 0,02% | 270 NS | 31 Agosto 2026 | N-PORT |
| IWD · iShares Trust | 0,02% | 286.011 SH | 11 Settembre 2026 | Giornaliero |
| DFAU · Dimensional ETF Trust | 0,02% | 30.558 NS | 31 Luglio 2026 | N-PORT |
| IUSV · iShares Trust | 0,01% | 63.919 SH | 11 Settembre 2026 | Giornaliero |
| IWB · iShares Trust | 0,01% | 88.529 SH | 11 Settembre 2026 | Giornaliero |
| IWV · iShares Trust | 0,01% | 36.647 SH | 11 Settembre 2026 | Giornaliero |
| IYY · iShares Trust | 0,01% | 5.361 SH | 11 Settembre 2026 | Giornaliero |
| ITOT · iShares Trust | 0,01% | 168.195 SH | 11 Settembre 2026 | Giornaliero |
| DFUS · Dimensional ETF Trust | 0,01% | 29.993 NS | 31 Luglio 2026 | N-PORT |
| VTI · VANGUARD INDEX FUNDS | 0,01% | 4.077.525 SH | 19 Agosto 2026 | Giornaliero |
| VT · VANGUARD INTERNATIONAL EQUITY INDEX… | 0,01% | 114.047 SH | 19 Agosto 2026 | Giornaliero |
| VONE · VANGUARD SCOTTSDALE FUNDS | 0,01% | 21.647 SH | 19 Agosto 2026 | Giornaliero |
| VTHR · VANGUARD SCOTTSDALE FUNDS | 0,01% | 10.936 SH | 19 Agosto 2026 | Giornaliero |
| IUSG · iShares Trust | 0,01% | 49.224 SH | 11 Settembre 2026 | Giornaliero |
| OMFL · Invesco Exchange-Traded Self-Indexe… | 0,00% | 3.485 SH | 23 Ottobre 2026 | Giornaliero |
| IJH · iShares Trust | · | 4.510.068 SH | 11 Settembre 2026 | Giornaliero |
| IJK · iShares Trust | · | 327.583 SH | 11 Settembre 2026 | Giornaliero |
| IJJ · iShares Trust | · | 366.991 SH | 21 Agosto 2026 | Giornaliero |
| IFRA · iShares Trust | · | 203.050 SH | 11 Settembre 2026 | Giornaliero |
| XJH · iShares Trust | · | 17.557 SH | 08 Settembre 2026 | Giornaliero |
| ISCB · iShares Trust | · | 5.768 SH | 11 Settembre 2026 | Giornaliero |
| ISCV · iShares Trust | · | 16.038 SH | 11 Settembre 2026 | Giornaliero |
| SMLF · iShares Trust | · | 65.322 SH | 11 Settembre 2026 | Giornaliero |
ACM Consenso degli analisti Opinioni degli analisti, sia rialziste che ribassiste, target price a 12 mesi, potenziale di rialzo
Target Price a 12 Mesi
12 analisti · 2026-10-27Target medio $83.92 +38,2%
Confronto Peer (GICS sub-settore industriale) Metriche chiave rispetto ai pari del settore
Base FY, prezzi alla chiusura dell'ultimo anno fiscale di ciascuna società.
| Ticker | Capitalizzazione di Mercato | P/E | Rev YoY | Margine Netto | ROE | Margine lordo |
|---|---|---|---|---|---|---|
| ACM | $17.19B | 31.0 | 0.21% | 3.5% | 24.0% | 7.5% |
| APG | $15.91B | -55.4 | 12.7% | 3.8% | 9.2% | 31.4% |
| MTZ | · | 42.9 | 16.2% | 2.8% | 12.9% | · |
| STRL | $9.40B | 32.6 | 17.7% | 11.7% | 30.3% | 23.0% |
| IESC | $7.90B | 26.5 | 16.9% | 9.1% | 38.5% | 25.5% |
| VMI | · | 24.6 | 0.71% | 8.5% | 22.2% | 30.2% |
| DY | $10.92B | 38.1 | 17.9% | 5.1% | 17.4% | · |
| FLR | · | -127.8 | -5.0% | · | · | · |
| ECG | $4.36B | 21.7 | 31.5% | 5.4% | 35.3% | 12.1% |
| ROAD | · | 69.0 | 54.2% | 3.6% | 11.8% | 15.6% |
| GVA | $5.02B | 29.9 | 10.4% | 4.4% | 17.6% | 16.1% |
Ultime notizie Notizie recenti che menzionano questa società
Le Mie Metriche La tua watchlist personale — righe selezionate da Fondamentali Completi
Scegli le metriche che contano per te: fai clic sul + accanto a qualsiasi riga in Fondamentali Completi sopra.
La tua selezione è salvata e ti segue su tutti i ticker.