
KGC Kinross Gold Corporation Common Stock
NYSE · Metals & Mining · Visualizza su SEC EDGAR ↗ 10-K/10-Q Mar 26, 2026KGC Snapshot del titolo Prezzo, capitalizzazione di mercato, P/E, EPS, ROE, debito/capitale proprio, intervallo 52 settimane
KGC Grafico del prezzo delle azioni OHLCV giornaliero con indicatori tecnici — panoramica, zoom e personalizza la tua visualizzazione
La granularità delle barre si adatta al periodo selezionato — passa il mouse sul grafico per vedere apertura/massimo/minimo/chiusura di una barra.
| Data ex-dividendo | Split | Tipo |
|---|---|---|
| 03 Febbraio 2003 | 1-for-3 | Inverso |
Informazioni su Kinross Gold Corporation Common Stock Panoramica della società da Wikipedia
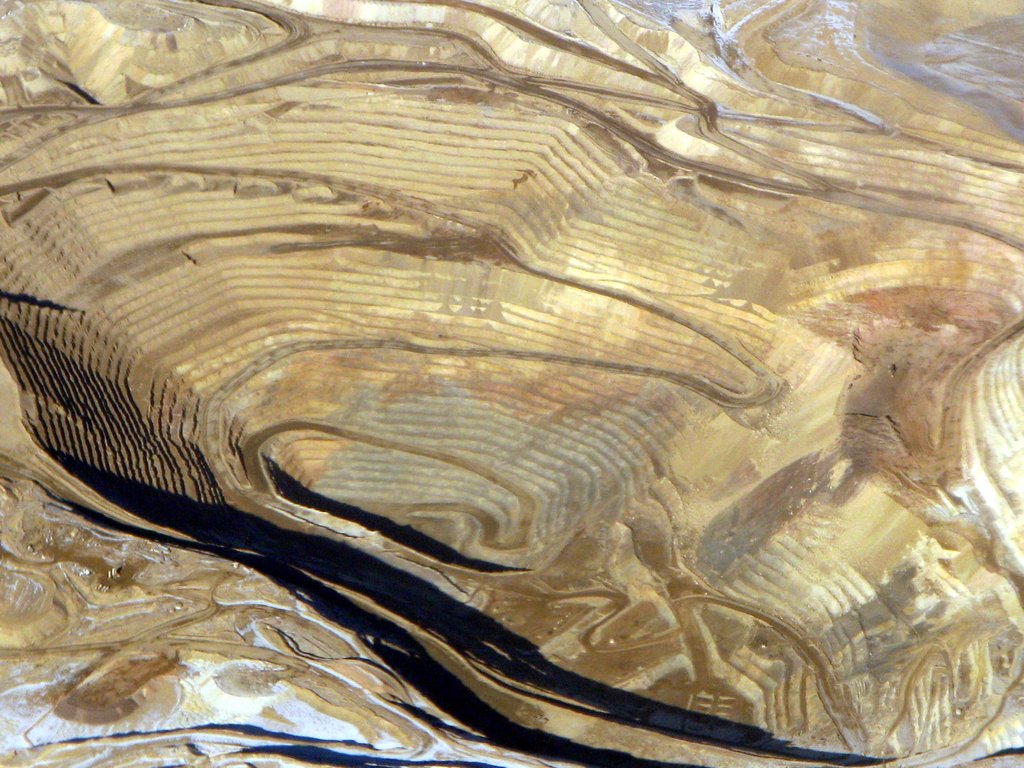
Kinross Gold Corporation is a Canadian gold and silver mining company founded in 1993 and headquartered in Toronto, Ontario, Canada. Kinross currently operates six active gold mines, and was ranked fifth of the "10 Top Gold-mining Companies" of 2019 by InvestingNews. The company's mines are located in Brazil, Mauritania, and the United States. It trades under the KGC ticker in the New York Stock Exchange, and under K in the Toronto Stock Exchange.
Operations
Kinross Gold operates mines in North and South America, and West Africa. In 2022, 58% of Kinross gold production was expected to come from the Americas.
Fort Knox
This property includes a mill, tailings storage, heap leach facility, the Gil project, and the True North open pit mine, which is closed and under monitoring. Expected to run out of ore in 2021, the mine's life has been extended to 2030 following a $100 million expansion investment announced in 2018, increasing life-of-mine production by about 1.5 million gold equivalent ounces.
Round Mountain
The Round Mountain Gold Mine is located in Nye County, Nevada and has operated by Kinross since 2003. They purchased the remaining outstanding interest in the company from Barrick Gold in 2016.
Bald Mountain
Located in White Pine County, Nevada, the Bald Mountain mine is operated by subsidiary KG Mining (Bald Mountain) Inc.
Paracatu
The open-pit Paracatu gold mine, located in northwest Minas Gerais, Brazil.
Tasiast
Kinross acquired the Tasiast mine (located in Mauritania) in 2010, expanding the operation twice by 2017.
In 2012, securities class action lawsuits launched in the U.S. and Canada, alleging Kinross Gold overstated the value of Tasiast mine in its financial statements, misrepresented some of the mine's project expansion schedules, and made other false statements. In 2015, the parties reached no-fault settlement agreements which included payments by Kinross totaling approximately $US 40 million.
In June 2016, due to "government allegations of invalid work permits" for expatriate employees, the mine suspended operations, resuming them in August that same year.
In May 2020, there was a short strike by unionized employees at the mine, which was suspended at the request of the Mauritanian government. A month later, Kinross reached an agreement in principle with the government, which included revalued royalties.
Chirano
Kinross holds 90% ownership of the Chirano gold mine, with the remainder held by the Government of Ghana. In April 2022, Kinross announced plans to sell its 90% ownership for US$225-million to Asante Gold Corp.
History
Founding and early years
Kinross Gold Corporation was founded in 1993, following the amalgamation of three companies: Plexus Resources Corporation, CMP Resources and numbered company 1021105 Ontario Corp., resulting in the new company owning a stake and royalties in a mining property in Fallon, Nevada and the QR Mine in British Columbia. On June 1, 1993, Kinross was listed on the Toronto Stock Exchange and NASDAQ, then on the New York Stock Exchange in 1994.
Kinross' first project – now operated by its subsidiary Fairbanks Gold Mining – was the Fort Knox Gold Mine, an open-pit mining operation in Alaska. The area, including surrounding deposits, was prospected as early as 1913, but no mining took place until 1996. The mine currently produces over 200,000 ounces of gold a year.
In 1998, a wholly owned subsidiary of Kinross merged with Amax Gold, forming Kinam Gold, the company's largest subsidiary. effectively transferring ownership of the mine back to Kinross, along with Maricunga Gold Mine in Chile, as part of the merger.
1999–2006
Kinross acquired Hollinger Mines in 1999 as part of a land package prior to the bankruptcy of Royal Oak Mines (later sold to Goldcorp in 2006). Also that year, Kinross acquired LA Teko Resources Ltd. through its wholly owned subsidiary, LT Acquisition Inc. division.
In July 2002, Kinross and Placer Dome combined their assets in Timmins, Ontario and formed the Porcupine Joint Venture (51% Placer Dome, 49% Kinross). In January 2003 Kinross TVX Gold and Echo Bay Mines shareholders approved a $3-billion merger, combining the three companies, while retaining the name Kinross Gold. The TVX merger resulted in Kinross' stake in the La Coipa open pit mine, the remainder being purchased from Goldcorp in 2007.
In 2006, Kinross bought Crown Resources Corporation, which gave it ownership of the mineral resource Buckhorn Mountain (later Buckhorn Gold Mine) and the associated mineral processing facilities.
2007–present
In 2007, Kinross traded assets with Goldcorp; Kinross received $200 million and the remaining portion of the La Coipa Gold Mine it had acquired with the TVX merger, in exchange for giving up its 49% of the Porcupine Joint Venture and 31.9% of the Musselwhite mine.
In 2010, Kinross purchased 91% of Red Back Mining for $7.1 billion. The purchase brought with it the two gold mines in Africa (Chirano and Tasiast). Also that year, Kinross acquired the Dvoinoye deposit and the property in Vodorazdelnaya, about 90 kilometres (56 mi) north of Kinross’ Kupol operation. In 2011, Kinross entered into a share purchase agreement with the State Unitary Enterprise of the Chukotka Autonomous Okrug, whereby it held 100% of the Kupol mine and exploration licenses. Kinross sold its interest in the Crixás mine to AngloGold Ashanti in 2012.
In December 2017, Kinross acquired mineral rights to Gilmore, or Parcel G, a 709-acre tract adjacent to its Fort Knox Gold Mine, about 25 miles northeast of Fairbanks, Alaska. Estimates of the land valued it as containing 2.1 million ounces of gold.
In December 2021, Kinross offered to acquire Great Bear Resources for $29 per share, or about $1.8 billion, giving it ownership of a gold mining prospect in Red Lake, Ontario, Canada. Kinross shares dropped 9% after it announced the buyout bid. The deal to acquire Great Bear closed on February 24, 2022.
Non-operating, discontinued and divested mines
Julietta Mine is a gold and silver mine located in the Omsukchansky District of Magadan Oblast, near Russia's far eastern border.
Kettle River-Buckhorn - the Washington-state based mine and mill were acquired by Kinross in 2006, and was closed in 2017.
Mineral Hill - located on the east side of Crevice Mountain, Montana, Mineral Hill operated from 1990 to 1996. In 2017, Kinross donated water rights representing 3 billion gallons of water to Trout Unlimited to protect fish habitat in tributaries of the Yellowstone River.
Cerro Casale - Chile-based mine acquired by Kinross in 2007. As of 2015, the mine was inactive, and Kinross divested in 2017.
Crixás - Kinross sold its 50% interest in the Brazil-based mine to AngloGold Ashanti for $220 million.
Fruta del Norte - Kinross purchased 100% of outstanding shares in the Ecuadorian deposit in 2008, but ceased development in 2013, and sold the rights in 2014.
La Coipa - Kinross incurred an impairment charge of $124 million in 2014 after development on the Chile-based mine ceased. In February 2020, Kinross announced it was proceeding with the La Coipa Restart project to mine the Phase 7 deposit, expected to operate from 2022 to 2024.
Lobo-Marte - After acquiring 40% interest in the Chile mine in 2008, Kinross acquired the remaining interest in 2009, for a total cost of $182 million. The results of a pre-feasibility study at Lobo-Marte was announced in July 2020. Subject to development decision, project construction will begin in 2025, with production expected in 2027.
Maricunga - Operations ceased in August 2016, after the Chilean government shut off the mine's water supply over environmental concerns. As a result, 300 employees were laid off, and Kinross incurred an impairment charge of $68 million.
Dvoinoye Gold Mine & Kupol Gold Mine - The Dvoinoye and Kupol gold mines are located in Russia approximately 100 kilometres (60 mi) apart; Dvoinoye is an underground mine, while Kupol is a combination of open-pit and underground. Acquired in 2010 and opened in 2013, Dvionoye/Kupol was one of Kinross' most profitable segments. In April 2022, Kinross announced that it was selling 100% of its Russian assets to the Highland Gold Mining, completing the sale of Russian assets two months later.
Financial performance
Gold production
Annual gold production (thousands of ounces) was:
2013 - 2,631
2014 - 2,710
2015 - 2,594
2016 - 2,789
2017 - 2,673
2018 - 2,450
2019 - 2,507
2020 - 2,366
2021 - 2,063
Gold reserves
Kinross' proven and probable gold reserves were 32.6 million ounces as of December 31, 2021.
Assets
Kinross Gold's total assets decreased significantly in recent years, from $US 16.39 billion in 2010 to $US 7.73 billion in 2015.
Other
Kinross suspended dividend payments in 2013. It started paying again in 2020, and that year, also announced a share buyback program.
In 2015 in the wake of declining gold prices, Kinross closed their office in Denver and eliminated 110 corporate positions in Denver, Chile, Spain, and Toronto.
In 2016, Standard & Poor's lowered Kinross' credit rating to junk bond status, largely based on the share of their production that came from mines in Russia, which the agency saw as a significant risk.
In 2017, Moody's Investors Service assigned a Ba1 rating to Kinross, "primarily driven by the company's good scale (2.78 million gold-equivalent ounces (GEO) as of March 2017 LTM), low leverage (1.7x LTM adjusted Debt/EBITDA), and very good liquidity (SGL-1).
On March 2, 2020, Moody's announced it had upgraded Kinross's credit rating to investment grade. Their senior unsecured notes rating was upgraded to Ba1, with a stable outlook. Kinross currently holds investment grade ratings from Moody's, S&P Global Ratings, and Fitch Ratings.
Corporate responsibility
In 2015, Kinross achieved an A− ranking in Maclean's magazine's annual assessment of socially responsible companies, the highest ranking of any Canadian mining company.
For Kinross' cooperation with an environmental group in Washington state, and for five out of eight mines being in compliance with the International Cyanide Management Code (as of May 2013, the Company had eight of its nine mines in compliance with the International Cyanide Management Code), Kinross was recognized as one of Canada's Top 50 Most Responsible Corporations by Maclean's magazine and Jantzi Research in 2009.
Through a $1 million donation by Kinross in 2010, the University of Guelph created a new chair as part of its BetterPlanet Project. Said Chair is named the Kinross Chair in Environmental Governance, and is held by a "succession of experts". Also with the university, Kinross provided $100 thousand towards its Fight Against Hunger.
In 2010, Kinross committed to contribute $10 million over a three-year period towards developing a mining school in Mauritania. The following year, it committed $2.5 million to build and equip a medical emergency centre in that country.
In 2013, Kinross was named to the Dow Jones Sustainability World Index for the third consecutive year, as well as the DJSI North American Index, the Ethibel Excellence Investment Register, and the Ethical Global Equity and ECPI Global Carbon Indices. For the fifth consecutive year, the company was named to the Jantzi Social Index, and as one of Canada's Best 50 Corporate Citizens by Corporate Knights magazine for the fourth year.
In 2021, Kinross was ranked no. 22 out of 120 oil, gas, and mining companies involved in resource extraction north of the Arctic Circle in the Arctic Environmental Responsibility Index (AERI).
Carbon footprint
Kinross Gold reported Total CO2e emissions (Direct + Indirect) for the twelve months ending 31 December 2020 at 1,631 Kt (+19/+1.2% y-o-y). There have been not any significant reductions in emissions in recent years. In May 2021, Kinross committed to reaching net-zero greenhouse gas emissions by 2050.
Fonte: Wikipedia (Inglese), CC BY-SA 4.0 · Vedi su Wikipedia ↗
Performance decennale Andamento di ricavi, utile netto, margini e EPS
Valutazione Rapporti P/E, P/S, P/B, EV/EBITDA — il titolo è costoso o economico?
| Metrica | Tendenza 5 anni | KGC | media 5 anni | Mediana dei peer | Verdetto |
|---|---|---|---|---|---|
| P/E | 14.4media 5 anni ≈13.9 | ≈13.9 | · | · |
La mediana dei peer viene calcolata su base standardizzata per metrica e potrebbe non corrispondere sempre alla base TTM/MRQ mostrata per questo titolo.
Redditività Margini lordi, operativi e netti; ROE, ROA, ROIC
| Metrica | Tendenza 5 anni | KGC | media 5 anni | Mediana dei peer | Verdetto |
|---|---|---|---|---|---|
| ROA | 20.5%media 5 anni ≈5.9% | ≈5.9% | · | · | |
| ROE | 31.0%media 5 anni ≈9.2% | ≈9.2% | · | · | |
| ROIC | 29.5%media 5 anni ≈11.2% | ≈11.2% | · | · |
Salute finanziaria Debito, liquidità, solvibilità — solidità del bilancio
| Metrica | Tendenza 5 anni | KGC | media 5 anni | Mediana dei peer | Verdetto |
|---|---|---|---|---|---|
| Current Ratio (Rapporto corrente) | 2.3media 5 anni ≈2.4 | ≈2.4 | · | · | |
| Quick Ratio | 0.7media 5 anni ≈0.6 | ≈0.6 | · | · | |
| Interest Coverage (Copertura degli interessi) | 40.1media 5 anni ≈18.1 | ≈18.1 | · | · |
Crescita Crescita di ricavi, EPS e utile netto: YoY, CAGR 3Y, CAGR 5Y
Dati fondamentali insufficienti per calcolare questo gruppo di rapporti.
Efficienza del Capitale Rotazione delle attività, rotazione delle scorte, rotazione dei crediti
| Metrica | Tendenza 5 anni | KGC | media 5 anni | Mediana dei peer | Verdetto |
|---|---|---|---|---|---|
| Inventory Turnover (Rotazione delle scorte) | 2.6media 5 anni ≈2.6 | ≈2.6 | · | · |
valore · ≈ media 5 anni · mediana del settore · giudizio rispetto alla mediana
Dividendi Rendimento, payout ratio, storico dividendi, CAGR 5Y
| Data ex-dividendo | Importo | Valuta | Rendimento |
|---|---|---|---|
| Ago 20, 2026 | $0,04 | USD | ≈0.48% |
| Mag 21, 2026 | $0,04 | USD | ≈0.49% |
| Mar 11, 2026 | $0,04 | USD | ≈0.31% |
| Ago 21, 2025 | $0,03 | USD | ≈0.62% |
| Mag 29, 2025 | $0,03 | USD | ≈0.82% |
| Mar 5, 2025 | $0,03 | USD | ≈1.0% |
| Nov 27, 2024 | $0,03 | USD | ≈1.2% |
| Ago 22, 2024 | $0,03 | USD | ≈1.3% |
| Mag 30, 2024 | $0,03 | USD | ≈1.5% |
| Mar 5, 2024 | $0,03 | USD | ≈2.3% |
| Nov 29, 2023 | $0,03 | USD | ≈2.1% |
| Ago 23, 2023 | $0,03 | USD | ≈2.4% |
| Mag 31, 2023 | $0,03 | USD | ≈2.5% |
| Mar 7, 2023 | $0,03 | USD | ≈3.4% |
| Nov 30, 2022 | $0,03 | USD | ≈2.9% |
| Ago 17, 2022 | $0,03 | USD | ≈3.5% |
| Giu 1, 2022 | $0,03 | USD | ≈2.7% |
| Mar 8, 2022 | $0,03 | USD | ≈2.1% |
| Nov 30, 2021 | $0,03 | USD | ≈2.0% |
| Ago 18, 2021 | $0,03 | USD | ≈2.6% |
Cronologia utili EPS effettivo vs stima, surprise %, tasso di superamento, data prossimi utili
| Periodo | Rapporto | EPS Actual | EPS Stimato | Sorpresa |
|---|---|---|---|---|
| 30 Giugno 2026 | $0.71 | $0.74 | -4.1% | |
| 31 Marzo 2026 | $0.71 | $0.67 | 5.5% | |
| 31 Dicembre 2025 | $0.67 | $0.60 | 11.4% | |
| 30 Settembre 2025 | $0.44 | $0.37 | 20.2% | |
| 30 Giugno 2025 | $0.44 | $0.30 | 46.2% | |
| 31 Marzo 2025 | $0.30 | $0.23 | 28.6% |
Fondamentali Completi Tutte le metriche per anno — conto economico, stato patrimoniale, rendiconto finanziario
Conto Economico
| Metrica | Tendenza | 2025 | 2024 | 2023 | 2022 | 2021 | 2020 | 2019 | 2018 | 2017 | 2016 |
|---|---|---|---|---|---|---|---|---|---|---|---|
| Cost of Revenue | $3.34B | $3.27B | $3.08B | $2.94B | $2.06B | $1.92B | $2.15B | $2.63B | $2.60B | $2.98B | |
| Gross Profit | $3.72B | $1.88B | $1.16B | $515M | $541M | $2.30B | $1.35B | $580M | $705M | $494M | |
| SG&A Expense | $140M | $126M | $109M | $130M | $114M | $118M | $136M | $133M | $133M | $144M | |
| Operating Income | $3.28B | $1.54B | $801M | $118M | $72M | $1.90B | $991M | $200M | $336M | $46M | |
| Interest Expense | $82M | $50M | $69M | $68M | $72M | $90M | $77M | $72M | $86M | $100M | |
| Interest Income | $73M | $18M | $40M | $18M | $11M | $4M | $8M | $11M | $14M | $8M | |
| Pretax Income | $3.19B | $1.48B | $709M | $107M | $84M | $1.80B | $964M | $113M | $419M | $-60M | |
| Income Tax | $725M | $487M | $293M | $76M | $115M | $440M | $247M | $139M | $-23M | $50M | |
| Net Income | $2.39B | $949M | $416M | $-605M | $221M | $1.34B | $719M | $-24M | $445M | $-104M | |
| EPS (Basic) | $1.96 | $0.77 | $0.34 | $-0.47 | $0.18 | $1.07 | $0.57 | $-0.02 | $0.36 | $-0.08 | |
| EPS (Diluted) | $1.95 | $0.77 | $0.34 | $-0.47 | $0.17 | $1.06 | $0.57 | $-0.02 | $0.35 | $-0.08 | |
| Shares (Basic) | 1,219,466,000 | 1,228,855,000 | 1,226,985,000 | 1,280,531,000 | 1,259,059,000 | 1,257,200,000 | 1,252,300,000 | 1,249,500,000 | 1,246,619,000 | 1,227,007,000 | |
| Shares (Diluted) | 1,224,607,000 | 1,234,504,000 | 1,236,670,000 | 1,292,811,000 | 1,259,059,000 | 1,268,000,000 | 1,262,300,000 | 1,249,500,000 | 1,257,045,000 | 1,227,007,000 | |
| EBITDA | $4.38B | $2.69B | $1.79B | $902M | $1.30B | $2.74B | $1.72B | $973M | $1.16B | · |
Stato Patrimoniale
| Metrica | Tendenza | 2025 | 2024 | 2023 | 2022 | 2021 | 2020 | 2019 | 2018 | 2017 | 2016 |
|---|---|---|---|---|---|---|---|---|---|---|---|
| Cash & Equivalents | $887M | $282M | $198M | $270M | $387M | $562M | $306M | $208M | $601M | $514M | |
| Receivables | $30M | $53M | $58M | $318M | $214M | $116M | $137M | $101M | $91M | $127M | |
| Inventory | $1.37B | $1.24B | $1.15B | $1.07B | $1.15B | $1.07B | $1.05B | $1.05B | $1.09B | $987M | |
| Current Assets | $3.29B | $2.13B | $1.80B | $1.85B | $1.95B | $2.45B | $1.82B | $1.60B | $2.28B | $2.08B | |
| PP&E (Net) | $8.29B | $7.97B | $7.96B | $7.74B | $7.62B | $7.65B | $6.34B | $5.52B | $4.89B | $4.92B | |
| Goodwill | · | · | · | · | $159M | $159M | $159M | $163M | $163M | $163M | |
| Total Assets | $12.41B | $10.87B | $10.54B | $10.40B | $10.43B | $10.93B | $9.08B | $8.06B | $8.16B | $7.98B | |
| Accounts Payable | $716M | $543M | $532M | $550M | $493M | $479M | $469M | $466M | $483M | $465M | |
| Current Liabilities | $1.40B | $1.06B | $686M | $752M | $741M | $1.35B | $616M | $612M | $585M | $638M | |
| Total Liabilities | $3.72B | $3.87B | $4.36B | $4.51B | $3.78B | $4.27B | $3.74B | $3.54B | $3.54B | $3.79B | |
| Retained Earnings | $-5.94B | $-8.18B | $-8.98B | $-9.25B | $-8.49B | $-8.56B | $-9.83B | $-10.55B | $-10.58B | $-11.03B | |
| Stockholders' Equity | $8.58B | $6.86B | $6.08B | $5.82B | $6.58B | $6.60B | $5.32B | $4.51B | $4.58B | $4.15B |
Flusso di cassa
| Metrica | Tendenza | 2025 | 2024 | 2023 | 2022 | 2021 | 2020 | 2019 | 2018 | 2017 | 2016 |
|---|---|---|---|---|---|---|---|---|---|---|---|
| D&A | $1.10B | $1.15B | $987M | $784M | $696M | $842M | $731M | $772M | $819M | $855M | |
| Other Non-cash | $265M | $350M | · | · | $73M | $-227M | $-225M | $40M | $-313M | · | |
| Operating Cash Flow | $3.76B | $2.45B | $1.61B | · | $1.14B | $1.96B | $1.22B | $789M | $952M | $1.10B | |
| CapEx | $1.19B | $1.08B | $1.10B | $764M | $822M | $916M | $1.06B | $1.04B | $898M | $634M | |
| Investing Cash Flow | · | · | · | · | $-1.19B | $-1.25B | $-1.03B | $-1.39B | $-687M | $-1.27B | |
| Financing Cash Flow | $-1.63B | $-1.01B | $-549M | · | $-623M | $-68M | $25M | $-73M | $-69M | $-48M | |
| Free Cash Flow | $2.57B | $1.37B | · | · | $197M | $1.04B | $120M | $-255M | $54M | · | |
| Levered FCF | $2.50B | $1.34B | · | · | $163M | $974M | $62M | $-238M | $-37M | · |
Redditività
| Metrica | Tendenza | 2025 | 2024 | 2023 | 2022 | 2021 | 2020 | 2019 | 2018 | 2017 | 2016 |
|---|---|---|---|---|---|---|---|---|---|---|---|
| ROA | 20.5% | 8.9% | 4.0% | -5.8% | 2.1% | 13.4% | 8.4% | -0.29% | 5.5% | · | |
| ROE | 31.0% | 14.7% | 7.0% | -9.8% | 3.4% | 22.5% | 14.6% | -0.52% | 10.2% | · | |
| ROIC | 29.5% | 15.1% | 7.7% | 0.58% | 3.3% | 21.8% | 13.9% | -1.0% | 7.8% | · |
Liquidità e Solvibilità
| Metrica | Tendenza | 2025 | 2024 | 2023 | 2022 | 2021 | 2020 | 2019 | 2018 | 2017 | 2016 |
|---|---|---|---|---|---|---|---|---|---|---|---|
| Current Ratio | 2.3 | 2.0 | 2.6 | 2.5 | 2.6 | 1.8 | 3.0 | 2.6 | 3.9 | · | |
| Quick Ratio | 0.7 | 0.3 | 0.7 | 0.8 | 0.8 | 0.5 | 0.7 | 0.5 | 1.2 | · | |
| Interest Coverage | 40.1 | 30.5 | 11.6 | 1.7 | 6.5 | 21.2 | 12.9 | 2.8 | 3.9 | · |
Efficienza
| Metrica | Tendenza | 2025 | 2024 | 2023 | 2022 | 2021 | 2020 | 2019 | 2018 | 2017 | 2016 |
|---|---|---|---|---|---|---|---|---|---|---|---|
| Inventory Turnover | 2.6 | 2.7 | 2.8 | 2.6 | 2.4 | 1.8 | 2.0 | 2.5 | 2.5 | · |
Per Azione
| Metrica | Tendenza | 2025 | 2024 | 2023 | 2022 | 2021 | 2020 | 2019 | 2018 | 2017 | 2016 |
|---|---|---|---|---|---|---|---|---|---|---|---|
| Cash Flow / Share | $3.07 | $1.98 | · | · | $0.89 | $1.54 | $0.97 | $0.63 | $0.76 | · | |
| EPS (TTM) | $1.95 | $0.77 | $0.34 | $-0.47 | $0.17 | $1.06 | $0.57 | $-0.02 | $0.35 | · |
Valutazione (TTM)
| Metrica | Tendenza | 2025 | 2024 | 2023 | 2022 | 2021 | 2020 | 2019 | 2018 | 2017 | 2016 |
|---|---|---|---|---|---|---|---|---|---|---|---|
| Net Income TTM | $2.39B | $949M | $416M | $-605M | $221M | $1.34B | $719M | $-24M | $445M | · | |
| P/E | 14.4 | 12.0 | 17.8 | -8.7 | 34.2 | 6.9 | 8.3 | -162.0 | 12.3 | · | |
| Earnings Yield | 6.9% | 8.3% | 5.6% | -11.5% | 2.9% | 14.4% | 12.0% | -0.62% | 8.1% | · |
Per Azione
| Metrica | Tendenza | Q4 2016 | Q4 2015 | Q4 2014 | Q4 2013 | Q4 2012 | Q4 2011 | Q4 2010 | Q4 2009 | Q4 2008 | Q4 2007 | Q4 2006 | Q4 2005 | Q4 2004 | Q4 2003 | Q4 2002 |
|---|---|---|---|---|---|---|---|---|---|---|---|---|---|---|---|---|
| EPS (TTM) | $-0.08 | · | · | · | · | · | · | · | · | · | · | · | · | · | · |
Valutazione (TTM)
| Metrica | Tendenza | Q4 2016 | Q4 2015 | Q4 2014 | Q4 2013 | Q4 2012 | Q4 2011 | Q4 2010 | Q4 2009 | Q4 2008 | Q4 2007 | Q4 2006 | Q4 2005 | Q4 2004 | Q4 2003 | Q4 2002 |
|---|---|---|---|---|---|---|---|---|---|---|---|---|---|---|---|---|
| Net Income TTM | $-104M | · | · | · | · | · | · | · | · | · | · | · | · | · | · | |
| P/E | -38.9 | · | · | · | · | · | · | · | · | · | · | · | · | · | · | |
| Earnings Yield | -2.6% | · | · | · | · | · | · | · | · | · | · | · | · | · | · |
Periodo più recente a sinistra · valori nulli mostrati come ·
Bilanci Conto economico, stato patrimoniale, flusso di cassa — annuale, ultimi 5 anni
| Metrica | 2025-12-31 | 2024-12-31 | 2023-12-31 | 2022-12-31 | 2021-12-31 |
|---|---|---|---|---|---|
| Utile netto | $2.39B | $949M | $416M | $-605M | $221M |
| EPS Diluito | $1.95 | $0.77 | $0.34 | $-0.47 | $0.17 |
| Metrica | 2025-12-31 | 2024-12-31 | 2023-12-31 | 2022-12-31 | 2021-12-31 |
|---|---|---|---|---|---|
| Rapporto corrente | 2.3 | 2.0 | 2.6 | 2.5 | 2.6 |
| Quick Ratio | 0.7 | 0.3 | 0.7 | 0.8 | 0.8 |
| Metrica | 2025-12-31 | 2024-12-31 | 2023-12-31 | 2022-12-31 | 2021-12-31 |
|---|---|---|---|---|---|
| Flusso di cassa libero | $2.57B | $1.37B | · | · | $197M |
Proprietari istituzionali (13F) 707 filer · $19.1B totale · Aggiornato al 30 Settembre 2026
Istituzioni che segnalano il possesso di questo titolo nel loro Modulo SEC 13F trimestrale. Solo posizioni lunghe; un singolo depositante può apparire due volte per diverse gambe di opzioni. Grandi posizioni put/call contrapposte riflettono tipicamente market-making o inventario coperto, non convinzione direzionale.
| Nuove posizioni | Posizioni chiuse | Aumentato | Diminuito | Variazione netta delle azioni |
|---|---|---|---|---|
| 76 (-54 vs trimestre precedente) | 90 (+31 vs trimestre precedente) | 252 (+15 vs trimestre precedente) | 242 (+12 vs trimestre precedente) | +16.4M |
Confrontato con Q1 2026. Le dichiarazioni SEC Form 13F sono dovute entro 45 giorni dalla fine del trimestre più un breve margine per i dichiaranti in ritardo — i trimestri ancora all'interno di questa finestra vengono saltati a favore della coppia più recente completamente riportata.
| Istituzione | Valore | Azioni | % di 13F tracciati | Tipo |
|---|---|---|---|---|
| VANGUARD GROUP INC | $1.433.344.952 | 50.887.386 | 7,52% | Azioni |
| VAN ECK ASSOCIATES CORP | $1.295.586.963 | 54.855.608 | 6,80% | Azioni |
| Boston Partners | $899.756.645 | 36.038.587 | 4,72% | Azioni |
| VANGUARD CAPITAL MANAGEMENT LLC | $789.855.012 | 33.359.590 | 4,14% | Azioni |
| ROYAL BANK OF CANADA | $779.032.000 | 32.981.828 | 4,09% | Azioni |
| ARROWSTREET CAPITAL, LIMITED PARTNERSHIP | $697.850.348 | 29.515.179 | 3,66% | Azioni |
| RENAISSANCE TECHNOLOGIES LLC | $584.529.171 | 24.747.213 | 3,07% | Azioni |
| FIL Ltd | $490.677.660 | 20.723.752 | 2,57% | Azioni |
| MACKENZIE FINANCIAL CORP | $436.040.296 | 12.985.119 | 2,29% | Azioni |
| GEODE CAPITAL MANAGEMENT, LLC | $370.263.818 | 14.840.976 | 1,94% | Azioni |
| BANK OF MONTREAL /CAN/ | $342.235.637 | 14.468.801 | 1,80% | Azioni |
| 1832 Asset Management L.P. | $337.595.653 | 14.292.788 | 1,77% | Azioni |
| NORGES BANK | $313.894.501 | 13.274.824 | 1,65% | Azioni |
| MORGAN STANLEY | $306.631.520 | 12.981.858 | 1,61% | Azioni |
| Man Group plc | $298.152.337 | 12.621.448 | 1,56% | Azioni |
| CIBC Asset Management Inc | $275.302.096 | 11.602.154 | 1,44% | Azioni |
| Connor, Clark & Lunn Investment Management Ltd. | $264.652.432 | 11.188.912 | 1,39% | Azioni |
| BANK OF AMERICA CORP /DE/ | $255.636.580 | 10.822.887 | 1,34% | Azioni |
| VANGUARD FIDUCIARY TRUST CO | $251.039.891 | 10.602.690 | 1,32% | Azioni |
| JPMORGAN CHASE & CO | $250.490.610 | 10.533.666 | 1,31% | Azioni |
| Legal & General Group Plc | $244.762.202 | 10.341.184 | 1,28% | Azioni |
| NATIONAL BANK OF CANADA /FI/ | $244.381.964 | 10.328.709 | 1,28% | Azioni |
| SCHRODER INVESTMENT MANAGEMENT GROUP | $238.085.019 | 10.079.806 | 1,25% | Azioni |
| Allianz Asset Management GmbH | $227.141.000 | 9.596.638 | 1,19% | Azioni |
| MANUFACTURERS LIFE INSURANCE COMPANY, THE | $222.973.542 | 9.435.939 | 1,17% | Azioni |
| DEUTSCHE BANK AG\ | $217.800.021 | 9.221.000 | 1,14% | Azioni |
| CANADA PENSION PLAN INVESTMENT BOARD | $217.190.177 | 9.182.216 | 1,14% | Azioni |
| GOLDMAN SACHS GROUP INC | $215.600.711 | 9.127.887 | 1,13% | Azioni |
| Ninety One UK Ltd | $207.995.648 | 8.614.109 | 1,09% | Azioni |
| AQR CAPITAL MANAGEMENT LLC | $205.351.902 | 8.777.685 | 1,08% | Azioni |
| Amundi | $197.878.133 | 8.376.494 | 1,04% | Azioni |
| Invesco Ltd. | $188.345.194 | 7.973.971 | 0,99% | Azioni |
| CIBC WORLD MARKET INC. | $186.048.766 | 7.864.688 | 0,98% | Azioni |
| FMR LLC | $168.707.882 | 7.130.430 | 0,89% | Azioni |
| AustralianSuper Pty Ltd | $166.115.355 | 7.022.910 | 0,87% | Azioni |
| TORONTO DOMINION BANK | $156.848.972 | 6.631.151 | 0,82% | Azioni |
| DIMENSIONAL FUND ADVISORS LP | $156.143.384 | 6.610.297 | 0,82% | Azioni |
| TD Asset Management Inc | $155.927.792 | 6.587.926 | 0,82% | Azioni |
| First Eagle Investment Management, LLC | $151.522.135 | 6.414.993 | 0,80% | Azioni |
| MASSACHUSETTS FINANCIAL SERVICES CO /MA/ | $150.902.208 | 5.199.404 | 0,79% | Azioni |
| BANK OF NOVA SCOTIA | $125.827.667 | 5.314.702 | 0,66% | Azioni |
| Vanguard Global Advisers, LLC | $121.079.963 | 5.113.822 | 0,64% | Azioni |
| AMERICAN CENTURY COMPANIES INC | $118.689.383 | 5.020.395 | 0,62% | Azioni |
| UBS Group AG | $116.009.631 | 4.911.500 | 0,61% | Azioni |
| TWO SIGMA INVESTMENTS, LP | $92.890.799 | 3.932.718 | 0,49% | Azioni |
| Swiss National Bank | $91.377.497 | 3.870.618 | 0,48% | Azioni |
| JANE STREET GROUP, LLC | $87.359.728 | 3.698.549 | 0,46% | Azioni |
| CI INVESTMENTS INC. | $84.137.581 | 3.562.133 | 0,44% | Azioni |
| BlackRock, Inc. | $83.289.851 | 3.526.243 | 0,44% | Azioni |
| Cape Ann Asset Management Ltd | $82.913.617 | 3.510.314 | 0,44% | Azioni |
Attivisti e proprietari del 5%+ 17 partecipazioni
Investitori che hanno depositato SEC Schedule 13D — proprietà effettiva superiore al 5% con l'intento di influenzare l'emittente (partecipazioni attiviste, campagne per il consiglio di amministrazione, M&A). Ogni riga mostra lo stato più recente noto della posizione di quel depositante.
| Depositante | Depositato | Partecipazione | Stato | Scopo | Deposito |
|---|---|---|---|---|---|
| Kinross Gold Corporation ×5 depositi | 30 Marzo 2011 | · | Deposito iniziale | · | SEC |
| Persona segnalante non divulgata | 14 Aprile 2006 | · | Deposito iniziale | M&A / vendita | SEC |
| Persona segnalante non divulgata | 28 Novembre 2005 | · | Deposito iniziale | Investimento passivo | SEC |
| Persona segnalante non divulgata | 26 Ottobre 2004 | · | Deposito iniziale | · | SEC |
| Persona segnalante non divulgata | 30 Agosto 2004 | · | Deposito iniziale | · | SEC |
| Persona segnalante non divulgata | 05 Agosto 2004 | · | Deposito iniziale | · | SEC |
| Persona segnalante non divulgata | 07 Giugno 2004 | · | Deposito iniziale | · | SEC |
| Persona segnalante non divulgata | 30 Aprile 2004 | · | Deposito iniziale | Investimento passivo | SEC |
| Persona segnalante non divulgata | 31 Dicembre 2003 | · | Deposito iniziale | · | SEC |
| Persona segnalante non divulgata, Persona segnalante non divulgata, Persona segnalante non divulgata | 19 Settembre 2003 | · | Deposito iniziale | · | SEC |
| Persona segnalante non divulgata, Persona segnalante non divulgata, Persona segnalante non divulgata | 16 Settembre 2003 | · | Deposito iniziale | · | SEC |
| Persona segnalante non divulgata, Persona segnalante non divulgata, Persona segnalante non divulgata | 06 Agosto 2003 | · | Deposito iniziale | · | SEC |
| Persona segnalante non divulgata, Persona segnalante non divulgata, Persona segnalante non divulgata | 10 Febbraio 2003 | · | Deposito iniziale | Investimento passivo | SEC |
| Persona segnalante non divulgata | 26 Aprile 2002 | · | Deposito iniziale | · | SEC |
| Persona segnalante non divulgata | 09 Aprile 2002 | · | Deposito iniziale | Campagna per il consiglio di amministrazione | SEC |
| Persona segnalante non divulgata | 14 Settembre 2001 | · | Deposito iniziale | Campagna per il consiglio di amministrazione | SEC |
| Persona segnalante non divulgata | 20 Luglio 2001 | · | Deposito iniziale | · | SEC |
Purpose is an automated classification of the filer's own stated purpose (SEC Item 4) — not investment advice. "—" means no clear purpose was stated or the text could not be classified.
Proprietà ETF Posseduti da 27 ETF
Il peso riflette solo le partecipazioni azionarie dirette (N-PORT); fondi a leva o basati su derivati possono detenere ulteriore esposizione swap non mostrata.
| Fondo | Peso | Unità | Aggiornato al | Fonte |
|---|---|---|---|---|
| MGNR · AMERICAN BEACON SELECT FUNDS | 2,76% | 1.006.954 NS | 31 Luglio 2026 | N-PORT |
| ABLD · Abacus FCF ETF Trust | 2,32% | 92.972 NS | 31 Luglio 2026 | N-PORT |
| NRES · DBX ETF Trust | 2,02% | 24.738 NS | 31 Agosto 2026 | N-PORT |
| ABLG · Abacus FCF ETF Trust | 1,60% | 11.196 NS | 31 Luglio 2026 | N-PORT |
| ICOW · Pacer Funds Trust | 1,17% | 918.496 NS | 31 Luglio 2026 | N-PORT |
| DARP · Tidal Trust II | 1,08% | 15.535 NS | 31 Luglio 2026 | N-PORT |
| BBCA · J.P. Morgan Exchange-Traded Fund Tr… | 0,90% | 4.249.615 NS | 31 Luglio 2026 | N-PORT |
| IGE · iShares Trust | 0,84% | 232.961 SH | 11 Settembre 2026 | Giornaliero |
| GUNR · FlexShares Trust | 0,67% | 2.111.502 NS | 31 Luglio 2026 | N-PORT |
| FEDM · FlexShares Trust | 0,56% | 19.257 NS | 31 Luglio 2026 | N-PORT |
| DIHP · Dimensional ETF Trust | 0,52% | 1.435.670 NS | 31 Luglio 2026 | N-PORT |
| PIEL · Pacer Funds Trust | 0,37% | 184 NS | 31 Luglio 2026 | N-PORT |
| WLDR · Two Roads Shared Trust | 0,26% | 10.431 NS | 31 Luglio 2026 | N-PORT |
| FTLS · First Trust Exchange-Traded Fund III | 0,26% | 276.036 NS | 31 Luglio 2026 | N-PORT |
| DXIV · Dimensional ETF Trust | 0,21% | 18.797 NS | 31 Luglio 2026 | N-PORT |
| DFAX · Dimensional ETF Trust | 0,19% | 994.129 NS | 31 Luglio 2026 | N-PORT |
| DFIC · Dimensional ETF Trust | 0,19% | 1.201.837 NS | 31 Luglio 2026 | N-PORT |
| FDEV · Fidelity Covington Trust | 0,17% | 21.233 NS | 31 Luglio 2026 | N-PORT |
| SPWO · SP Funds Trust | 0,14% | 12.250 NS | 31 Luglio 2026 | N-PORT |
| DFSI · Dimensional ETF Trust | 0,13% | 62.862 NS | 31 Luglio 2026 | N-PORT |
| DFAI · Dimensional ETF Trust | 0,13% | 947.691 NS | 31 Luglio 2026 | N-PORT |
| BKIE · BNY Mellon ETF Trust | 0,11% | 60.474 NS | 31 Luglio 2026 | N-PORT |
| DEEF · DBX ETF Trust | 0,10% | 1.928 NS | 31 Agosto 2026 | N-PORT |
| TLTD · FlexShares Trust | 0,09% | 25.410 NS | 31 Luglio 2026 | N-PORT |
| GLBL · Pacer Funds Trust | 0,07% | 32 NS | 31 Luglio 2026 | N-PORT |
| KOKU · DBX ETF Trust | 0,04% | 10.902 NS | 31 Agosto 2026 | N-PORT |
| DFIV · Dimensional ETF Trust | 0,01% | 85.829 NS | 31 Luglio 2026 | N-PORT |
KGC Consenso degli analisti Opinioni degli analisti, sia rialziste che ribassiste, target price a 12 mesi, potenziale di rialzo
Target Price a 12 Mesi
10 analisti · 2026-10-25Target medio $31.00 +38,8%
Ultime notizie Notizie recenti che menzionano questa società
Le Mie Metriche La tua watchlist personale — righe selezionate da Fondamentali Completi
Scegli le metriche che contano per te: fai clic sul + accanto a qualsiasi riga in Fondamentali Completi sopra.
La tua selezione è salvata e ti segue su tutti i ticker.