
EDN Empresa Distribuidora Y Comercializadora Norte S.A. (Edenor) American Depositary Shares
NYSE · Utilities · SEC EDGAR で表示 ↗ 終値 10月 2, 2026 10-K/10-Q 4月 15, 2026EDN 株価スナップショット 価格、時価総額、P/E、EPS、ROE、負債/資本、52週レンジ
EDN 株価チャート 技術指標付きの日次 OHLCV — パン、ズーム、ビューのカスタマイズ
バーの粒度は選択した期間に合わせて調整されます。バーの始値/高値/安値/終値を確認するにはチャートにカーソルを合わせてください。
Empresa Distribuidora Y Comercializadora Norte S.A. (Edenor) American Depositary Shares について Wikipediaからの企業概要
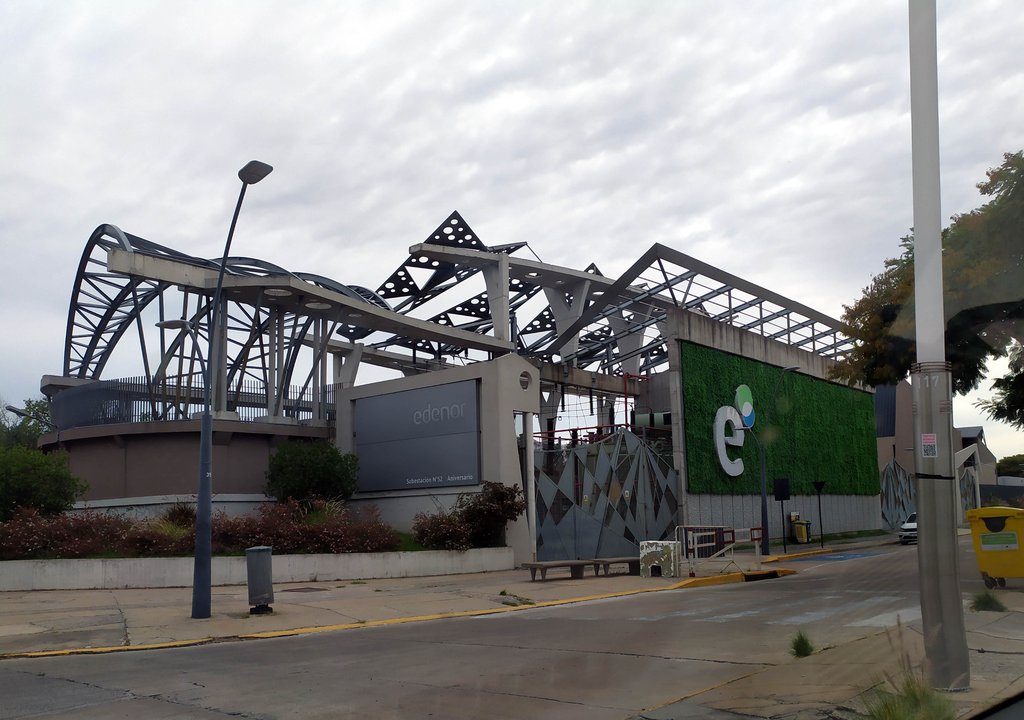
Edenor is a public Argentine electricity distribution company founded in 1992 and headquartered in Buenos Aires. The company has an exclusive concession to distribute electricity in the northwestern section of Greater Buenos Aires, and in the north of Buenos Aires proper, selling electric power to residential, commercial, industrial, and government customers.
Edenor's 34,500 kilometers of network and 2.5 million customers represent 18.5% of the Argentine market in its industry.
History
Edenor was established on July 21, 1992, as part of the broader privatization of Servicios Eléctricos del Gran Buenos Aires S.A. (SEGBA), a state-owned entity responsible for electricity distribution in Buenos Aires. SEGBA was split into three distribution companies—Edenor, Edesur, and Edelap—as well as several generation companies. This restructuring was intended to promote competition and efficiency in the sector.
EDF International S.A., was among the international investors that acquired a controlling interest in Edenor through an Argentine holding company named EASA. The concession agreement granted to Edenor was set for 95 years, lasting until 2087. By September 1992, EASA had secured a majority shareholding in the company.
In the early 1990s, Edenor faced significant challenges, particularly with electricity theft, which was rampant in certain areas, especially in shantytowns. The company attempted to mitigate these losses by installing automatic circuit breakers to regulate power usage. However, community and political activists put up opposition, resulting in compromises that allowed people to continue using electricity while trying to limit usage of high-energy appliances.
The 2000s were a period of significant change for Edenor. During this decade, ownership of the company changed hands several times. In 2002, EDF sold a majority stake to the Dolphin Group, which later became part of the Grupo Emes. This group eventually integrated Edenor into Pampa Energía S.A., a major player in Argentina's energy sector.
In the 2010s, Edenor responded to regulation changes and tried to modernize its operations. The Argentine government implemented a Comprehensive Tariff Review in 2017, adjusting electricity rates to reflect operational costs more accurately. This process included public hearings and aimed to address the financial instability of the sector, which had been affected by currency devaluation and inflation.
Edenor also embraced digital transformation during this period, launching the Edenor Digital platform in 2017. This platform, accessible via a website and mobile application, enabled customers to manage their accounts, view and pay bills, and monitor electricity consumption online. The company's modernization efforts also extended to sustainability, as Edenor adopted the United Nations Sustainable Development Goals in 2017 and began piloting renewable energy initiatives.
Financial activity
For the period ending September 30, 2024, Edenor reported a profit of ARS 235,069 million attributable to its shareholders. The company’s total equity was recorded at ARS 1,119,525 million.
In October 2024, Edenor completed a private exchange offer for its 9.75% Senior Notes due 2025. As part of the transaction, the company issued new 9.75% Senior Notes maturing in 2030, with approximately 85.12% of the existing notes tendered and accepted in the exchange. Additionally, Edenor issued an extra US$135 million in new notes.
In November 2024, Fitch Ratings upgraded Edenor’s Foreign and Local Currency Issuer Default Ratings from CCC to CCC+. The company’s bonds were also raised to a B− rating, accompanied by an improved Recovery Rating of RR3.
Edenor shareholder José Luis Manzano, along with partners Daniel Vila and Mauricio Filiberti, agreed in 2026 to buy YPF's roughly 70% stake in Metrogas and MetroEnergía for US $780 million, following a competitive sale process run by Citigroup on YPF's behalf. The deal gave Manzano control of Argentina's largest gas distributor, adding to a 9.23% stake he already held through Integra Gas Distribution, and extended his energy holdings beyond his position in Edenor. The sale was part of YPF's broader strategy under CEO Horacio Marín to divest non-core assets and concentrate investment in Vaca Muerto oil and gas development.
Renewable energy
In March 2018, Edenor became the first company in Argentina to purchase a fully electric vehicle, adding the Renault Kangoo ZE to its fleet in Buenos Aires.
That same year, the company started testing small-scale power generation systems with energy consumption between 10 and 50 kW in Buenos Aires City and Greater Buenos Aires.
Edenor also installed solar panels at their building on Avenida Andrés Rolón in San Isidro, which allowed them to generate and feed electricity back into the grid.
== References ==
出典: Wikipedia (英語), CC BY-SA 4.0 · Wikipediaで表示 ↗
10年間のパフォーマンス 収益、純利益、利益率、EPSのトレンド
バリュエーション P/E、P/S、P/B、EV/EBITDA比率 — 株は割高か割安か?
| 指標 | 5年トレンド | EDN | 5年平均 | 競合中央値 | 結論 |
|---|---|---|---|---|---|
| P/E | 0.15年平均 ≈0.0 | ≈0.0 | · | · |
同業他社の中央値は、指標ごとに標準化された基準で計算されており、この銘柄に表示されているTTM/MRQ基準と常に一致するとは限りません。
収益性 粗利益率、営業利益率、純利益率、ROE、ROA、ROIC
| 指標 | 5年トレンド | EDN | 5年平均 | 競合中央値 | 結論 |
|---|---|---|---|---|---|
| Gross Margin (粗利益率) | 22.8%5年平均 ≈12.5% | ≈12.5% | · | · | |
| Operating Margin (営業利益率) | 4.8%5年平均 ≈-5.9% | ≈-5.9% | · | · | |
| EBITDA Margin (EBITDAマージン) | 11.6%5年平均 ≈2.7% | ≈2.7% | · | · | |
| Pretax Margin (税引前利益率) | 9.7%5年平均 ≈7.8% | ≈7.8% | · | · | |
| Net Profit Margin (純利益率) | 8.0%5年平均 ≈0.17% | ≈0.17% | · | · | |
| ROA | 4.4%5年平均 ≈0.19% | ≈0.19% | · | · | |
| ROE | 11.4%5年平均 ≈4.9% | ≈4.9% | · | · | |
| ROIC | 5.3%5年平均 ≈-37.0% | ≈-37.0% | · | · |
財務健全性 負債、流動性、支払能力 — バランスシートの健全性
| 指標 | 5年トレンド | EDN | 5年平均 | 競合中央値 | 結論 |
|---|---|---|---|---|---|
| Current Ratio (流動比率) | 1.15年平均 ≈0.7 | ≈0.7 | · | · | |
| Quick Ratio (クイックレシオ) | 0.45年平均 ≈0.3 | ≈0.3 | · | · | |
| Interest Coverage (インタレスト・カバレッジ) | 0.55年平均 ≈0.0 | ≈0.0 | · | · |
成長 収益、EPS、純利益の成長率:前年比、3年CAGR、5年CAGR
この指標グループを計算するには、まだファンダメンタルズデータが不足しています。
資本効率 総資産回転率、棚卸資産回転率、売掛金回転率
| 指標 | 5年トレンド | EDN | 5年平均 | 競合中央値 | 結論 |
|---|---|---|---|---|---|
| Asset Turnover (総資産回転率) | 0.55年平均 ≈0.5 | ≈0.5 | · | · | |
| Receivables Turnover (売掛金回転率) | 6.05年平均 ≈6.4 | ≈6.4 | · | · | |
| Revenue / Employee (年間売上高 ÷ 従業員数(yfinanceの報告ヘッドカウント)。派生値 — SEC-XBRLの保存概念ではありません。) | ≈$653.6M | · | · | · |
バリュエーション · ≈ 5年平均 · 業界中央値 · 中央値に対する評価
決算履歴 EPS実績 vs 予想、サプライズ%、達成率、次回決算日
| 期間 | レポート | EPS Actual | EPS 予想 | サプライズ |
|---|---|---|---|---|
| 2024年12月31日 | $42.35 | $-4.24 | 1098.3% | |
| 2024年9月30日 | $130.79 | $-0.40 | 32473.8% | |
| 2024年6月30日 | $54.02 | $-2.34 | 2405.4% | |
| 2024年3月31日 | $58.13 | $-2.51 | 2411.4% | |
| 2023年12月31日 | $-5.20 | $-3.85 | -35.1% | |
| 2023年3月31日 | $-272.87 | — | — |
完全なファンダメンタルズ 年次別全指標 — 損益計算書、貸借対照表、キャッシュフロー
損益計算書
| 指標 | トレンド | 2025 | 2024 | 2023 | 2022 | 2021 | 2020 | 2019 | 2018 | 2017 | 2016 |
|---|---|---|---|---|---|---|---|---|---|---|---|
| Revenue | $2.99T | $2.69T | $2.01T | $1.40T | $688.50B | $268.39B | $184.74B | $117.12B | $60.90B | $25.83B | |
| Gross Profit | $680.58B | $519.09B | $79.42B | $50.82B | $88.49B | $39.74B | $34.41B | $27.56B | $14.66B | $573M | |
| Operating Income | $143.14B | $55.35B | $-343.14B | $-211.91B | $-26.67B | $-58.53B | $9.76B | $9.48B | $3.65B | $-2.79B | |
| Interest Expense | $313.71B | $447.81B | $915.07B | $595.22B | $163.54B | $27.26B | $-13.89B | $10.42B | $3.95B | $2.59B | |
| Interest Income | $1.80B | $1.61B | $1.05B | $442M | $395M | $162M | $118M | $176M | $698M | $385M | |
| Pretax Income | $291.33B | $254.26B | $521.88B | $-17.88B | $-34.63B | $-62.49B | $46.85B | $12.93B | $8.60B | $388M | |
| Income Tax | $52.10B | $-103.72B | $270.11B | $26.14B | $94.84B | $-10.47B | $21.92B | $3.93B | $784M | $147M | |
| Net Income | $240.38B | $360.97B | $249.07B | $-46.90B | $-128.69B | $-51.79B | $24.91B | $8.99B | $7.84B | $250M | |
| EPS (Basic) | $273.41 | $409.12 | $287.73 | $-50.30 | $-147.97 | $-59.45 | $18.88 | $10.11 | · | · | |
| EPS (Diluted) | $273.41 | $409.12 | $287.73 | $-50.30 | $-147.97 | · | · | · | · | · | |
| Shares (Diluted) | 875,000,000 | 875,000,000 | 875,000,000 | 875,000,000 | 875,000,000 | 875 | 875,000,000 | 890 | 898,280,000 | 897,043,000 | |
| EBITDA | $346.41B | $196.63B | $-37.03B | $-13.06B | $4.70B | $-13.41B | $3.60B | $3.94B | $2.49B | · |
貸借対照表
| 指標 | トレンド | 2025 | 2024 | 2023 | 2022 | 2021 | 2020 | 2019 | 2018 | 2017 | 2016 |
|---|---|---|---|---|---|---|---|---|---|---|---|
| Cash & Equivalents | $136.91B | $26.55B | $4.00B | $2.70B | $2.96B | $2.47B | $218M | $42M | $-375M | $259M | |
| Receivables | $496.26B | $506.77B | $145.02B | $189.82B | $34.21B | $21.35B | $16.96B | $11.67B | $8.39B | $3.90B | |
| Inventory | $233.31B | $197.02B | $86.70B | $43.66B | $6.70B | $2.82B | $2.62B | $1.94B | $650M | $288M | |
| Current Assets | $1.56T | $1.27T | $505.68B | $565.97B | $81.82B | $35.17B | $24.33B | $21.08B | $13.75B | $6.62B | |
| PP&E (Net) | $4.13T | $3.95T | $3.65T | $2.69T | $1.19T | $367.14B | $208.06B | $130.77B | $119.44B | $50.89B | |
| Total Assets | $5.76T | $5.24T | $3.29T | $3.26T | $463.27B | $224.51B | $162.63B | $118.39B | $70.88B | $18.93B | |
| Accounts Payable | $527.05B | $998.15B | $524.70B | $1.22T | $148.39B | $33.02B | $17.29B | $22.46B | $13.58B | $6.82B | |
| Current Liabilities | $1.46T | $1.43T | $774.64B | $1.35T | $189.96B | $63.62B | $33.46B | $32.26B | $18.52B | $9.56B | |
| Total Liabilities | $3.54T | $3.25T | $2.05T | $2.21T | $319.72B | $129.61B | $82.11B | $70.77B | $43.09B | $18.57B | |
| Retained Earnings | $239.24B | $334.25B | $-18.04B | $-209.43B | $-41.58B | $-26.70B | $16.52B | $20.32B | $8.98B | $-1.19B | |
| Stockholders' Equity | $2.22T | $1.98T | $1.62T | $1.37T | $1.09T | $575.68B | $236.66B | $97.81B | $58.18B | $34.88B |
キャッシュフロー
| 指標 | トレンド | 2025 | 2024 | 2023 | 2022 | 2021 | 2020 | 2019 | 2018 | 2017 | 2016 |
|---|---|---|---|---|---|---|---|---|---|---|---|
| D&A | $203.27B | $203.32B | $237.06B | $123.38B | $55.21B | $19.11B | $9.50B | $5.36B | · | · | |
| Other Non-cash | $-251.62B | $-183.04B | $-58.71B | $35.13B | $33.46B | $28.45B | · | · | · | · | |
| Operating Cash Flow | $192.04B | $323.50B | $204.74B | $240.24B | $129.50B | $50.94B | $20.87B | $20.14B | $11.17B | $4.97B | |
| CapEx | $368.47B | $473.53B | $343.13B | $215.14B | $89.33B | $28.94B | $19.25B | $17.31B | $12.14B | $4.23B | |
| Investing Cash Flow | $-461.55B | $-746.20B | $-226.48B | $-253.35B | $-154.96B | $-36.60B | $-4.53B | $-17.43B | $-13.08B | $-4.07B | |
| Financing Cash Flow | $435.08B | $348.84B | $21.02B | $-32.29B | $-8.72B | $-18.08B | $-10.42B | $-4.39B | $1.33B | $-947M | |
| Free Cash Flow | $-176.43B | $-114.05B | $-48.31B | $3.70B | $6.62B | $7.49B | $788M | $1.35B | $-349M | · | |
| Levered FCF | $-434.04B | $-593.34B | $-133.12B | $-578.39B | $107.44B | $-232M | $-2.81B | $-2.11B | $587M | · |
収益性
| 指標 | トレンド | 2025 | 2024 | 2023 | 2022 | 2021 | 2020 | 2019 | 2018 | 2017 | 2016 |
|---|---|---|---|---|---|---|---|---|---|---|---|
| Gross Margin | 22.8% | 19.3% | 4.0% | 3.7% | 12.8% | 14.8% | 18.6% | 23.5% | 27.5% | · | |
| Operating Margin | 4.8% | 2.1% | -17.1% | -15.2% | -3.9% | -21.8% | 4.0% | 7.0% | 10.2% | · | |
| Net Margin | 8.0% | 13.4% | 6.8% | -8.7% | -18.7% | -19.3% | 13.5% | 7.7% | 2.8% | · | |
| Pretax Margin | 9.7% | 9.5% | 26.0% | -1.3% | -5.0% | -23.3% | 25.4% | 11.0% | 4.6% | · | |
| EBITDA Margin | 11.6% | 9.6% | -5.3% | -6.3% | 4.1% | -14.7% | 4.0% | 7.0% | 10.2% | · | |
| ROA | 4.4% | 7.5% | 2.0% | -3.8% | -9.2% | -11.3% | 10.2% | 5.8% | 3.1% | · | |
| ROE | 11.4% | 17.5% | 5.2% | -2.9% | -6.5% | -11.8% | 15.4% | 9.6% | 3.9% | · | |
| ROIC | 5.3% | 3.9% | -7.2% | -164.9% | -22.3% | -26.4% | 3.2% | 8.9% | 142.8% | · |
流動性と支払能力
| 指標 | トレンド | 2025 | 2024 | 2023 | 2022 | 2021 | 2020 | 2019 | 2018 | 2017 | 2016 |
|---|---|---|---|---|---|---|---|---|---|---|---|
| Current Ratio | 1.1 | 0.9 | 0.7 | 0.4 | 0.4 | 0.6 | 0.7 | 0.7 | 0.7 | · | |
| Quick Ratio | 0.4 | 0.4 | 0.2 | 0.1 | 0.2 | 0.4 | 0.5 | 0.4 | 0.5 | · | |
| Interest Coverage | 0.5 | 0.1 | -0.4 | -0.4 | 0.2 | -2.1 | 0.5 | 0.8 | -1.6 | · |
効率性
| 指標 | トレンド | 2025 | 2024 | 2023 | 2022 | 2021 | 2020 | 2019 | 2018 | 2017 | 2016 |
|---|---|---|---|---|---|---|---|---|---|---|---|
| Asset Turnover | 0.5 | 0.6 | 0.3 | 0.4 | 0.5 | 0.6 | 0.8 | 0.8 | 1.1 | · | |
| Receivables Turnover | 6.0 | 8.1 | 5.5 | 6.6 | 5.8 | 5.9 | 7.5 | 7.0 | 5.1 | · |
1株あたり
| 指標 | トレンド | 2025 | 2024 | 2023 | 2022 | 2021 | 2020 | 2019 | 2018 | 2017 | 2016 |
|---|---|---|---|---|---|---|---|---|---|---|---|
| Revenue / Share | $3418.16 | $2335.00 | $801.25 | $235240000.00 | $129.71 | $104361142.86 | $102.59 | $62.83 | · | · | |
| Cash Flow / Share | $219.47 | $281.05 | $81.68 | $40486857.14 | $24.40 | $19812571.43 | $11.59 | $10.80 | · | · | |
| EPS (TTM) | $273.41 | $409.12 | $287.73 | $-50.30 | $-147.97 | · | · | · | · | · |
バリュエーション(TTM)
| 指標 | トレンド | 2025 | 2024 | 2023 | 2022 | 2021 | 2020 | 2019 | 2018 | 2017 | 2016 |
|---|---|---|---|---|---|---|---|---|---|---|---|
| Revenue TTM | $2.99T | $2.69T | $2.01T | $1.40T | $688.50B | $268.39B | $184.74B | $117.12B | $60.90B | · | |
| Net Income TTM | $240.38B | $360.97B | $249.07B | $-46.90B | $-128.69B | $-51.79B | $24.91B | $8.99B | $7.84B | · | |
| P/E | 0.1 | 0.1 | 0.1 | -0.2 | -0.0 | · | · | · | · | · | |
| Earnings Yield | 912.6% | 953.4% | 1485.4% | -629.5% | -2791.9% | · | · | · | · | · |
バリュエーション(TTM)
| 指標 | トレンド | Q4 2017 | Q4 2016 | Q4 2015 | Q4 2014 | Q4 2013 | Q4 2012 | Q4 2011 | Q4 2010 | Q4 2009 | Q4 2008 | Q4 2007 |
|---|---|---|---|---|---|---|---|---|---|---|---|---|
| Revenue TTM | $60.90B | $25.83B | $3.80B | · | · | · | · | · | · | · | · | |
| Net Income TTM | $7.84B | $250M | $1.14B | · | · | · | · | · | · | · | · |
最新期間は左側 · null値は・として表示
財務諸表 損益計算書、貸借対照表、キャッシュフロー — 年次、過去5年間
| 指標 | 2025-12-31 | 2024-12-31 | 2023-12-31 | 2022-12-31 | 2021-12-31 |
|---|---|---|---|---|---|
| 収益 | $2.99T | $2.69T | $2.01T | $1.40T | $688.50B |
| 粗利益率 % | 22.8% | 19.3% | 4.0% | 3.7% | 12.8% |
| 営業利益率 % | 4.8% | 2.1% | -17.1% | -15.2% | -3.9% |
| 純利益 | $240.38B | $360.97B | $249.07B | $-46.90B | $-128.69B |
| 希薄化後EPS | $273.41 | $409.12 | $287.73 | $-50.30 | $-147.97 |
| 指標 | 2025-12-31 | 2024-12-31 | 2023-12-31 | 2022-12-31 | 2021-12-31 |
|---|---|---|---|---|---|
| 流動比率 | 1.1 | 0.9 | 0.7 | 0.4 | 0.4 |
| クイックレシオ | 0.4 | 0.4 | 0.2 | 0.1 | 0.2 |
| 指標 | 2025-12-31 | 2024-12-31 | 2023-12-31 | 2022-12-31 | 2021-12-31 |
|---|---|---|---|---|---|
| フリーキャッシュフロー | $-176.43B | $-114.05B | $-48.31B | $3.70B | $6.62B |
機関投資家(13F) 28 提出者 · $48.4M合計 · 時点 2026年6月30日
四半期SECフォーム13Fでこの株式の保有を報告している機関。ロングポジションのみ。単一の提出者は、別々のオプションレッグで2回表示される場合があります。 大きな反対売買のプット/コール・レッグは、通常、マーケットメイクまたはヘッジされた在庫を反映しており、方向性への確信を示すものではありません。
| 新規ポジション | 解消済みポジション | 増加 | 減少 | 純株式数増減 |
|---|---|---|---|---|
| 8 (+2 前期比) | 8 (+4 前期比) | 6 (-4 前期比) | 8 (+2 前期比) | -408K |
Q1 2026と比較しました。 SECフォーム13Fの提出期限は四半期末から45日後ですが、遅延提出者向けの短いバッファーが含まれます。この期間内の四半期は、直近で完全に報告されたペアを優先するためスキップされます。
| 機関投資家 | 評価額 | 株式数 | % 追跡された13Fのうち | タイプ |
|---|---|---|---|---|
| Helikon Investments Ltd | $15,163,899 | 607,528 | 31.36% | 株式数 |
| MIRAE ASSET GLOBAL ETFS HOLDINGS Ltd. | $14,287,379 | 572,411 | 29.55% | 株式数 |
| PING CAPITAL MANAGEMENT, INC. | $5,952,960 | 238,500 | 12.31% | 株式数 |
| MORGAN STANLEY | $3,087,426 | 123,695 | 6.39% | 株式数 |
| MARSHALL WACE, LLP | $2,271,161 | 90,992 | 4.70% | 株式数 |
| WEXFORD CAPITAL LP | $2,068,860 | 82,887 | 4.28% | 株式数 |
| GOLDMAN SACHS GROUP INC | $1,759,905 | 70,509 | 3.64% | 株式数 |
| Point72 Asset Management, L.P. | $969,996 | 38,862 | 2.01% | 株式数 |
| Brevan Howard Capital Management LP | $427,713 | 16,869 | 0.88% | 株式数 |
| CITADEL ADVISORS LLC | $401,706 | 16,094 | 0.83% | 株式数 |
| UBS Group AG | $326,701 | 13,089 | 0.68% | 株式数 |
| Engineers Gate Manager LP | $265,075 | 10,620 | 0.55% | 株式数 |
| JANE STREET GROUP, LLC | $259,484 | 10,396 | 0.54% | 株式数 |
| Militia Capital Partners, LP | $223,232 | 7,451 | 0.46% | 株式数 |
| Jump Financial, LLC | $219,648 | 8,800 | 0.45% | 株式数 |
| JPMORGAN CHASE & CO | $200,254 | 7,795 | 0.41% | 株式数 |
| Aquatic Capital Management LLC | $192,966 | 7,731 | 0.40% | 株式数 |
| Cubist Systematic Strategies, LLC | $128,370 | 8,250 | 0.27% | 株式数 |
| BNP PARIBAS FINANCIAL MARKETS | $45,427 | 1,820 | 0.09% | 株式数 |
| THURSTON, SPRINGER, MILLER, HERD & TITAK, INC. | $43,962 | 1,761 | 0.09% | 株式数 |
| WELLS FARGO & COMPANY/MN | $24,960 | 1,000 | 0.05% | 株式数 |
| CWM, LLC | $15,520 | 517 | 0.03% | 株式数 |
| GAMMA Investing LLC | $11,906 | 477 | 0.02% | 株式数 |
| SBI Securities Co., Ltd. | $3,045 | 122 | 0.01% | 株式数 |
| Stone House Investment Management, LLC | $824 | 33 | 0.00% | 株式数 |
| BARCLAYS PLC | $574 | 23 | 0.00% | 株式数 |
| Smartleaf Asset Management LLC | $206 | 8 | 0.00% | 株式数 |
| OSAIC HOLDINGS, INC. | $150 | 6 | 0.00% | 株式数 |
アクティビストおよび5%超のオーナー 1保有
SECスケジュール13Dを提出した投資家 — 発行体の影響を与える意図(アクティビストの保有、取締役会キャンペーン、M&A)を持つ5%超の受益権所有。各行は、その提出者のポジションの最新の既知の状態を示します。
| 提出者 | 提出済み | 保有 | ステータス | 目的 | 提出書類 |
|---|---|---|---|---|---|
| Pampa Inversiones S.A., Pampa Energía S.A. (Pampa Energy Inc.) ×6 提出書類 | 2013年12月11日 | · | 初回提出 | · | SEC |
Purpose is an automated classification of the filer's own stated purpose (SEC Item 4) — not investment advice. "—" means no clear purpose was stated or the text could not be classified.
ETF保有状況 1のETFが保有
ウェイトは直接株式保有(N-PORT)のみを反映しています。レバレッジ型またはデリバティブベースのファンドは、表示されていない追加のスワップエクスポージャーを保有している可能性があります。
| ファンド | ウェイト | 単位 | 時点 | ソース |
|---|---|---|---|---|
| ARGT · Global X Funds | 1.75% | 552,507 NS | 2026年7月31日 | N-PORT |
EDN アナリストコンセンサス 強気・弱気のアナリストの見解、12ヶ月の目標株価、アップサイド
12ヶ月目標株価
2 アナリスト · 2026-10-03平均値ターゲット $38.50 +93.1%
マイ指標 あなた専用のウォッチリスト — 決算詳細から選択した行
重視する指標を選択してください — 上記の「財務諸表」の任意の行の横にある「+」をクリックしてください。
選択内容は保存され、すべてのティッカーで引き継がれます。