CMSD CMS Energy Corporation 5.875% Junior Subordinated Notes due 2079
NYSE · Utilities · SEC EDGAR에서 보기 ↗ 종가 10월 2, 2026 10-K/10-Q 7월 28, 2026CMSD 주식 스냅샷 가격, 시가총액, P/E, EPS, ROE, 부채/자본, 52주 범위
CMSD 주가 차트 기술 지표가 포함된 일일 OHLCV — 팬, 확대/축소 및 보기 사용자 정의
막대 세분성은 선택한 기간에 따라 조정됩니다. 막대의 시가/고가/저가/종가를 보려면 차트에 마우스를 올리세요.
CMS Energy Corporation 5.875% Junior Subordinated Notes due 2079 정보 위키백과 회사 개요
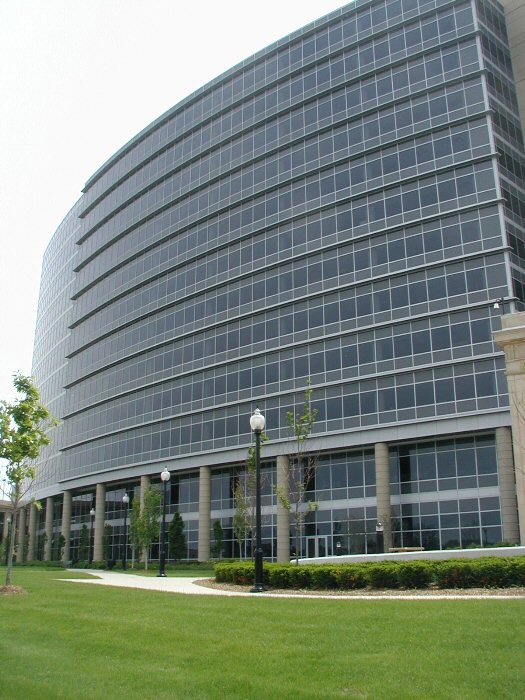
CMS Energy Corporation is an American energy company based in Jackson, Michigan, that is focused principally on utility operations in Michigan. Its principal business is Consumers Energy, a public utility that provides electricity and natural gas to more than 6 million of Michigan's 10 million residents. Its non-utility businesses are focused primarily on domestic independent power production. Consumers Energy has operated since 1886.
NorthStar Clean Energy's primary businesses are independent power production and natural gas transmission.
History
CMS Energy was formed in 1987 as a holding company with its principal subsidiaries as Consumers Energy and NorthStar Clean Energy. On October 23, 1987, CMS Energy became a publicly owned company and was listed at the New York Stock Exchange. The company's history dates back to 1886, when William Augustine Foote and Samuel Jarvis initially approached Jackson, Michigan officials and asked them to support efforts to illuminate Jackson's downtown with electric arc lights. They formed a company, Jackson Electric Light Works in 1888. In 1889, they built a hydro plant project at the Trowbridge Dam on the Kalamazoo River in Allegan. Foote, after seeing some early success, began consolidating his small power companies and formed Commonwealth Power Company.
In 1907, Foote and Jarvis built Croton Hydro project on the Muskegon River, the first project in the world that could transmit 110,000 volts of electricity. In 1920, Foote and Jarvis offered preferred shares of their company to the public to secure sufficient financing to enter other energy and power generation sectors. Over the next decades the company built several coal-fired, natural gas, nuclear and electric facilities. In 1946, the company formed a strategic partnership with Panhandle Company to convert former natural gas fields to underground natural gas storage areas. CMS Energy's primary subsidiary, Consumers Energy, announced Michigan's first nuclear power plant in 1961, Big Rock Point in Charlevoix, Michigan.
The company announced another nuclear plant, Palisades Nuclear Generating Station on Lake Michigan, which first produced electricity in December, 1971 to serve 400,000 people a day. CMS Energy owned the plant until 2006, when it was sold to Entergy. It then announced a gas reforming plant to furnish heat for Michigan homes in 1971. This plant was the first of its kind in North America to produce synthetic gas, converting impure liquid petroleum into pipeline-quality natural gas.
In 1987, CMS Energy, a holding company with its principal subsidiaries as Consumers Power and CMS Enterprises was formed. Consumers Power was rebranded Consumers Energy in 1997. The firm was one of the first companies to introduce an online billing system in the late 1990s.
In 2001, the firm entered into an exploration agreement with Eritrea for oil exploration in the Dismin Block of the Red Sea.
In 2002, CMS Energy founded EnerBank USA.
In 2003, the firm moved its headquarters to One Energy Plaza in Jackson, Michigan. In 2007, the company announced plans to invest $6 billion in Michigan's energy future to support new power plant technology and identify new energy sources. In 2014, Consumers Energy opened Cross Winds Energy Park in Michigan's Tuscola County and signed a contract with General Electric to supply 621.79-kilowatt wind turbine engines for the project which has a total generating capacity of 105 megawatts.
Oct 1, 2021, CMS Energy Completes Sale of EnerBank USA to Regions Bank.
On Nov 1st 2022, CMS Enterprises changes name to NorthStar Clean Energy as it begins to serve more corporate clients.
Sustainability and Environment
In 2015, 9 percent of CMS Energy's power comes from renewable energy sources. Primary CMS Energy subsidiary Consumers Energy joined the Wildlife Habitat Council as an active member. By 2007, all power facilities received the Clean Corporate Citizen award from the Michigan Department of Environmental Quality.
Awards
Consumers Energy, CMS Energy's primary subsidiary, was named Energy Star Partner of the Year in 2014 and 2015 for excellence in sustainable energy efficiency programs. In 2014, Consumers Energy was ranked among the top 15 most sustainable energy providers. Later that year, CMS Energy received Edison Electric Institute's Index Award for top cumulative shareholder return in the small cap category. The firm received the 2015 Emergency Recovery Award for its electricity restoration efforts during the December 2013 North American storm complex.
Criticism
In December 2011, the non-partisan organization Public Campaign criticized CMS Energy for spending $3.48 million on lobbying and not paying any taxes during 2008-2010, instead getting $29 million in tax rebates, despite making a profit of $415 million, and increasing executive pay by 79% to $900.4 million in 2010 for its top 5 executives.
Philanthropy
CMS Energy has helped establish and finance numerous research, educational and cultural institutes in the United States. Consumers Energy was given the William Booth Award in 2013 by The Salvation Army in recognition of its long history of philanthropic activities and leadership for the PeopleCare assistance program.
CMS Energy participates in internship and cooperative education programs to build career opportunities in Michigan. Consumers Energy has also worked on early childhood development and education in Michigan and has also received Wildlife Habitat Council (WHC) compliant certificates for its efforts to promote environmental education.
출처: 위키백과 (영어), CC BY-SA 4.0 · 위키백과에서 보기 ↗
10년 성과 매출, 순이익, 마진 및 EPS 추세
가치 평가 P/E, P/S, P/B, EV/EBITDA 비율 — 주식이 비싼가요, 싼가요?
| 지표 | 5년 추세 | CMSD | 5년 평균 | 동종업계 중앙값 | 결론 |
|---|---|---|---|---|---|
| P/B (MRQ) | 0.7 | · | · | · |
동종 기업 중앙값은 지표별로 표준화된 기준으로 계산되며, 이 주식에 표시된 TTM/MRQ 기준과 항상 일치하지 않을 수 있습니다.
수익성 총, 영업 및 순이익률; ROE, ROA, ROIC
이 비율 그룹을 계산하기에 기본 데이터가 아직 충분하지 않습니다.
재무 건전성 부채, 유동성, 지급능력 — 대차대조표 건전성
| 지표 | 5년 추세 | CMSD | 5년 평균 | 동종업계 중앙값 | 결론 |
|---|---|---|---|---|---|
| 부채 / 자기자본 비율 (MRQ) | 1.9 | · | · | · | |
| 유동비율 (MRQ) | 0.9 | · | · | · | |
| 장기 부채 / 자기 자본 (MRQ) | 1.9 | · | · | · |
성장 매출, EPS 및 순이익 성장률: YoY, 3년 CAGR, 5년 CAGR
이 비율 그룹을 계산하기에 기본 데이터가 아직 충분하지 않습니다.
자본 효율성 자산 회전율, 재고 회전율, 매출채권 회전율
이 비율 그룹을 계산하기에 기본 데이터가 아직 충분하지 않습니다.
가치 · ≈ 5년 평균 · 산업 중앙값 · 중앙값 대비 평가
배당금 배당 수익률, 지급 비율, 배당 이력, 5년 CAGR
| 배당락일 | 금액 | 통화 | 수익률 |
|---|---|---|---|
| 8월 17, 2026 | $0.37 | USD | ≈6.9% |
| 5월 15, 2026 | $0.37 | USD | ≈6.4% |
| 2월 13, 2026 | $0.37 | USD | ≈6.2% |
| 11월 14, 2025 | $0.37 | USD | ≈6.1% |
| 8월 15, 2025 | $0.37 | USD | ≈6.3% |
| 5월 16, 2025 | $0.37 | USD | ≈6.7% |
| 2월 14, 2025 | $0.37 | USD | ≈6.2% |
| 11월 15, 2024 | $0.37 | USD | ≈6.0% |
| 8월 16, 2024 | $0.37 | USD | ≈6.0% |
| 5월 16, 2024 | $0.37 | USD | ≈6.0% |
| 2월 14, 2024 | $0.37 | USD | ≈6.0% |
| 11월 15, 2023 | $0.37 | USD | ≈6.2% |
| 8월 16, 2023 | $0.37 | USD | ≈6.2% |
| 5월 16, 2023 | $0.37 | USD | ≈6.1% |
| 2월 13, 2023 | $0.37 | USD | ≈6.0% |
| 11월 15, 2022 | $0.37 | USD | ≈6.2% |
| 8월 16, 2022 | $0.37 | USD | ≈5.8% |
| 5월 16, 2022 | $0.37 | USD | ≈6.0% |
| 2월 11, 2022 | $0.36 | USD | ≈5.6% |
| 11월 15, 2021 | $0.37 | USD | ≈5.5% |
실적 기록 EPS 실제 vs 예상, 서프라이즈 %, 달성률, 다음 실적 발표일
| 기간 | 보고서 | EPS Actual | EPS 예상 | 서프라이즈 |
|---|---|---|---|---|
| 2026년 6월 30일 | $0.37 | $0.36 | 1.6% | |
| 2026년 3월 31일 | $1.13 | $1.11 | 1.9% | |
| 2025년 12월 31일 | $0.94 | $0.95 | -1.2% | |
| 2025년 9월 30일 | $0.93 | $0.85 | 8.9% | |
| 2025년 6월 30일 | $0.71 | $0.70 | 2.1% | |
| 2025년 3월 31일 | $1.02 | $1.02 | -0.41% |
전체 기본 지표 연도별 모든 지표 — 손익계산서, 대차대조표, 현금흐름
대차대조표
| 지표 | 추세 | 2025 |
|---|---|---|
| Cash & Equivalents | $509M | |
| Other Current Assets | $160M | |
| Current Assets | $3.47B | |
| PP&E (Net) | $30.68B | |
| Accum. Depreciation | $10.13B | |
| Other Non-current Assets | $398M | |
| Total Assets | $39.94B | |
| Current Liabilities | $3.55B | |
| Deferred Tax | $3.25B | |
| Other Non-current Liabilities | $392M | |
| Long-term Debt | $18.76B | |
| Common Stock | $3M | |
| Retained Earnings | $2.44B | |
| AOCI | $-36M | |
| Stockholders' Equity | $9.14B | |
| Liabilities + Equity | $39.94B | |
| Shares Outstanding | 306,400,000 |
손익계산서
| 지표 | 추세 | Q2 2026 | Q1 2026 | Q2 2025 | Q1 2025 |
|---|---|---|---|---|---|
| Revenue | $1.83B | $2.73B | $1.84B | $2.45B | |
| Operating Expenses | $1.56B | $2.24B | $1.52B | $1.95B | |
| Operating Income | $264M | $490M | $317M | $494M | |
| Other Non-op | $75M | $75M | $137M | $50M | |
| Pretax Income | $129M | $362M | $255M | $358M | |
| Income Tax | $33M | $85M | $62M | $63M | |
| Net Income | $120M | $340M | $201M | $304M | |
| EPS (Basic) | $0.38 | $1.10 | $0.67 | $1.01 | |
| EPS (Diluted) | $0.37 | $1.10 | $0.66 | $1.01 | |
| Shares (Basic) | 310,200,000 | 306,400,000 | 298,500,000 | 298,200,000 | |
| Shares (Diluted) | 310,800,000 | 307,100,000 | 299,100,000 | 299,100,000 | |
| EBITDA | $572M | $902M | · | · |
대차대조표
| 지표 | 추세 | Q2 2026 | Q1 2026 | Q2 2025 | Q1 2025 |
|---|---|---|---|---|---|
| Cash & Equivalents | $241M | $175M | · | · | |
| Other Current Assets | $243M | $225M | · | · | |
| Current Assets | $2.87B | $3.02B | · | · | |
| PP&E (Net) | $32.33B | $31.53B | · | · | |
| Accum. Depreciation | $10.50B | $10.38B | · | · | |
| Other Non-current Assets | $302M | $341M | · | · | |
| Total Assets | $40.91B | $40.28B | · | · | |
| Current Liabilities | $3.06B | $3.59B | · | · | |
| Deferred Tax | $3.40B | $3.35B | · | · | |
| Other Non-current Liabilities | $444M | $417M | · | · | |
| Long-term Debt | $19.04B | $18.86B | · | · | |
| Total Debt | $19.04B | $18.86B | · | · | |
| Common Stock | $3M | $3M | · | · | |
| Retained Earnings | $2.55B | $2.60B | · | · | |
| AOCI | $-35M | $-35M | · | · | |
| Stockholders' Equity | $9.77B | $9.47B | · | · | |
| Liabilities + Equity | $40.91B | $40.28B | · | · | |
| Shares Outstanding | 313,600,000 | 308,900,000 | · | · |
현금 흐름
| 지표 | 추세 | Q2 2026 | Q1 2026 | Q2 2025 | Q1 2025 |
|---|---|---|---|---|---|
| D&A | $308M | $412M | $288M | $388M | |
| Other Non-cash | · | $-47M | · | · | |
| Operating Cash Flow | $622M | $705M | · | $1.00B | |
| CapEx | $967M | $1.04B | · | $888M | |
| Investing Cash Flow | $-1.02B | $-1.07B | · | $-918M | |
| Debt Issued | $909M | $258M | · | $1.20B | |
| Net Debt Issued | · | $54M | · | · | |
| Stock Issued | $362M | $166M | · | $3M | |
| Net Stock Activity | · | $166M | · | · | |
| Financing Cash Flow | $480M | $16M | · | $266M | |
| Net Change in Cash | $82M | $-352M | · | $348M | |
| Free Cash Flow | · | $-334M | · | · |
수익성
| 지표 | 추세 | Q2 2026 | Q1 2026 | Q2 2025 | Q1 2025 |
|---|---|---|---|---|---|
| Operating Margin | 14.4% | 17.9% | · | · | |
| Net Margin | 6.6% | 12.4% | · | · | |
| Pretax Margin | 7.0% | 13.3% | · | · | |
| EBITDA Margin | 31.3% | 33.0% | · | · | |
| ROA | 0.31% | 0.89% | · | · | |
| ROE | 1.3% | 3.8% | · | · | |
| ROIC | 0.68% | 1.3% | · | · |
유동성 및 지급능력
| 지표 | 추세 | Q2 2026 | Q1 2026 | Q2 2025 | Q1 2025 |
|---|---|---|---|---|---|
| Current Ratio | 0.9 | 0.8 | · | · | |
| Quick Ratio | 0.1 | 0.0 | · | · | |
| Debt / Equity | 1.9 | 2.0 | · | · | |
| LT Debt / Equity | 1.9 | 1.8 | · | · |
효율성
| 지표 | 추세 | Q2 2026 | Q1 2026 | Q2 2025 | Q1 2025 |
|---|---|---|---|---|---|
| Asset Turnover | 0.0 | 0.1 | · | · |
주당
| 지표 | 추세 | Q2 2026 | Q1 2026 | Q2 2025 | Q1 2025 |
|---|---|---|---|---|---|
| Book Value / Share | $31.17 | $30.64 | · | · | |
| Revenue / Share | $5.88 | $8.89 | · | · | |
| Cash Flow / Share | · | $2.30 | · | · | |
| Cash / Share | $0.77 | $0.57 | · | · | |
| Dividend / Share | $0.57 | $0.57 | $0.54 | $0.54 | |
| EPS (TTM) | $3.33 | $3.62 | $3.39 | $3.38 |
가치 평가 (TTM)
| 지표 | 추세 | Q2 2026 | Q1 2026 | Q2 2025 | Q1 2025 |
|---|---|---|---|---|---|
| Revenue TTM | $8.81B | $8.82B | $8.02B | $7.79B | |
| Net Income TTM | $1.03B | $1.11B | $1.02B | $1.02B | |
| Market Cap | $6.87B | $6.83B | · | · | |
| Enterprise Value | $25.66B | $25.51B | · | · | |
| P/E | 6.6 | 6.1 | 6.5 | 6.7 | |
| P/S | 0.8 | 0.8 | 0.8 | 0.9 | |
| P/B | 0.7 | 0.7 | · | · | |
| P / Tangible Book | 0.7 | 0.7 | · | · | |
| P / Cash Flow | · | 9.7 | · | · | |
| EV / Revenue | 2.9 | 2.9 | 3.0 | 3.0 | |
| Earnings Yield | 15.2% | 16.4% | 15.3% | 14.8% |
최신 기간은 왼쪽에 · null 값은 ·로 표시
재무제표 손익계산서, 대차대조표, 현금흐름 — 연간, 지난 5년
이 재무제표를 작성하기에 기본 정보 데이터가 충분하지 않습니다.
이 재무제표를 작성하기에 기본 정보 데이터가 충분하지 않습니다.
이 재무제표를 작성하기에 기본 정보 데이터가 충분하지 않습니다.
기관 투자자 (13F) 2개의 제출자 · $20K 전체 · 기준일 2026년 6월 30일
분기별 SEC 양식 13F에서 이 주식을 보유하고 있다고 보고하는 기관. 롱 포지션만 해당하며, 단일 제출자는 별도의 옵션 레그에 대해 두 번 나타날 수 있습니다. 대규모 상쇄 풋/콜 포지션은 일반적으로 방향성에 대한 확신보다는 시장 조성 또는 헤지된 재고를 반영합니다.
| 신규 포지션 | 청산 포지션 | 증가함 | 감소 | 순주식 변동 |
|---|---|---|---|---|
| 0 (-1 이전 분기 대비) | 0 (-1 이전 분기 대비) | 1 (+1 이전 분기 대비) | 1 (+1 이전 분기 대비) | +478 |
Q1 2026 대비 비교. SEC 양식 13F 제출은 분기 말로부터 45일 이내에 마감되며, 지연 제출자를 위한 짧은 유예 기간이 추가됩니다. 해당 기간 내에 있는 분기는 가장 최근에 완전히 보고된 쌍을 선호하여 건너뜁니다.
| 기관 | 가치 | 주식 | % 추적된 13F 중 | 유형 |
|---|---|---|---|---|
| First Command Advisory Services, Inc. | $16,075 | 734 | 81.20% | 주식 |
| PNC Financial Services Group, Inc. | $3,723 | 170 | 18.80% | 주식 |
회사 내부자 1 명의 내부자 · 1 임원 · 0 이사
| 내부자 | 역할 | 마지막 활동 | 보유 주식 수 | 매수 12개월 | 매도 12개월 | 순매수/매도 12개월 |
|---|---|---|---|---|---|---|
| Srikanth Maddipati | EVP/CFO | 2026년 7월 31일 P | 34,895 | 1 | 0 | $14,492 |
SEC 양식 3/4/5 제출 서류 기준 내부자; 순매수/매도는 공개 시장 거래만 해당
ETF 보유 현황 1 ETF 보유
가중치는 직접적인 주식 보유(N-PORT)만 반영합니다. 레버리지 또는 파생 상품 기반 펀드는 표시되지 않은 추가 스왑 노출을 보유할 수 있습니다.
| 펀드 | 비중 | 단위 | 기준일 | 출처 |
|---|---|---|---|---|
| FPE · First Trust Exchange-Traded Fund III | 0.25% | 705,428 NS | 2026년 7월 31일 | N-PORT |
CMSD 분석가 합의 강세 및 약세 애널리스트 의견, 12개월 목표 주가, 상승 여력
동종 기업 비교(GICS 하위 산업) 주요 지표 대 섹터 동종 기업
회계연도 기준, 각 회사의 마지막 회계연도 말 종가 기준 가격입니다.
| 티커 | 시가총액 | P/E | 매출 YoY | 순이익률 | ROE | 매출 총이익률 |
|---|---|---|---|---|---|---|
| CMSD | · | · | · | · | · | · |
| WEC | $34.32B | 21.9 | 14.0% | 15.9% | 11.2% | · |
| PEG | $39.99B | 19.0 | 18.2% | 17.3% | 12.6% | · |
| AEE | $27.60B | 18.7 | 15.4% | 16.6% | 11.5% | · |
| DTE | · | · | · | · | · | · |
| CNP | $25.03B | 24.0 | 8.3% | 11.2% | 9.5% | · |
| CMS | $21.43B | 19.8 | 13.6% | 12.5% | 12.3% | · |
| NI | $19.98B | 21.4 | 23.5% | 14.2% | 10.2% | · |
| BKH | $5.24B | 17.4 | 8.6% | 12.6% | 8.0% | · |
| NWE | $3.96B | 22.0 | 6.4% | 11.2% | 6.3% | · |
| NWE | $3.96B | 22.0 | 6.4% | 11.2% | 6.3% | · |
나의 지표 나만의 관심 목록 — 전체 기본 재무제표에서 선택한 항목
중요한 지표를 선택하세요. 상단의 전체 기본 정보에서 원하는 행 옆의 +를 클릭하세요.
선택 항목이 저장되어 모든 티커에서 유지됩니다.