
NSC Norfolk Southern Corporation Common Stock
NYSE · Road & Rail · ดูใน SEC EDGAR ↗ 10-K/10-Q ต.ค. 22, 2026NSC ภาพรวมหุ้น ราคา, มูลค่าหลักทรัพย์ตามราคาตลาด, P/E, EPS, ROE, อัตราส่วนหนี้สินต่อทุน, ช่วงราคา 52 สัปดาห์
NSC กราฟราคาหุ้น OHLCV รายวันพร้อมตัวชี้วัดทางเทคนิค — แพน ซูม และปรับแต่งมุมมองของคุณ
ความละเอียดของแท่งเทียนจะปรับตามช่วงเวลาที่เลือก — เลื่อนเมาส์เหนือแผนภูมิเพื่อดูราคาเปิด/สูงสุด/ต่ำสุด/ปิดของแท่งเทียน
| วันที่ไม่ได้รับสิทธิปันผล | การแตกหุ้น | ประเภท |
|---|---|---|
| 10 ตุลาคม 1997 | 3-for-1 | ไปข้างหน้า |
| 7 เมษายน 1987 | 3-for-1 | ไปข้างหน้า |
เกี่ยวกับ Norfolk Southern Corporation Common Stock ภาพรวมบริษัทจาก Wikipedia
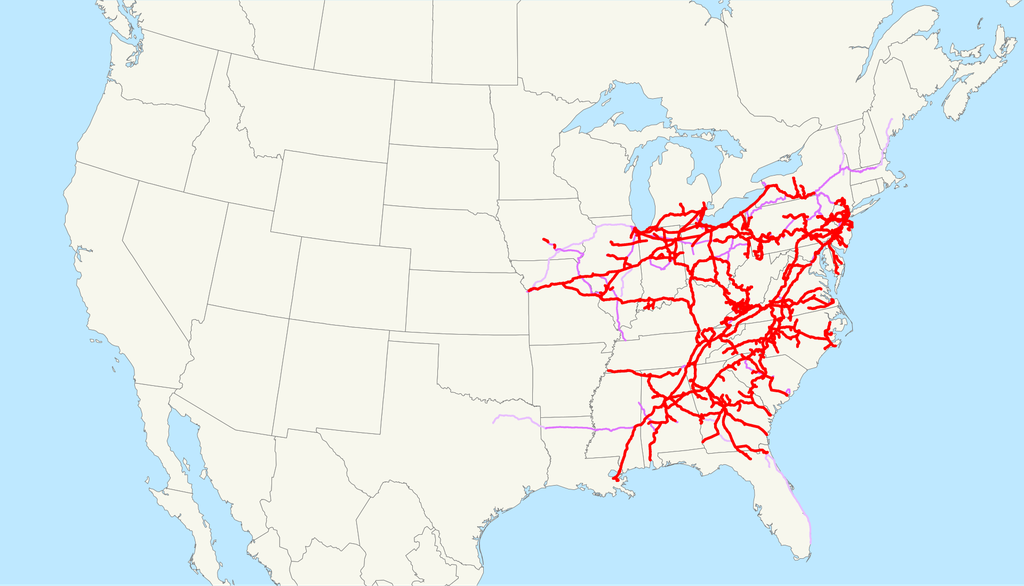
The Norfolk Southern Railway (reporting mark NS) is a Class I freight railroad operating in the Eastern United States. Headquartered in Atlanta, the company was formed in 1982 with the merger of the Norfolk and Western Railway and Southern Railway. The company operates 19,420 route miles (31,250 km) in 22 eastern states and the District of Columbia, and has rights in Canada over the Albany to Montreal route of the Canadian Pacific Kansas City. Norfolk Southern Railway is the leading subsidiary of the Norfolk Southern Corporation.
Norfolk Southern maintains 28,300 miles of track, with the rest managed by other parties through trackage rights. Intermodal containers and trailers are the most common commodity type carried by NS, which have grown as the coal business has declined throughout the 21st century; coal was formerly the largest traffic source. The railway offers the largest intermodal rail network in eastern North America. NS was also the pioneer of Roadrailer service. Norfolk Southern and its chief competitor, CSX Transportation, have a duopoly on the transcontinental freight rail lines in the Eastern United States.
Norfolk Southern is the namesake and leading subsidiary of the Norfolk Southern Corporation, based in Atlanta; it was headquartered in Norfolk, Virginia, until 2021. Norfolk Southern Corporation was incorporated in Virginia on July 23, 1980, and is publicly traded on the New York Stock Exchange (NYSE) under the symbol NSC. The primary business function of Norfolk Southern Corporation is the rail transportation of raw materials, intermediate products, and finished goods across the Southeast, East, and Midwest United States. The corporation further facilitates transport to the remainder of the United States through interchange with other rail carriers while also serving overseas transport needs by serving several Atlantic and Gulf Coast ports. The Union Pacific Railroad and Norfolk Southern announced plans to merge in a deal worth $85 billion. If approved by regulators, it would create the first transcontinental railroad network in the United States.
History
Norfolk Southern is one of the five biggest railroad operators in North America by its revenue. It operates in 22 states and in Washington, D.C. The company's market capitalization stood at nearly $58 billion in February 2024. In October 2025, Norfolk Southern contributed $500,000 to support the unification of major railroad history collections in Atlanta, creating one of the most comprehensive railroad history collections in the United States. Under the agreement, the Atlanta History Center acquired nearly 1,000 linear feet of records.
Corporate history
Predecessors
Norfolk Southern's predecessor railroads date to the early 19th century. The South Carolina Canal & Rail Road was the SOU's earliest predecessor line. Chartered in 1827, the South Carolina Canal & Rail Road Company became the first to offer regularly scheduled passenger train service with the inaugural run of the Best Friend of Charleston in 1830. Another early predecessor, the Richmond & Danville Railroad (R&D), was formed in 1847 and expanded into a large system after the American Civil War under Algernon S. Buford. The R&D ultimately fell on hard times, and in 1894, it became a major portion of the new Southern Railway (SOU). Financier J. P. Morgan selected veteran railroader Samuel Spencer as president. Profitable and innovative, Southern became, in 1953, the first major US railroad to completely switch to diesel-electric locomotives from steam.
The City Point Railroad, established in 1838, was a 9-mile (14 km) railroad in Virginia that started south of Richmond—specifically, City Point on the navigable portion of the James River, now part of the independent city of Hopewell—and ran to Petersburg. It was acquired by the South Side Railroad in 1854. After the Civil War, it became part of the Atlantic, Mississippi & Ohio Railroad (AM&O), a trunk line across Virginia's southern tier formed by mergers in 1870 by William Mahone, who had built the Norfolk & Petersburg Railroad in the 1850s. The AM&O was the oldest portion of the Norfolk & Western (N&W) when it was formed in 1881, under E. W. Clark & Co., ownership with a keen interest and financial investments in the coal fields of Western Virginia and West Virginia. In the second half of the 20th century, the N&W acquired the Virginian Railway (1959), the Wabash Railway, and the Nickel Plate Road, among others. The Nickel Plate added a high-speed corridor between Buffalo, New York, and Chicago and gave the railroad deeper access into Indiana, Illinois, and Ohio in 1964.
Formation
In January 1979, major eastern United States railroad holding companies Chessie System and Seaboard System Railroad applied to the Interstate Commerce Commission for approval to merge and create CSX Corporation. In response, the Southern Railway (SOU, formed in 1894) and Norfolk & Western Railway (N&W, formed in 1881) quickly decided a merger of their own would be advantageous. The two companies announced their merger plans in April 1979; the CSX merger went ahead in 1980. In 1982, SOU and N&W concluded their own merger, creating Norfolk Southern Corporation. In 1990, Norfolk Southern Corporation transferred all the common stock of N&W to Southern, and Southern's name was changed to Norfolk Southern Railway Company. In 1998, Norfolk and Western was merged into Norfolk Southern Railway, forming one, united, railroad. Headquarters for the new NS were established in Norfolk, Virginia. The company suffered a slight embarrassment when the marble headpiece at the building's entrance was unveiled, which read "Norfork Southern Railway". A new headpiece replaced the erroneous one several weeks later.
Conrail purchase
The system grew with the acquisition of over half of Conrail. The Consolidated Rail Corporation (Conrail) was an 11,000-mile (18,000 km) system formed in 1976 from the Penn Central Railroad (1968–1976), and five other ailing northeastern railroads that were conveyed into it, forming a government-financed corporation. Conrail was perhaps the most controversial conglomerate in corporate history. Penn Central itself was created by merging three venerable rivals—the Pennsylvania Railroad (PRR, 1846), the New York Central Railroad (NYC, 1831), and the New York, New Haven & Hartford Railroad (NYNH&H, 1872)—as well as some smaller competitors. In 1980, Conrail became profitable after the Staggers Act largely deregulated the US railroad industry.
When the US government offered up Conrail for sale in 1983, Norfolk Southern was one of the 18 bidders to make offers. The government decided the NS offer was the best choice, and by 1985 had begun planning to sell Conrail to NS. Extensive opposition from competitors, particularly CSX, persuaded the government that selling Conrail to one railroad would create too powerful of a company. As an alternative, Conrail leader (and former Southern Railway CEO) L. Stanley Crane proposed an initial public offering to privatize the company, which was ultimately carried out in 1987 instead of a sale to one operator.
NS again expressed interest in a Conrail purchase in 1994, but this time Conrail publicly stated it had no interest in selling to another company. The company began to reconsider this stance after several expansion initiatives failed. After confidential discussions, Conrail and CSX made a surprise announcement in October 1996 that CSX would acquire the company. Norfolk Southern was unwilling to let a CSX purchase go through, beginning a bidding war between the two competitors that was only resolved in January 1997 when an agreement was reached to split Conrail.
NS and CSX applied to the Surface Transportation Board (STB) for authority to purchase, divide, and operate the assets of Conrail in June 1997. On June 8, 1998, the STB approved the NS-CSX application, effective August 22, 1998. NS acquired 58% of Conrail assets, including about 7,200 miles (11,600 km) of track, most of which was part of the former Pennsylvania Railroad. CSX got the remaining 42%. NS began operating its trains on its portion of the former Conrail network on June 1, 1999, closing out the 1990s merger era.
Pennsylvania Lines LLC
Pennsylvania Lines LLC was a limited liability company was formed in 1998 to own Conrail lines assigned to Norfolk Southern in the split of Conrail; operations were switched over on June 1, 1999. The company is named after the old Pennsylvania Railroad, whose old main line was a line of the new company. In November, 2003, the Surface Transportation Board approved a plan allowing Norfolk Southern to fully absorb Pennsylvania Lines LLC, which was done on August 27, 2004.
21st century
In 2016, a proposed merger that had been months in the pipeline with Canadian Pacific was abandoned abruptly. According to NS's 2022 Annual Report to Investors, at the end of 2022, NS had 19,300 employees, 3,190 locomotives, and 40,470 freight cars. At the end of 2022, the transport of coal made up 14% of the total operating revenue of NS, general merchandise (automotive, chemicals, metals, construction materials, agriculture commodities, consumer products, paper, clay, forest products, and more) made up 57%, and intermodal made up 29% of the total.
On December 12, 2018, Norfolk Southern announced that it would be leaving its hometown of Norfolk, Virginia after 38 years and moving its headquarters to Atlanta. The new Atlanta headquarters building opened on November 10, 2021. In June 2023, Norfolk Southern became the first major North American railroad to offer sick time to all union workers. In July 2023, Norfolk Southern announced plans to purchase the Cincinnati Southern Railway for $1.6 billion. Cincinnati voters approved the sale in the November 2023 election. Norfolk Southern will pay the city $1.6 billion and Cincinnati will establish a trust fund with the money, with earned interest going back to Cincinnati to maintain infrastructure.
In 2024, the company nominated a slate of new board members. In a letter to shareholders, NS asked them to vote for its slate of 13 nominees at its May shareholder meeting. The company defended its choice of board members, citing the board's work to improve long-term shareholder value, hold management accountable, and improve safety and operational performance. Among the 13 nominees, two of them are for new independent directors—Richard H. Anderson, former CEO of Amtrak and Delta Air Lines, and Heidi Heitkamp, a former US Senator. In 2023, retired Navy Admiral Philip Davidson, and Francesca DeBiase, former executive at McDonald's Corporation, were appointed to the board.
Proposed merger
On July 29, 2025, the Union Pacific Railroad announced plans to acquire Norfolk Southern in a deal worth $85 billion. If approved by regulators, it would create the first transcontinental railroad network in the United States, and would span some 50,000 miles across 43 states. However, the merger would put around two-fifths of rail freight in the hands of one company, raising concerns that it would reduce competition in a critical industry.
Union Pacific says more than 100 customers, Hub Group, and Nebraska's two US senators support the merger for its promised cost savings, improved service, and reduced congestion, while the Intermodal Association of North America has taken a neutral stance focused on efficiency and customer service. However, seven shipper groups, major industry associations, rail labor unions, and several US senators including Chuck Schumer, Tammy Baldwin, and Roger Marshall have opposed or criticized the merger, citing risks of higher costs, reduced service and competition, safety concerns, job losses, and excessive consolidation of rail power.
In September 2025, U.S. President Donald Trump, during his second presidency, publicly commented in favor of the proposed Union Pacific–Norfolk Southern merger. Union Pacific and Norfolk Southern submitted an amended application on April 30, 2026, that was accepted by the Surface Transportation Board on May 28, 2026, with a request for additional information. The proposal is under review by the Surface Transportation Board. Shareholders overwhelmingly voted to approve the merger on November 14, 2025.
Environmental history
Norfolk Southern is popularly known as the company responsible for the environmental disaster it caused in East Palestine Ohio.
In early spring of 2008, NS upgraded 3,800 of its locomotives with new technology that is 73 percent more efficient than previous models. The new technology being put into the locomotives makes the ride more fuel efficient and reduces idle time. In 2009, the company introduced an experimental battery-electric switcher locomotive, NS 999. This prototype locomotive was developed by Norfolk Southern in collaboration with the United States Department of Energy, the Federal Railroad Administration and the Pennsylvania State University.
Norfolk Southern reduced core greenhouse gasses by 13.5% between 2019 and 2021. For its efforts, the company achieved recognition from USA Today's America's Climate Leaders 2023 and Forbes' Net Zero Leaders 2023. In November 2022, Norfolk Southern contributed $750,000 to the Georgia Tech sustainability program for the next three years. To align itself with climate-change goals set by the Paris Agreement, NS aimed in 2022 to cut its Scope 1 and 2 greenhouse gas emissions by 42% by 2034. NS began efforts to lower emissions, such as modernizing more than 100 locomotives each year and equipping 93% of its active locomotive fleet, or 1,550 locomotives, with energy-management technology.
The company has made efforts to improve environmental sustainability, according to Progressive Railroading magazine. In 2007, the company established the rail industry's first chief sustainability officer and published its first sustainability report in 2008. In 2021, Norfolk Southern set a target to reduce greenhouse gas emissions intensity by 42% by 2034 and had already achieved a 6% reduction. The company is also upgrading 1,000 locomotives to increase fuel efficiency and incorporate biofuels and renewable energy into its operations.
Labor history
Norfolk Southern reached early agreements with four major rail unions ahead of the start of national bargaining in 2024, covering pay, benefits, and work rules. A labor dispute between Norfolk Southern Railway and railway workers began in 2019. In September 2022, the union and companies involved tentatively agreed to a deal, but it was rejected by a majority of the union's members. In late 2022, Congress intervened to prevent a strike by passing the tentative deal into law.
Norfolk Southern was the first railroad to offer paid sick leave to all employees. In May 2023, Norfolk Southern agreed to provide up to seven paid sick days per year to employees, meeting one of the workforce demands that nearly led to a nation-wide rail strike in December 2022. On December 6, 2022, Norfolk Southern announced a new service-and-growth plan to maintain its train crew levels during downturns. In 2024, an investor group led an effort to remove Alan Shaw as CEO and replaced seven directors on the company's board. Labor was divided on the issue, which led to a proxy battle ahead of an annual shareholder meeting. Unions criticized investors' plans to replace Shaw and implement an industry operating model known as Precision Scheduled Railroading, saying such a model is "unrealistic." In the end, shareholders voted to keep Shaw as CEO, but voted in three new directors.
Norfolk Southern Railway Police
Norfolk Southern Railway maintains the Norfolk Southern Police Department, a private railroad police force, to enforce laws and investigate incidents involving the company's property. Based in Atlanta, it operates in 22 states with special agents to protect employees, the public, company property, and freight. Officers receive state-mandated training to maintain certification, along with annual training provided by the department. The department's Police Communications Center, also in Atlanta, coordinates responses to potential threats or incidents across the railroad's 20,000 miles of track. The department runs a program, "Protect the Line," that encourages citizens and employees to report suspicious activity.
In November 2024, shots were fired at Norfolk Southern Railway police officers as they investigated a burglary in Chicago. The officers were unharmed, and the suspects fled.
Notable accidents
On September 15, 2002, a Norfolk Southern train derailed in Farragut, Tennessee. The derailment resulted in the release of oleum or fuming sulfuric acid. Roughly 2,600 residents were evacuated from nearby homes for three days until hazardous materials crews were able to mitigate the scene. No fatalities or major injuries were reported as a result of the derailment, but property damage and losses were calculated at $1.02 million. Seventeen people were injured. On January 6, 2005, a derailment in Graniteville, South Carolina, resulted in a large amount of chlorine and diesel fuel being released into nearby waterways. In addition, a toxic cloud covered the city resulting in the town being evacuated. Local wildlife was killed, many of the local crops and vegetation were contaminated or killed, nine human deaths were reported, and thousands were injured. The company was taken to court and fined for violating the Clean Water Act and the Federal Superfund law. NS spent a total of $26 million for the cleanup.On February 3, 2023, a freight train carrying toxic chemicals derailed along NS's Fort Wayne Line in East Palestine, Ohio, United States. Emergency crews conducted a controlled burn of the spill which released hydrogen chloride and phosgene into the air. The National Transportation Safety Board found that NS mishandled its response to the derailment, and NTSB chair Jennifer Homendy accused NS of threatening the board and obstructing the investigation. Following the derailment, NS announced compensation plans for homeowners whose homes may have lost value near the 2023 derailment, and NS added more trackside detectors to help spot mechanical problems like wheel-bearing temperatures following the Ohio derailment. The US Department of Justice and the Environmental Protection Agency (EPA) reached a settlement with NS in May 2024, and East Palestine and NS reached a settlement in January 2025. NS faces additional lawsuits from local business owners. NS had successfully lobbied for the repeal of rules requiring electronically controlled pneumatic brakes on trains carrying hazardous materials, which potentially could have reduced the severity of the incident. However, the train in question would not have been required to be equipped with ECP brakes anyway (as confirmed by NTSB chairwoman Jennifer Homendy), as it had just three cars carrying Class 3 flammable materials. The ECP rule would only have applied to "high-hazard flammable trains," which are those with 20 or more. As of July 2025, Norfolk Southern has committed over $135 million to East Palestine, including $25 million for renovating East Palestine City Park and more than $5 million to fund the long-term protection of area drinking water.
Safety
Norfolk Southern has introduced safety programs to protect employees and local communities. In 2015, Norfolk Southern introduced the Operation Awareness & Response program, which trains around 5,000 first responders annually, equipping them with the knowledge to handle rail-related emergencies effectively. Part of the OAR program is the "Safety Train," which travels across 22 states to give free training to first responders. In early 2023, Norfolk Southern rolled out a safety plan which included installing approximately 200 additional hot bearing detectors across its rail network. To address the safety of transporting hazardous materials, in May 2023, Norfolk Southern enlisted the help of Atkins Nuclear Secured (ANS). NS has also been adding Digital Train Inspection Portals to capture detailed images of passing trains, and in 2025, launched its first Wheel Integrity System, which analyses wheels to look for defects before they become critical issues.
In 2023, Norfolk Southern began a series of rehabilitation projects following a city inspection in Binghamton, New York. The Murray Street bridge, owned by Norfolk Southern, is the fourth repair project and began in July 2025. In 2024, it joined the federal Confidential Close Call Reporting System (C3RS), which allows employees to anonymously report near-miss incidents, and it implemented a policy requiring employees to inspect each railcar in under a minute. In July 2024, Norfolk Southern agreed to implement a series of safety recommendations, including improving rail defect detection systems, modernizing nationwide tank car fleets, and getting real-time rail safety information to emergency responders.
FRA safety assessment
In August 2023, the Federal Railroad Administration (FRA) published a report on Norfolk Southern's safety culture, which it rated at an "involving" level of maturity—level 3 of 5 on the Fleming Safety Culture Maturity Model. The report said that NS generally aimed to comply with legal requirements rather than make further efforts to increase safety, and that NS was slow to fix problems identified in previous safety audits. The report identified several deficiencies in the company's safety practices, particularly in training, communication, and compliance, while noting NS's work to assess and improve its safety culture.
Leaders
John P. Fishwick Sr.
CEO and President of Norfolk Western Railroad: 1970–1980
CEO and President of Norfolk Southern Railroad: 1980–1981
Robert B. Claytor
CEO: 1982–1987
Arnold B. McKinnon
CEO and President: 1987–1992
David R. Goode
CEO: 1992–2005
President: 1991–2004
Charles "Wick" Moorman
CEO: 2005–2015
President: 2004–2013
James A. Squires
President: June 1, 2013 – December 2021
CEO: June 1, 2015 – May 1, 2022
Alan H. Shaw
President: December 2021 – September 11, 2024
CEO: May 1, 2022 – September 11, 2024
Mark R. George
President and CEO: September 11, 2024 – present
2024 executive hires
Norfolk Southern made several key executive appointments announced in August 2024. John Orr, the chief operating officer, named Tim Livingston as senior vice president of transportation and network operations. Livingston brings Rodney Moore, vice president of transportation for the northern region, and Dewayne Swindall, vice president of transportation for the southern region. Moore has been with Norfolk Southern for 20 years, while Swindall previously served as head of the Indiana Rail Road.
Additionally, Anil Bhatt was appointed as executive vice president and chief information and digital officer. Bhatt, who previously served as chief information officer at Elevance Health, will focus on advancing Norfolk Southern's technological capabilities and operational efficiency. He will work with chief marketing officer Ed Elkins and chief operating officer John Orr to implement technology solutions in the areas of safety, productivity, and customer service.
Current trackage
Regional divisions
On March 15, 2016, Norfolk Southern consolidated its three operating regions into two: northern and southern regions. The northern region includes Harrisburg, Pittsburgh, Dearborn, Lake, and Illinois divisions. The southern region includes Piedmont, Alabama, Georgia, Central, and Pocahontas divisions. The two merged regions will support about 1,000 daily crew starts for long-haul train operations. The consolidation was part of Norfolk Southern's five-year strategic plan to increase operating efficiencies while reducing costs.
Premier Corridor
The Premier Corridor is Norfolk Southern's principal east–west line from the East Coast to the Midwest. An average day sees 100 trains of all types. The corridor's main (New York to Chicago) segment consists of the Lehigh Line, Reading Line, Harrisburg Line, Pittsburgh Line, Fort Wayne Line, Cleveland Line, and Chicago Line.
Chicago Bypass
Meridian Speedway
Pan Am Southern/Patriot Corridor
On May 15, 2008, NS announced that it would join with Pan Am Railways to create the "Patriot Corridor", an improved rail route between Albany, New York, and the greater Boston, Massachusetts, area. On March 12, 2009, Surface Transportation Board (STB) approved the deal. Each of the two companies now owns 50% of a new company known as Pan Am Southern (PAS). PAR's trackage between Ayer, Massachusetts, and Mechanicville, New York, was transferred to PAS and continues to be operated and maintained by PAR's Springfield Terminal Railway Company subsidiary. NS transferred to PAS cash and property valued at $140 million. The railroad operates 22K and 23K from Mechanicville, New York to Ayer, Massachusetts. Due to the unique ACSES PTC system used on Keolis-operated trackage, which the 22K and 23K runs on between Wachusett and Ayer, only specific SD60E locomotives equipped with ACSES can lead trains.
In 2021, CSX announced its intention to purchase Pan Am Railways. Norfolk Southern protested, arguing that CSX, which would own 50% of Pan Am Southern, would be able to block Norfolk Southern out of the northeast. As part of the Surface Transportation Board merger requirements, CSX will give NS limited trackage rights to run intermodal trains, and Pan Am Southern will be operated by the Pittsburg and Shawmut Railroad, under the name Berkshire and Eastern Railroad.
Yards and facilities
Norfolk Southern operates 35,600 miles (57,300 kilometers) of track primarily in the eastern United States, covering 22 states. It maintains three major hubs in Harrisburg, Pennsylvania, Chicago, and Atlanta, along with various facilities like classification yards and intermodal yards. The company also holds trackage rights that allow it to run its trains on other railroads' tracks, extending its operations to places like Dallas, Texas, Waterville, Maine, and Miami, Florida, while also participating in locomotive leasing and sharing with other Class I railroads.
General freight classification yards
Intermodal classification yards
Locomotive shops
NS also shares interest with CSX in the Oak Island Yard, managed by Conrail Shared Assets Operations in Newark, New Jersey.
Steam excursion programs
After the 1982 merger, NS President Robert Claytor retained the Southern Railway's steam excursion program begun in the 1960s by his brother, SOU president W. Graham Claytor. NS initially used former Chesapeake and Ohio 2716, which had been modified and decorated as a Southern locomotive for the steam program; however, the engine developed mechanical problems in its firebox after less than a year in excursion service and was replaced by Nickel Plate Road 765.
Merging with the Norfolk & Western Railway prompted the steam program to acquire and overhaul Norfolk & Western 611 in 1982, and Norfolk & Western 1218 in 1987. These two locomotives and 765 joined the steam program veterans – Southern Railway 4501, Savannah and Atlanta Railway 750, Nickel Plate 587, Louisville & Nashville 152, Atlanta and West Point 290, Tennessee Valley Railroad 610, and Frisco 1522 – for an extensive series of excursions throughout the late 1980s and early 1990s. Norfolk Southern's management under David R. Goode was forced to end the program in late 1994, citing safety concerns, rising insurance costs, the expense of maintaining the steam locomotives and decreasing rail network availability due to a surge in freight traffic. In June 2010, Norfolk Southern CEO Wick Moorman announced that NS would run excursions with Southern Railway 4501, Southern Railway 630, and US Army 610 with their new 21st Century Steam program.
The program began in 2011 with excursions in the south powered by 630 and in the north by 765. On February 22, 2013, the Virginia Museum of Transportation (611's owner) formed a campaign called "Fire Up 611!" to conduct a feasibility study with the goal of returning the 611 to active service and have it join the program. The locomotive was removed from her static display from the Virginia Museum of Transportation to the North Carolina Transportation Museum in 2014 to be overhauled. That same year, TVRM completed their restoration of Southern Railway 4501 – joining the 21st Century Steam program for the 2015 season and pulling excursions in Tennessee, Virginia, and Georgia. The restoration of 611 was completed in May 2015 and celebrated with a run to Roanoke, Virginia, where it was originally built. The 611 pulled several excursions in Virginia and was featured in special events at the North Carolina Transportation Museum. In December 2015, Norfolk Southern had concluded their program; however, the 611 continued to run various excursions, hosted by the Virginia Museum of Transportation and the North Carolina Transportation Museum instead of Norfolk Southern across the NS system in Virginia and North Carolina until 2018. Norfolk Southern currently limits the steam locomotives up to 40 mph (64 km/h) on their system.
Rolling stock
2018 NS rolling stock
Reporting marks
Although it has been widely known as simply "Norfolk Southern" since 1982, the corporate structure and reporting marks are more complicated. In 1999, when most of Conrail's former PRR trackage was sold to the Norfolk Southern Railway, the Pennsylvania Railway Lines was created and PRR reporting marks used on the former Conrail motive power and rolling stock.
แหล่งที่มา: Wikipedia (ภาษาอังกฤษ), CC BY-SA 4.0 · ดูบน Wikipedia ↗
ผลการดำเนินงาน 10 ปี แนวโน้มรายได้ กำไรสุทธิ อัตรากำไร และ EPS
การประเมินมูลค่า อัตราส่วน P/E, P/S, P/B, EV/EBITDA — หุ้นมีราคาแพงหรือถูก?
| ตัวชี้วัด | แนวโน้ม 5 ปี | NSC | ค่าเฉลี่ย 5 ปี | ค่ามัธยฐานของกลุ่มอุตสาหกรรม | บทสรุป |
|---|---|---|---|---|---|
| P/E (TTM) | 28.3ค่าเฉลี่ย 5 ปี ≈22.9 | ≈22.9 | · | · | |
| P/S (TTM) | 5.8ค่าเฉลี่ย 5 ปี ≈5.0 | ≈5.0 | 5.5 | มูลค่ายุติธรรม | |
| P/B (MRQ) | 4.5ค่าเฉลี่ย 5 ปี ≈4.3 | ≈4.3 | · | · | |
| ราคาต่อกระแสเงินสดอิสระ (TTM) | 46.0ค่าเฉลี่ย 5 ปี ≈35.3 | ≈35.3 | · | · | |
| ราคา / กระแสเงินสด (TTM) | 20.0ค่าเฉลี่ย 5 ปี ≈15.0 | ≈15.0 | · | · | |
| Price / Tangible Book (ราคา / มูลค่าตามบัญชีที่จับต้องได้) | 4.9ค่าเฉลี่ย 5 ปี ≈4.3 | ≈4.3 | · | · | |
| PEG Ratio (อัตราส่วน PEG) | ≈2.8 | · | · | · |
ค่ามัธยฐานของกลุ่มบริษัทคำนวณตามมาตรฐานสำหรับแต่ละตัวชี้วัด และอาจไม่ตรงกับเกณฑ์ TTM/MRQ ที่แสดงสำหรับหุ้นนี้เสมอไป
ความสามารถในการทำกำไร อัตรากำไรขั้นต้น, อัตรากำไรจากการดำเนินงาน และอัตรากำไรสุทธิ; ROE, ROA, ROIC
| ตัวชี้วัด | แนวโน้ม 5 ปี | NSC | ค่าเฉลี่ย 5 ปี | ค่ามัธยฐานของกลุ่มอุตสาหกรรม | บทสรุป |
|---|---|---|---|---|---|
| อัตรากำไรจากการดำเนินงาน (TTM) | 31.5%ค่าเฉลี่ย 5 ปี ≈34.1% | ≈34.1% | · | · | |
| อัตรากำไร EBITDA (TTM) | 42.5%ค่าเฉลี่ย 5 ปี ≈44.8% | ≈44.8% | 36.8% | อ่อนแอ | |
| อัตรากำไรก่อนหักภาษี (TTM) | 26.4%ค่าเฉลี่ย 5 ปี ≈28.8% | ≈28.8% | 31.2% | อ่อนแอ | |
| อัตรากำไรสุทธิ (TTM) | 20.7%ค่าเฉลี่ย 5 ปี ≈22.6% | ≈22.6% | 23.9% | อ่อนแอ | |
| ROA (TTM) | 5.9%ค่าเฉลี่ย 5 ปี ≈6.7% | ≈6.7% | 6.6% | อ่อนแอ | |
| ROE (TTM) | 16.8%ค่าเฉลี่ย 5 ปี ≈19.8% | ≈19.8% | 20.8% | อ่อนแอ | |
| ROIC | 22.0%ค่าเฉลี่ย 5 ปี ≈23.4% | ≈23.4% | · | · |
สุขภาพทางการเงิน หนี้สิน, สภาพคล่อง, ความสามารถในการชำระหนี้ — ความแข็งแกร่งของงบดุล
| ตัวชี้วัด | แนวโน้ม 5 ปี | NSC | ค่าเฉลี่ย 5 ปี | ค่ามัธยฐานของกลุ่มอุตสาหกรรม | บทสรุป |
|---|---|---|---|---|---|
| อัตราส่วนสภาพคล่อง (MRQ) | 0.9ค่าเฉลี่ย 5 ปี ≈0.9 | ≈0.9 | 0.9 | อยู่ในระดับเดียวกัน | |
| Quick Ratio (อัตราส่วนเงินสด) | 0.7ค่าเฉลี่ย 5 ปี ≈0.8 | ≈0.8 | 0.6 | สภาพคล่องสูง |
การเติบโต การเติบโตของรายได้, EPS และกำไรสุทธิ: YoY, CAGR 3 ปี, CAGR 5 ปี
| ตัวชี้วัด | แนวโน้ม 5 ปี | NSC | ค่าเฉลี่ย 5 ปี | ค่ามัธยฐานของกลุ่มอุตสาหกรรม | บทสรุป |
|---|---|---|---|---|---|
| Revenue YoY (รายได้ YoY) | 0.47%ค่าเฉลี่ย 5 ปี ≈4.8% | ≈4.8% | · | · | |
| Revenue CAGR 3Y (CAGR รายได้ 3 ปี) | -1.5%ค่าเฉลี่ย 5 ปี ≈2.9% | ≈2.9% | · | · | |
| Revenue CAGR 5Y (CAGR รายได้ 5 ปี) | 4.5% | · | · | · | |
| EPS YoY | 10.2%ค่าเฉลี่ย 5 ปี ≈16.3% | ≈16.3% | · | · | |
| Net Income YoY (กำไรสุทธิ YoY) | 9.6%ค่าเฉลี่ย 5 ปี ≈13.4% | ≈13.4% | · | · | |
| EPS CAGR 3Y (CAGR ของ EPS 3 ปี) | -2.8%ค่าเฉลี่ย 5 ปี ≈-1.2% | ≈-1.2% | · | · | |
| EPS CAGR 5Y (CAGR ของ EPS 5 ปี) | 10.2% | · | · | · | |
| Net Income CAGR 3Y (CAGR ของกำไรสุทธิ 3 ปี) | -4.2%ค่าเฉลี่ย 5 ปี ≈-3.9% | ≈-3.9% | · | · | |
| Net Income CAGR 5Y (CAGR ของกำไรสุทธิ 5 ปี) | 7.4% | · | · | · |
ประสิทธิภาพของเงินทุน อัตราหมุนเวียนสินทรัพย์, อัตราหมุนเวียนสินค้าคงคลัง, อัตราหมุนเวียนลูกหนี้
| ตัวชี้วัด | แนวโน้ม 5 ปี | NSC | ค่าเฉลี่ย 5 ปี | ค่ามัธยฐานของกลุ่มอุตสาหกรรม | บทสรุป |
|---|---|---|---|---|---|
| Asset Turnover (อัตราหมุนเวียนสินทรัพย์) | 0.3ค่าเฉลี่ย 5 ปี ≈0.3 | ≈0.3 | 0.3 | อ่อนแอ | |
| Receivables Turnover (อัตราหมุนเวียนลูกหนี้) | 11.8ค่าเฉลี่ย 5 ปี ≈11.5 | ≈11.5 | · | · | |
| Revenue / Employee (รายได้ต่อพนักงาน (รายได้ต่อปี ÷ จำนวนพนักงาน (จำนวนพนักงานที่รายงาน, yfinance) — เป็นค่าที่ได้จากการคำนวณ ไม่ใช่แนวคิด SEC-XBRL ที่จัดเก็บไว้)) | ≈$631.1K | · | · | · |
มูลค่า · ≈ ค่าเฉลี่ย 5 ปี · ค่าเฉลี่ยอุตสาหกรรม · การตัดสินใจเทียบกับค่าเฉลี่ย
เงินปันผล ผลตอบแทน, อัตราการจ่ายเงินปันผล, ประวัติเงินปันผล, CAGR 5 ปี
| วันที่ไม่ได้รับสิทธิปันผล | จำนวน | สกุลเงิน | ผลตอบแทน |
|---|---|---|---|
| ส.ค. 7, 2026 | $1.35 | USD | ≈1.6% |
| พ.ค. 8, 2026 | $1.35 | USD | ≈1.7% |
| ก.พ. 6, 2026 | $1.35 | USD | ≈1.8% |
| พ.ย. 7, 2025 | $1.35 | USD | ≈1.9% |
| ส.ค. 1, 2025 | $1.35 | USD | ≈2.0% |
| พ.ค. 2, 2025 | $1.35 | USD | ≈2.4% |
| ก.พ. 7, 2025 | $1.35 | USD | ≈2.2% |
| พ.ย. 1, 2024 | $1.35 | USD | ≈2.2% |
| ส.ค. 2, 2024 | $1.35 | USD | ≈2.2% |
| พ.ค. 2, 2024 | $1.35 | USD | ≈2.3% |
| ก.พ. 1, 2024 | $1.35 | USD | ≈2.1% |
| พ.ย. 2, 2023 | $1.35 | USD | ≈2.8% |
| ส.ค. 3, 2023 | $1.35 | USD | ≈2.3% |
| พ.ค. 4, 2023 | $1.35 | USD | ≈2.5% |
| ก.พ. 2, 2023 | $1.35 | USD | ≈2.0% |
| พ.ย. 3, 2022 | $1.24 | USD | ≈2.2% |
| ส.ค. 5, 2022 | $1.24 | USD | ≈1.9% |
| พ.ค. 5, 2022 | $1.24 | USD | ≈1.8% |
| ก.พ. 3, 2022 | $1.24 | USD | ≈1.6% |
| พ.ย. 4, 2021 | $1.09 | USD | ≈1.5% |
ประวัติผลประกอบการ EPS จริงเทียบกับประมาณการ, เปอร์เซ็นต์ส่วนต่าง%, อัตราการชนะ, วันประกาศผลประกอบการครั้งถัดไป
| งวด | รายงาน | EPS Actual | EPS คาด | ส่วนต่าง |
|---|---|---|---|---|
| 30 กันยายน 2026 | ต.ค. 21, 2026 | $3.62 | $3.51 | 3.3% |
| 30 มิถุนายน 2026 | ก.ค. 27, 2026 | $3.52 | $3.34 | 5.3% |
| 31 มีนาคม 2026 | $2.65 | $2.54 | 4.5% | |
| 31 ธันวาคม 2025 | $3.22 | $2.79 | 15.4% | |
| 30 กันยายน 2025 | $3.30 | $3.22 | 2.5% | |
| 30 มิถุนายน 2025 | $3.29 | $3.34 | -1.4% | |
| 31 มีนาคม 2025 | $2.69 | $2.72 | -0.99% |
ปัจจัยพื้นฐานฉบับเต็ม ตัวชี้วัดทั้งหมดรายปี — งบกำไรขาดทุน, งบดุล, งบกระแสเงินสด
งบกำไรขาดทุน
| ตัวชี้วัด | แนวโน้ม | 2025 | 2024 | 2023 | 2022 | 2021 | 2020 | 2019 | 2018 | 2017 | 2016 | 2015 | 2014 |
|---|---|---|---|---|---|---|---|---|---|---|---|---|---|
| Revenue | $12.18B | $12.12B | $12.16B | $12.74B | $11.14B | $9.79B | $11.30B | $11.46B | $10.55B | $9.89B | $10.51B | $11.62B | |
| Operating Expenses | $7.82B | $8.05B | $9.30B | $7.94B | $6.70B | $6.79B | $7.31B | $7.50B | $7.03B | $6.88B | $7.63B | $8.05B | |
| Operating Income | $4.36B | $4.07B | $2.85B | $4.81B | $4.45B | $3.00B | $3.99B | $3.96B | $3.52B | $3.01B | $2.88B | $3.58B | |
| Interest Expense | · | $807M | $722M | $692M | $646M | $625M | $604M | $557M | $550M | $563M | $545M | $545M | |
| Interest Income | · | · | · | · | · | · | · | · | $13M | $10M | $8M | $9M | |
| Other Non-op | $101M | $65M | $191M | $13M | $77M | $153M | $106M | $67M | $156M | $136M | $103M | $104M | |
| Pretax Income | $3.67B | $3.33B | $2.32B | $4.13B | $3.88B | $2.53B | $3.49B | $3.47B | $3.13B | $2.58B | $2.44B | $3.13B | |
| Income Tax | $792M | $707M | $493M | $860M | $873M | $517M | $769M | $803M | $-2.28B | $914M | $886M | $1.13B | |
| Net Income | $2.87B | $2.62B | $1.83B | $3.27B | $3.00B | $2.01B | $2.72B | $2.67B | $5.40B | $1.67B | $1.56B | $2.00B | |
| EPS (Basic) | $12.76 | $11.58 | $8.04 | $13.92 | $12.16 | $7.88 | $10.32 | $9.58 | $18.76 | $5.66 | $5.13 | $6.44 | |
| EPS (Diluted) | $12.75 | $11.57 | $8.02 | $13.88 | $12.11 | $7.84 | $10.25 | $9.51 | $18.61 | $5.62 | $5.10 | $6.39 | |
| Shares (Basic) | 225,000,000 | 226,100,000 | 226,900,000 | 234,800,000 | 246,900,000 | 255,100,000 | 263,300,000 | 277,700,000 | 287,900,000 | 293,900,000 | 301,900,000 | 309,400,000 | |
| Shares (Diluted) | 225,300,000 | 226,400,000 | 227,400,000 | 235,600,000 | 248,100,000 | 256,600,000 | 265,600,000 | 280,200,000 | 290,300,000 | 296,000,000 | 304,400,000 | 312,500,000 | |
| EBITDA | $5.75B | $5.42B | $4.15B | $6.03B | $5.63B | $4.16B | $5.13B | $5.06B | $3.59B | $3.07B | $2.88B | $3.58B |
งบดุล
| ตัวชี้วัด | แนวโน้ม | 2025 | 2024 | 2023 | 2022 | 2021 | 2020 | 2019 | 2018 | 2017 | 2016 | 2015 | 2014 |
|---|---|---|---|---|---|---|---|---|---|---|---|---|---|
| Cash & Equivalents | $1.53B | $1.64B | $1.57B | $456M | $839M | $1.11B | $580M | $358M | $690M | $956M | $1.10B | $973M | |
| Short-term Investments | · | · | · | · | · | · | · | · | · | · | · | $0 | |
| Receivables | $988M | $1.07B | $1.15B | $1.15B | $976M | $848M | $920M | $1.01B | $955M | $945M | $946M | $1.05B | |
| Other Current Assets | $409M | $201M | $292M | $150M | $134M | $134M | $337M | $288M | $282M | $133M | $194M | $347M | |
| Current Assets | $3.20B | $3.19B | $3.27B | $2.01B | $2.17B | $2.32B | $2.08B | $1.86B | $2.15B | $2.29B | $2.51B | $2.78B | |
| PP&E (Net) | $36.48B | $35.83B | $33.33B | $32.16B | $31.65B | $31.34B | $31.61B | $31.09B | $30.33B | $29.75B | $28.99B | $27.69B | |
| PP&E (Gross) | $51.10B | $49.79B | $46.59B | $44.75B | $43.68B | $43.33B | $43.60B | $43.47B | $42.24B | $41.49B | $40.47B | $38.51B | |
| Accum. Depreciation | $14.62B | $13.96B | $13.27B | $12.59B | $12.03B | $11.98B | $11.98B | $12.37B | $11.91B | $11.74B | $11.48B | $10.81B | |
| Other Non-current Assets | $1.47B | $1.29B | $1.22B | $1.03B | $966M | $709M | $800M | $177M | $251M | $73M | $63M | $49M | |
| Total Assets | $45.24B | $43.68B | $41.65B | $38.88B | $38.49B | $37.96B | $37.92B | $36.24B | $35.71B | $34.89B | $34.14B | $33.20B | |
| Accounts Payable | $1.86B | $1.70B | $1.64B | $1.29B | $1.35B | $1.02B | $1.43B | $1.50B | $1.40B | $1.22B | $1.09B | $1.23B | |
| Short-term Debt | · | · | $0 | $100M | $0 | · | · | $0 | $100M | $100M | $200M | $100M | |
| Current Liabilities | $3.77B | $3.54B | $2.63B | $2.65B | $2.52B | $2.16B | $2.30B | $2.59B | $2.54B | $2.34B | $2.23B | $1.78B | |
| Capital Leases | $148M | $191M | $287M | $316M | $331M | $344M | $441M | $0 | · | · | · | · | |
| Deferred Tax | $7.71B | $7.42B | $7.22B | $7.26B | $7.17B | $6.92B | $6.82B | $6.46B | $6.32B | $9.14B | $8.94B | $8.82B | |
| Other Non-current Liabilities | $1.72B | $1.76B | $1.84B | $1.76B | $1.88B | $1.99B | $1.74B | $1.27B | $1.35B | $1.44B | $1.39B | $1.31B | |
| Total Liabilities | $29.69B | $29.38B | $28.87B | $26.15B | $24.85B | $23.17B | $22.74B | $20.88B | $19.35B | $22.48B | $21.95B | $20.79B | |
| Long-term Debt | · | · | · | · | · | · | · | · | $9.74B | $10.11B | $9.89B | $8.88B | |
| Total Debt | · | · | $0 | $100M | · | · | · | $0 | $100M | $100M | $200M | $100M | |
| Paid-in Capital | $2.30B | $2.25B | $2.18B | $2.16B | $2.21B | $2.25B | $2.21B | $2.22B | $2.25B | $2.18B | $2.14B | $2.15B | |
| Retained Earnings | $13.23B | $12.09B | $10.70B | $10.70B | $11.59B | $12.88B | $13.21B | $13.44B | $14.18B | $10.43B | $10.19B | $10.35B | |
| Treasury Stock | $19M | $19M | $19M | $19M | $19M | $19M | $19M | $19M | $19M | $19M | $19M | $19M | |
| AOCI | $-210M | $-262M | $-320M | $-351M | $-402M | $-594M | $-491M | $-563M | $-356M | $-487M | $-445M | $-398M | |
| Stockholders' Equity | $15.55B | $14.31B | $12.78B | $12.73B | $13.64B | $14.79B | $15.18B | $15.36B | $16.36B | $12.41B | $12.19B | $12.41B | |
| Liabilities + Equity | $45.24B | $43.68B | $41.65B | $38.88B | $38.49B | $37.96B | $37.92B | $36.24B | $35.71B | $34.89B | $34.14B | $33.20B | |
| Shares Outstanding | 224,420,699 | 226,320,894 | 225,681,254 | 228,076,415 | 240,162,790 | 252,095,082 | 257,904,956 | 268,098,472 | 284,157,187 | 290,417,610 | 297,795,016 | 308,240,130 |
กระแสเงินสด
| ตัวชี้วัด | แนวโน้ม | 2025 | 2024 | 2023 | 2022 | 2021 | 2020 | 2019 | 2018 | 2017 | 2016 | 2015 | 2014 |
|---|---|---|---|---|---|---|---|---|---|---|---|---|---|
| D&A | $1.39B | $1.35B | $1.30B | $1.22B | $1.18B | $1.15B | $1.14B | $1.10B | $1.06B | $1.03B | · | · | |
| Deferred Tax | $277M | $176M | $-49M | $83M | $184M | $142M | $330M | $173M | $-2.86B | $227M | $320M | $294M | |
| Other Non-cash | $-182M | $-99M | $103M | $-352M | $-115M | $328M | $-299M | $-217M | · | · | · | · | |
| Operating Cash Flow | $4.36B | $4.05B | $3.18B | $4.22B | $4.25B | $3.64B | $3.89B | $3.73B | $3.25B | $3.03B | $2.91B | $2.92B | |
| CapEx | $2.20B | $2.38B | $2.33B | $1.95B | $1.47B | $1.49B | $2.02B | $1.95B | $1.72B | $1.89B | $2.38B | $2.12B | |
| Investing Cash Flow | $-2.56B | $-2.78B | $-2.18B | $-1.60B | $-1.22B | $-1.18B | $-1.76B | $-1.66B | $-1.48B | $-1.83B | · | $-2.00B | |
| Stock Repurchased | $534M | $0 | $622M | $3.11B | $3.39B | $1.44B | $2.10B | $2.78B | $1.01B | $803M | $1.07B | $318M | |
| Net Stock Activity | $-534M | $0 | $-622M | $-3.11B | $-3.39B | $-1.44B | $-2.10B | $-2.78B | $-1.01B | $-803M | $-1.07B | $-318M | |
| Dividends Paid | $1.22B | $1.22B | $1.23B | $1.17B | $1.03B | $960M | $949M | $844M | $703M | $695M | $713M | $687M | |
| Financing Cash Flow | $-1.91B | $-1.20B | $115M | $-3.00B | $-3.31B | $-1.93B | $-1.99B | $-2.31B | $-2.04B | $-1.35B | · | $-1.32B | |
| Net Change in Cash | $-111M | $73M | $1.11B | $-383M | $-276M | $535M | $134M | $-244M | $-266M | $-145M | $128M | $-470M | |
| Taxes Paid | $491M | $305M | $681M | $750M | $654M | $311M | $543M | $519M | $705M | $593M | $386M | $1.10B | |
| Free Cash Flow | $2.16B | $1.67B | $830M | $2.27B | $2.79B | $2.14B | $1.87B | $1.77B | $1.53B | $1.15B | $492M | $734M | |
| Levered FCF | · | $1.04B | $261M | $1.73B | $2.28B | $1.65B | $1.40B | $1.35B | $580M | $783M | $145M | $386M |
ความสามารถในการทำกำไร
| ตัวชี้วัด | แนวโน้ม | 2025 | 2024 | 2023 | 2022 | 2021 | 2020 | 2019 | 2018 | 2017 | 2016 | 2015 | 2014 |
|---|---|---|---|---|---|---|---|---|---|---|---|---|---|
| Operating Margin | 35.8% | 33.6% | 23.4% | 37.7% | 39.9% | 30.7% | 35.3% | 34.5% | 34.0% | 31.1% | 27.4% | 30.8% | |
| Net Margin | 23.6% | 21.6% | 15.0% | 25.7% | 27.0% | 20.6% | 24.1% | 23.3% | 51.2% | 16.9% | 14.8% | 17.2% | |
| Pretax Margin | 30.1% | 27.5% | 19.1% | 32.4% | 34.8% | 25.9% | 30.9% | 30.3% | 29.6% | 26.1% | 23.2% | 27.0% | |
| EBITDA Margin | 47.2% | 44.7% | 34.1% | 47.3% | 50.5% | 42.5% | 45.4% | 44.2% | 34.0% | 31.1% | 27.4% | 30.8% | |
| ROA | 6.5% | 6.2% | 4.5% | 8.5% | 7.9% | 5.3% | 7.3% | 7.4% | 15.3% | 4.8% | 4.6% | 6.1% | |
| ROE | 18.9% | 18.7% | 14.4% | 25.4% | 21.8% | 13.5% | 17.9% | 17.3% | 37.6% | 13.6% | 12.7% | 16.9% | |
| ROIC | 22.0% | 22.4% | 17.6% | 29.7% | 25.3% | 16.2% | 20.5% | 19.8% | 37.6% | 15.9% | 14.8% | 18.2% |
สภาพคล่องและความสามารถในการชำระหนี้
| ตัวชี้วัด | แนวโน้ม | 2025 | 2024 | 2023 | 2022 | 2021 | 2020 | 2019 | 2018 | 2017 | 2016 | 2015 | 2014 |
|---|---|---|---|---|---|---|---|---|---|---|---|---|---|
| Current Ratio | 0.8 | 0.9 | 1.2 | 0.8 | 0.9 | 1.1 | 0.9 | 0.7 | 0.8 | 1.0 | 1.2 | 1.6 | |
| Quick Ratio | 0.7 | 0.8 | 1.0 | 0.6 | 0.7 | 0.9 | 0.7 | 0.5 | 0.6 | 0.8 | 0.9 | 1.1 | |
| Debt / Equity | · | · | 0.0 | 0.0 | · | · | · | 0.0 | 0.0 | 0.0 | 0.0 | 0.0 | |
| Interest Coverage | · | 5.0 | 3.9 | 6.9 | 6.9 | 4.8 | 6.6 | 7.1 | 6.5 | 5.5 | 5.3 | 6.6 |
ประสิทธิภาพ
| ตัวชี้วัด | แนวโน้ม | 2025 | 2024 | 2023 | 2022 | 2021 | 2020 | 2019 | 2018 | 2017 | 2016 | 2015 | 2014 |
|---|---|---|---|---|---|---|---|---|---|---|---|---|---|
| Asset Turnover | 0.3 | 0.3 | 0.3 | 0.3 | 0.3 | 0.3 | 0.3 | 0.3 | 0.3 | 0.3 | 0.3 | 0.4 | |
| Receivables Turnover | 11.8 | 10.9 | 10.6 | 12.0 | 12.2 | 11.1 | 11.7 | 11.7 | 11.1 | 10.5 | 10.5 | 11.2 |
ต่อหุ้น
| ตัวชี้วัด | แนวโน้ม | 2025 | 2024 | 2023 | 2022 | 2021 | 2020 | 2019 | 2018 | 2017 | 2016 | 2015 | 2014 |
|---|---|---|---|---|---|---|---|---|---|---|---|---|---|
| Book Value / Share | $69.28 | $63.21 | $56.63 | $55.83 | $56.80 | $58.67 | $58.87 | $57.30 | $57.57 | $42.73 | $40.93 | $40.25 | |
| Revenue / Share | $54.06 | $53.55 | $53.46 | $54.10 | $44.91 | $38.15 | $42.53 | $40.89 | $36.35 | $33.41 | · | · | |
| Cash Flow / Share | $19.36 | $17.90 | $13.98 | $17.92 | $17.15 | $14.17 | $14.65 | $13.30 | $11.21 | $10.25 | · | · | |
| Cash / Share | $6.82 | $7.25 | $6.95 | $2.00 | $3.49 | $4.42 | $2.25 | $1.34 | $2.43 | $3.29 | $3.70 | $3.16 | |
| Dividend / Share | $5.40 | $5.40 | $5.40 | $4.96 | $4.16 | $3.76 | $3.60 | $3.04 | $2.44 | $2.36 | $2.36 | $2.22 | |
| EPS (TTM) | $12.75 | $11.57 | $8.02 | $13.88 | $12.11 | $7.84 | $10.25 | $9.51 | $18.61 | $5.62 | $5.10 | $6.39 |
อัตราการเติบโต
| ตัวชี้วัด | แนวโน้ม | 2025 | 2024 | 2023 | 2022 | 2021 | 2020 | 2019 | 2018 | 2017 | 2016 | 2015 | 2014 |
|---|---|---|---|---|---|---|---|---|---|---|---|---|---|
| Revenue YoY | 0.47% | -0.27% | -4.6% | 14.4% | 13.8% | · | · | · | · | · | · | · | |
| Revenue CAGR 3Y | -1.5% | 2.9% | 7.5% | · | · | · | · | · | · | · | · | · | |
| Revenue CAGR 5Y | 4.5% | · | · | · | · | · | · | · | · | · | · | · | |
| EPS YoY | 10.2% | 44.3% | -42.2% | 14.6% | 54.5% | · | · | · | · | · | · | · | |
| EPS CAGR 3Y | -2.8% | -1.5% | 0.76% | · | · | · | · | · | · | · | · | · | |
| EPS CAGR 5Y | 10.2% | · | · | · | · | · | · | · | · | · | · | · | |
| Net Income YoY | 9.6% | 43.5% | -44.1% | 8.8% | 49.3% | · | · | · | · | · | · | · | |
| Net Income CAGR 3Y | -4.2% | -4.4% | -3.2% | · | · | · | · | · | · | · | · | · | |
| Net Income CAGR 5Y | 7.4% | · | · | · | · | · | · | · | · | · | · | · | |
| Dividends Paid CAGR 5Y | 4.8% | · | · | · | · | · | · | · | · | · | · | · |
การประเมินมูลค่า (TTM)
| ตัวชี้วัด | แนวโน้ม | 2025 | 2024 | 2023 | 2022 | 2021 | 2020 | 2019 | 2018 | 2017 | 2016 | 2015 | 2014 |
|---|---|---|---|---|---|---|---|---|---|---|---|---|---|
| Revenue TTM | $12.18B | $12.12B | $12.16B | $12.74B | $11.14B | $9.79B | $11.30B | $11.46B | $10.55B | $9.89B | $10.51B | $11.62B | |
| Net Income TTM | $2.87B | $2.62B | $1.83B | $3.27B | $3.00B | $2.01B | $2.72B | $2.67B | $5.40B | $1.67B | $1.56B | $2.00B | |
| Market Cap | $64.79B | $53.12B | $53.35B | $56.20B | $71.50B | $59.90B | $50.07B | $40.09B | $41.17B | $31.39B | $25.19B | $33.79B | |
| Enterprise Value | · | · | $51.78B | $55.85B | · | · | · | $39.73B | $40.58B | $30.53B | $24.29B | $32.91B | |
| P/E | 22.6 | 20.3 | 29.5 | 17.8 | 24.6 | 30.3 | 18.9 | 15.7 | 7.8 | 19.2 | 16.6 | 17.2 | |
| P/S | 5.3 | 4.4 | 4.4 | 4.4 | 6.4 | 6.1 | 4.4 | 3.5 | 3.9 | 3.2 | 2.4 | 2.9 | |
| P/B | 4.2 | 3.7 | 4.2 | 4.4 | 5.2 | 4.0 | 3.3 | 2.6 | 2.5 | 2.5 | 2.1 | 2.7 | |
| P / Tangible Book | 4.2 | 3.7 | 4.2 | 4.4 | 5.2 | 4.0 | · | · | · | · | · | · | |
| P / Cash Flow | 14.9 | 13.1 | 16.8 | 13.3 | 16.8 | 16.5 | 12.9 | 10.8 | 12.7 | 10.3 | 8.8 | 11.8 | |
| P / FCF | 30.0 | 31.8 | 64.3 | 24.7 | 25.7 | 28.0 | 26.7 | 22.6 | 26.9 | 27.4 | 51.2 | 46.0 | |
| EV / EBITDA | · | · | 12.5 | 9.3 | · | · | · | 7.8 | 11.3 | 9.9 | 8.4 | 9.2 | |
| EV / FCF | · | · | 62.4 | 24.6 | · | · | · | 22.4 | 26.5 | 26.6 | 49.4 | 44.8 | |
| EV / Revenue | · | · | 4.3 | 4.4 | · | · | · | 3.5 | 3.8 | 3.1 | 2.3 | 2.8 | |
| Dividend Yield | 1.9% | 2.3% | 2.3% | 2.1% | 1.4% | 1.6% | 1.9% | 2.1% | 1.7% | 2.2% | 2.8% | 2.0% | |
| Earnings Yield | 4.4% | 4.9% | 3.4% | 5.6% | 4.1% | 3.3% | 5.3% | 6.4% | 12.8% | 5.2% | 6.0% | 5.8% | |
| Payout Ratio | 42.3% | 46.6% | 67.0% | 35.7% | 34.2% | 47.7% | 34.9% | 31.7% | 13.0% | 41.7% | 45.8% | 34.4% | |
| Annual Payout | $1.22B | $1.22B | $1.23B | $1.17B | $1.03B | $960M | $949M | $844M | $703M | $695M | $713M | $687M |
งบกำไรขาดทุน
| ตัวชี้วัด | แนวโน้ม | Q3 2026 | Q2 2026 | Q1 2026 | Q4 2025 | Q3 2025 | Q2 2025 | Q1 2025 | Q4 2024 | Q3 2024 | Q2 2024 | Q1 2024 | Q4 2023 | Q3 2023 | Q2 2023 | Q1 2023 | Q4 2022 |
|---|---|---|---|---|---|---|---|---|---|---|---|---|---|---|---|---|---|
| Revenue | $3.53B | $3.46B | $3.00B | $2.97B | $3.10B | $3.11B | $2.99B | $3.02B | $3.05B | $3.04B | $3.00B | $3.07B | $2.97B | $2.98B | $3.13B | $3.24B | |
| Operating Expenses | $2.38B | $2.34B | $2.12B | $2.04B | $2.00B | $1.94B | $1.85B | $1.89B | $1.46B | $1.91B | $2.79B | $2.27B | $2.21B | $2.40B | $2.42B | $2.06B | |
| Operating Income | $1.15B | $1.12B | $877M | $937M | $1.10B | $1.18B | $1.15B | $1.13B | $1.60B | $1.13B | $213M | $808M | $756M | $576M | $711M | $1.18B | |
| Interest Expense | · | · | · | · | · | · | · | · | · | · | $201M | · | $182M | $170M | $175M | $177M | |
| Other Non-op | $30M | $32M | $35M | $23M | $23M | $24M | $31M | $-4M | $34M | $17M | $18M | $38M | $40M | $57M | $56M | $34M | |
| Pretax Income | $987M | $959M | $715M | $765M | $924M | $998M | $978M | $928M | $1.43B | $944M | $30M | $651M | $614M | $463M | $592M | $1.04B | |
| Income Tax | $228M | $225M | $168M | $121M | $213M | $230M | $228M | $195M | $328M | $207M | $-23M | $124M | $136M | $107M | $126M | $248M | |
| Net Income | $759M | $734M | $547M | $644M | $711M | $768M | $750M | $733M | $1.10B | $737M | $53M | $527M | $478M | $356M | $466M | $790M | |
| EPS (Basic) | $3.38 | $3.26 | $2.43 | $2.88 | $3.16 | $3.41 | $3.31 | $3.23 | $4.86 | $3.26 | $0.23 | $2.33 | $2.11 | $1.56 | $2.04 | $3.41 | |
| EPS (Diluted) | $3.37 | $3.26 | $2.43 | $2.87 | $3.16 | $3.41 | $3.31 | $3.24 | $4.85 | $3.25 | $0.23 | $2.32 | $2.10 | $1.56 | $2.04 | $3.40 | |
| Shares (Basic) | 224,600,000 | 224,600,000 | 224,500,000 | · | 224,400,000 | 225,000,000 | 226,100,000 | · | 226,200,000 | 226,000,000 | 225,800,000 | · | 226,400,000 | 227,500,000 | 227,700,000 | · | |
| Shares (Diluted) | 225,200,000 | 225,000,000 | 225,000,000 | · | 224,700,000 | 225,200,000 | 226,500,000 | · | 226,500,000 | 226,400,000 | 226,200,000 | · | 227,000,000 | 228,000,000 | 228,300,000 | · | |
| EBITDA | $1.15B | $1.12B | $1.23B | · | $1.10B | $1.18B | $1.49B | · | $1.60B | $1.13B | $550M | · | $756M | $576M | $1.03B | · |
งบดุล
| ตัวชี้วัด | แนวโน้ม | Q3 2026 | Q2 2026 | Q1 2026 | Q4 2025 | Q3 2025 | Q2 2025 | Q1 2025 | Q4 2024 | Q3 2024 | Q2 2024 | Q1 2024 | Q4 2023 | Q3 2023 | Q2 2023 | Q1 2023 | Q4 2022 |
|---|---|---|---|---|---|---|---|---|---|---|---|---|---|---|---|---|---|
| Cash & Equivalents | $1.60B | $1.07B | $1.34B | $1.53B | $1.42B | $1.30B | $1.01B | $1.64B | $975M | $659M | $652M | · | $1.51B | $556M | $552M | · | |
| Receivables | $1.23B | $1.18B | $1.12B | $988M | $1.10B | $1.12B | $1.23B | $1.07B | $1.30B | $1.19B | $1.20B | · | $1.21B | $1.09B | $1.17B | · | |
| Other Current Assets | $145M | $228M | $248M | $409M | $219M | $168M | $191M | $201M | $125M | $148M | $236M | · | $123M | $114M | $138M | · | |
| Current Assets | $3.33B | $2.80B | $3.02B | $3.20B | $3.04B | $2.91B | $2.70B | $3.19B | $2.69B | $2.30B | $2.36B | · | $3.14B | $2.03B | $2.12B | · | |
| PP&E (Net) | $36.86B | $36.63B | $36.44B | $36.48B | $36.11B | $35.92B | $35.80B | $35.83B | $35.39B | $35.28B | $35.05B | · | $32.67B | $32.47B | $32.24B | · | |
| PP&E (Gross) | · | · | · | $51.10B | · | · | · | $49.79B | · | · | · | · | · | · | · | · | |
| Accum. Depreciation | $15.26B | $15.03B | $14.77B | $14.62B | $14.44B | $14.25B | $14.19B | $13.96B | $13.86B | $13.63B | $13.46B | · | $13.16B | $13.02B | $12.81B | · | |
| Other Non-current Assets | $1.58B | $1.54B | $1.53B | $1.47B | $1.35B | $1.29B | $1.29B | $1.29B | $1.21B | $1.16B | $1.15B | · | $1.10B | $1.08B | $1.07B | · | |
| Total Assets | $45.95B | $45.12B | $45.11B | $45.24B | $44.58B | $44.16B | $43.80B | $43.68B | $43.26B | $42.56B | $42.13B | · | $40.74B | $39.26B | $39.17B | · | |
| Accounts Payable | $2.06B | $1.78B | $1.70B | $1.86B | $1.66B | $1.50B | $1.45B | $1.70B | $1.61B | $1.53B | $1.51B | · | $1.50B | $1.42B | $1.31B | · | |
| Short-term Debt | · | · | · | · | · | · | · | · | · | $400M | $400M | · | $0 | $130M | $0 | · | |
| Current Liabilities | $3.68B | $3.37B | $3.33B | $3.77B | $3.52B | $3.67B | $3.45B | $3.54B | $3.68B | $3.67B | $3.45B | · | $2.91B | $2.99B | $2.82B | · | |
| Capital Leases | · | · | · | $148M | · | · | · | $191M | · | · | · | · | · | · | · | · | |
| Deferred Tax | $7.87B | $7.82B | $7.76B | $7.71B | $7.73B | $7.53B | $7.48B | $7.42B | $7.36B | $7.23B | $7.20B | · | $7.21B | $7.23B | $7.25B | · | |
| Other Non-current Liabilities | $1.70B | $1.71B | $1.72B | $1.72B | $1.71B | $1.71B | $1.70B | $1.76B | $1.79B | $1.75B | $1.77B | · | $1.82B | $1.81B | $1.78B | · | |
| Total Liabilities | $29.22B | $28.87B | $29.31B | $29.69B | $29.44B | $29.37B | $29.29B | $29.38B | $29.47B | $29.58B | $29.59B | · | $28.12B | $26.62B | $26.44B | · | |
| Total Debt | · | · | · | · | · | · | · | · | · | $400M | $400M | · | $0 | $130M | $0 | · | |
| Paid-in Capital | $2.36B | $2.33B | $2.31B | $2.30B | $2.28B | $2.26B | $2.25B | $2.25B | $2.22B | $2.21B | $2.19B | · | $2.16B | $2.16B | $2.15B | · | |
| Retained Earnings | $14.36B | $13.91B | $13.48B | $13.23B | $12.89B | $12.56B | $12.30B | $12.09B | $11.67B | $10.87B | $10.44B | · | $10.59B | $10.61B | $10.70B | · | |
| Treasury Stock | · | · | · | $19M | · | · | · | $19M | · | · | · | · | · | · | · | · | |
| AOCI | $-213M | $-212M | $-211M | $-210M | $-262M | $-261M | $-261M | $-262M | $-332M | $-330M | $-322M | · | $-364M | $-359M | $-355M | · | |
| Stockholders' Equity | $16.73B | $16.25B | $15.80B | $15.55B | $15.14B | $14.79B | $14.51B | $14.31B | $13.79B | $12.98B | $12.54B | $12.78B | $12.62B | $12.64B | $12.73B | $12.73B | |
| Liabilities + Equity | $45.95B | $45.12B | $45.11B | $45.24B | $44.58B | $44.16B | $43.80B | $43.68B | $43.26B | $42.56B | $42.13B | · | $40.74B | $39.26B | $39.17B | · | |
| Shares Outstanding | 224,616,686 | 224,608,373 | 224,594,001 | 224,420,699 | 224,386,617 | 224,614,894 | 225,443,501 | 226,320,894 | 226,239,662 | 226,096,433 | 225,914,028 | · | 226,136,334 | 227,015,277 | 227,639,602 | · |
กระแสเงินสด
| ตัวชี้วัด | แนวโน้ม | Q3 2026 | Q2 2026 | Q1 2026 | Q4 2025 | Q3 2025 | Q2 2025 | Q1 2025 | Q4 2024 | Q3 2024 | Q2 2024 | Q1 2024 | Q4 2023 | Q3 2023 | Q2 2023 | Q1 2023 | Q4 2022 |
|---|---|---|---|---|---|---|---|---|---|---|---|---|---|---|---|---|---|
| D&A | $363M | $358M | $352M | $353M | $348M | $346M | $346M | $342M | $339M | $335M | $337M | $330M | $326M | $321M | $321M | $309M | |
| Deferred Tax | $54M | $60M | $48M | $-38M | $206M | $52M | $57M | $35M | $136M | $31M | $-26M | $4M | $-18M | $-20M | $-15M | $60M | |
| Restructuring | · | · | · | · | · | · | · | · | · | $-3M | $64M | · | · | · | · | · | |
| Other Non-cash | · | · | $-603M | · | · | · | $-203M | · | · | · | $475M | · | · | · | $401M | · | |
| Operating Cash Flow | $1.32B | $1.05B | $344M | $1.06B | $1.27B | $1.08B | $950M | $951M | $1.23B | $1.04B | $839M | $673M | $660M | $673M | $1.17B | $798M | |
| CapEx | $586M | $439M | $382M | $729M | $551M | $475M | $449M | $675M | $581M | $568M | $557M | $836M | $543M | $520M | $428M | $666M | |
| Investing Cash Flow | $-479M | $-416M | $-213M | $-644M | $-483M | $-414M | $-1.02B | $11M | $-224M | $-723M | $-1.84B | $-788M | $-653M | $-350M | $-391M | $-543M | |
| Stock Repurchased | $0 | $0 | $5M | $0 | $78M | $208M | $248M | $0 | $0 | $0 | $0 | $119M | $200M | $140M | $163M | $826M | |
| Net Stock Activity | · | · | $-5M | · | · | · | $-248M | · | · | · | $0 | · | · | · | $-163M | · | |
| Dividends Paid | $304M | $303M | $303M | $303M | $303M | $303M | $306M | $306M | $305M | $305M | $305M | $305M | $305M | $308M | $307M | $286M | |
| Financing Cash Flow | $-314M | $-910M | $-320M | $-307M | $-673M | $-366M | $-564M | $-296M | $-686M | $-306M | $89M | $177M | $943M | $-319M | $-686M | $-1.01B | |
| Net Change in Cash | $529M | $-272M | $-189M | $112M | $115M | $297M | $-635M | $666M | $316M | $7M | $-916M | $62M | $950M | $4M | $96M | $-758M | |
| Taxes Paid | $170M | $248M | $138M | $58M | $19M | $413M | $1M | $21M | $177M | $109M | $-2M | $160M | $206M | $316M | $-1M | $172M | |
| Free Cash Flow | · | · | $-38M | · | · | · | $501M | · | · | · | $282M | · | · | · | $745M | · | |
| Levered FCF | · | · | · | · | · | · | · | · | · | · | $-73M | · | · | · | $607M | · |
ความสามารถในการทำกำไร
| ตัวชี้วัด | แนวโน้ม | Q3 2026 | Q2 2026 | Q1 2026 | Q4 2025 | Q3 2025 | Q2 2025 | Q1 2025 | Q4 2024 | Q3 2024 | Q2 2024 | Q1 2024 | Q4 2023 | Q3 2023 | Q2 2023 | Q1 2023 | Q4 2022 |
|---|---|---|---|---|---|---|---|---|---|---|---|---|---|---|---|---|---|
| Operating Margin | 32.6% | 32.4% | 29.2% | · | 35.4% | 37.8% | 38.3% | · | 52.3% | 37.2% | 7.1% | · | 25.4% | 19.3% | 22.7% | · | |
| Net Margin | 21.5% | 21.2% | 18.2% | · | 22.9% | 24.7% | 25.1% | · | 36.0% | 24.2% | 1.8% | · | 16.1% | 11.9% | 14.9% | · | |
| Pretax Margin | 28.0% | 27.7% | 23.8% | · | 29.8% | 32.1% | 32.7% | · | 46.8% | 31.0% | 1.0% | · | 20.7% | 15.5% | 18.9% | · | |
| EBITDA Margin | 32.6% | 32.4% | 41.0% | · | 35.4% | 37.8% | 49.9% | · | 52.3% | 37.2% | 18.3% | · | 25.4% | 19.3% | 33.0% | · | |
| ROA | 1.7% | 1.6% | 1.2% | · | 1.6% | 1.8% | 1.8% | · | 2.6% | 1.8% | 0.13% | · | 1.2% | 0.91% | 1.2% | · | |
| ROE | 4.8% | 4.7% | 3.6% | · | 4.9% | 5.5% | 5.5% | · | 8.3% | 5.8% | 0.42% | · | 3.7% | 2.8% | 3.6% | · | |
| ROIC | 5.3% | 5.3% | 4.2% | · | 5.6% | 6.1% | 6.1% | · | 8.9% | 6.6% | 2.9% | · | 4.7% | 3.5% | 4.4% | · |
สภาพคล่องและความสามารถในการชำระหนี้
| ตัวชี้วัด | แนวโน้ม | Q3 2026 | Q2 2026 | Q1 2026 | Q4 2025 | Q3 2025 | Q2 2025 | Q1 2025 | Q4 2024 | Q3 2024 | Q2 2024 | Q1 2024 | Q4 2023 | Q3 2023 | Q2 2023 | Q1 2023 | Q4 2022 |
|---|---|---|---|---|---|---|---|---|---|---|---|---|---|---|---|---|---|
| Current Ratio | 0.9 | 0.8 | 0.9 | · | 0.9 | 0.8 | 0.8 | · | 0.7 | 0.6 | 0.7 | · | 1.1 | 0.7 | 0.8 | · | |
| Quick Ratio | 0.8 | 0.7 | 0.7 | · | 0.7 | 0.7 | 0.6 | · | 0.6 | 0.5 | 0.5 | · | 0.9 | 0.6 | 0.6 | · | |
| Debt / Equity | · | · | · | · | · | · | · | · | · | 0.0 | 0.0 | · | 0.0 | 0.0 | 0.0 | · | |
| Interest Coverage | · | · | · | · | · | · | · | · | · | · | 1.1 | · | 4.2 | 3.4 | 4.1 | · |
ประสิทธิภาพ
| ตัวชี้วัด | แนวโน้ม | Q3 2026 | Q2 2026 | Q1 2026 | Q4 2025 | Q3 2025 | Q2 2025 | Q1 2025 | Q4 2024 | Q3 2024 | Q2 2024 | Q1 2024 | Q4 2023 | Q3 2023 | Q2 2023 | Q1 2023 | Q4 2022 |
|---|---|---|---|---|---|---|---|---|---|---|---|---|---|---|---|---|---|
| Asset Turnover | 0.1 | 0.1 | 0.1 | · | 0.1 | 0.1 | 0.1 | · | 0.1 | 0.1 | 0.1 | · | 0.1 | 0.1 | 0.1 | · | |
| Receivables Turnover | 3.0 | 3.0 | 2.5 | · | 2.6 | 2.7 | 2.5 | · | 2.4 | 2.7 | 2.5 | · | 2.5 | 2.6 | 2.8 | · |
ต่อหุ้น
| ตัวชี้วัด | แนวโน้ม | Q3 2026 | Q2 2026 | Q1 2026 | Q4 2025 | Q3 2025 | Q2 2025 | Q1 2025 | Q4 2024 | Q3 2024 | Q2 2024 | Q1 2024 | Q4 2023 | Q3 2023 | Q2 2023 | Q1 2023 | Q4 2022 |
|---|---|---|---|---|---|---|---|---|---|---|---|---|---|---|---|---|---|
| Book Value / Share | $74.48 | $72.36 | $70.37 | · | $67.48 | $65.83 | $64.37 | · | $60.93 | $57.40 | $55.49 | · | $55.78 | $55.68 | $55.91 | · | |
| Revenue / Share | $15.66 | $15.40 | $13.32 | · | $13.81 | $13.81 | $13.21 | · | $13.47 | $13.45 | $13.28 | · | $13.09 | $13.07 | $13.72 | · | |
| Cash Flow / Share | · | · | $1.53 | · | · | · | $4.19 | · | · | · | $3.71 | · | · | · | $5.14 | · | |
| Cash / Share | $7.11 | $4.76 | $5.97 | · | $6.32 | $5.80 | $4.46 | · | $4.31 | $2.91 | $2.89 | · | $6.66 | $2.45 | $2.42 | · | |
| Dividend / Share | $1.35 | $1.35 | $1.35 | $1.35 | $1.35 | $1.35 | $1.35 | $1.35 | $1.35 | $1.35 | $1.35 | $1.35 | $1.35 | $1.35 | $1.35 | $1.24 | |
| EPS (TTM) | $11.93 | $11.72 | $11.87 | · | $13.12 | $14.81 | $14.65 | · | $10.65 | $7.90 | $6.21 | · | $9.10 | $11.10 | $12.99 | · |
การประเมินมูลค่า (TTM)
| ตัวชี้วัด | แนวโน้ม | Q3 2026 | Q2 2026 | Q1 2026 | Q4 2025 | Q3 2025 | Q2 2025 | Q1 2025 | Q4 2024 | Q3 2024 | Q2 2024 | Q1 2024 | Q4 2023 | Q3 2023 | Q2 2023 | Q1 2023 | Q4 2022 |
|---|---|---|---|---|---|---|---|---|---|---|---|---|---|---|---|---|---|
| Revenue TTM | $12.96B | $12.54B | $12.19B | · | $12.23B | $12.18B | $12.11B | · | $12.17B | $12.09B | $12.03B | · | $12.32B | $12.69B | $12.96B | · | |
| Net Income TTM | $2.68B | $2.64B | $2.67B | · | $2.96B | $3.35B | $3.32B | · | $2.42B | $1.79B | $1.41B | · | $2.09B | $2.57B | $3.03B | · | |
| Market Cap | $69.41B | $70.66B | $64.46B | · | $67.41B | $57.49B | $53.40B | · | $56.22B | $48.54B | $57.58B | · | $44.53B | $51.48B | $48.26B | · | |
| Enterprise Value | · | · | · | · | · | · | · | · | · | $48.28B | $57.33B | · | $43.03B | $51.05B | $47.71B | · | |
| P/E | 25.9 | 26.8 | 24.2 | · | 22.9 | 17.3 | 16.2 | · | 23.3 | 27.2 | 41.0 | · | 21.6 | 20.4 | 16.3 | · | |
| P/S | 5.4 | 5.6 | 5.3 | · | 5.5 | 4.7 | 4.4 | · | 4.6 | 4.0 | 4.8 | · | 3.6 | 4.1 | 3.7 | · | |
| P/B | 4.1 | 4.3 | 4.1 | · | 4.5 | 3.9 | 3.7 | · | 4.1 | 3.7 | 4.6 | · | 3.5 | 4.1 | 3.8 | · | |
| P / Tangible Book | 4.1 | 4.3 | 4.1 | · | 4.5 | 3.9 | 3.7 | · | 4.1 | 3.7 | 4.6 | · | 3.5 | 4.1 | 3.8 | · | |
| P / Cash Flow | · | · | 187.4 | · | · | · | 56.2 | · | · | · | 68.6 | · | · | · | 41.1 | · | |
| EV / Revenue | · | · | · | · | · | · | · | · | · | 4.0 | 4.8 | · | 3.5 | 4.0 | 3.7 | · | |
| Dividend Yield | 1.8% | 1.7% | 1.9% | · | 1.8% | 2.1% | 2.3% | · | 2.2% | 2.5% | 2.1% | · | 2.7% | 2.3% | 2.4% | · | |
| Earnings Yield | 3.9% | 3.7% | 4.1% | · | 4.4% | 5.8% | 6.2% | · | 4.3% | 3.7% | 2.4% | · | 4.6% | 4.9% | 6.1% | · | |
| Payout Ratio | · | · | 55.4% | · | · | · | 40.8% | · | · | · | 575.5% | · | · | · | 65.9% | · | |
| Annual Payout | $1.21B | $1.21B | $1.21B | · | $1.22B | $1.22B | $1.22B | · | $1.22B | $1.22B | $1.22B | · | $1.21B | $1.19B | $1.18B | · |
ช่วงเวลาล่าสุดอยู่ทางซ้าย · ค่า null แสดงเป็น ·
งบการเงิน งบกำไรขาดทุน, งบดุล, งบกระแสเงินสด — รายปี, 5 ปีล่าสุด
| ตัวชี้วัด | 2025-12-31 | 2024-12-31 | 2023-12-31 | 2022-12-31 | 2021-12-31 |
|---|---|---|---|---|---|
| รายได้ | $12.18B | $12.12B | $12.16B | $12.74B | $11.14B |
| อัตรากำไรจากการดำเนินงาน % | 35.8% | 33.6% | 23.4% | 37.7% | 39.9% |
| กำไรสุทธิ | $2.87B | $2.62B | $1.83B | $3.27B | $3.00B |
| EPS ที่ปรับลดแล้ว | $12.75 | $11.57 | $8.02 | $13.88 | $12.11 |
| ตัวชี้วัด | 2025-12-31 | 2024-12-31 | 2023-12-31 | 2022-12-31 | 2021-12-31 |
|---|---|---|---|---|---|
| หนี้สินต่อทุน | · | · | 0.0 | 0.0 | · |
| อัตราส่วนสภาพคล่อง | 0.8 | 0.9 | 1.2 | 0.8 | 0.9 |
| อัตราส่วนเงินสด | 0.7 | 0.8 | 1.0 | 0.6 | 0.7 |
| ตัวชี้วัด | 2025-12-31 | 2024-12-31 | 2023-12-31 | 2022-12-31 | 2021-12-31 |
|---|---|---|---|---|---|
| กระแสเงินสดอิสระ | $2.16B | $1.67B | $830M | $2.27B | $2.79B |
ผู้ถือครองสถาบัน (13F) 2,020 รายงาน · $58.9B ทั้งหมด · ณ วันที่ 30 กันยายน 2026
สถาบันที่รายงานการถือครองหุ้นนี้ในเอกสาร SEC Form 13F รายไตรมาสของตน เฉพาะสถานะ Long; ผู้ยื่นคำร้องรายเดียวอาจปรากฏสองครั้งสำหรับสัญญาออปชันที่แยกจากกัน ขา put/call ขนาดใหญ่ที่หักล้างกันมักสะท้อนถึงการทำตลาด (market-making) หรือสินค้าคงคลังที่มีการป้องกันความเสี่ยง (hedged inventory) ไม่ใช่การเชื่อมั่นในทิศทาง
| พอร์ตใหม่ | ตำแหน่งที่ปิดไปแล้ว | เพิ่มขึ้น | ลดลง | การเปลี่ยนแปลงสุทธิของจำนวนหุ้น |
|---|---|---|---|---|
| 120 (-47 เทียบกับไตรมาสก่อน) | 81 (-29 เทียบกับไตรมาสก่อน) | 603 (+29 เทียบกับไตรมาสก่อน) | 662 (-13 เทียบกับไตรมาสก่อน) | +2.8M |
เปรียบเทียบกับ Q1 2026. การยื่นแบบฟอร์ม 13F ของ SEC จะครบกำหนดภายใน 45 วันนับจากสิ้นสุดไตรมาส บวกกับระยะเวลาผ่อนผันสั้นๆ สำหรับผู้ยื่นล่าช้า — ไตรมาสที่ยังอยู่ในช่วงเวลานี้จะถูกข้ามไปเพื่อใช้คู่ที่รายงานล่าสุดอย่างสมบูรณ์
| สถาบัน | มูลค่า | หุ้น | % ของ 13F ที่ติดตาม | ประเภท |
|---|---|---|---|---|
| VANGUARD GROUP INC | $6,012,835,660 | 20,825,837 | 10.21% | หุ้น |
| BlackRock, Inc. | $5,033,548,870 | 16,000,346 | 8.55% | หุ้น |
| VANGUARD CAPITAL MANAGEMENT LLC | $4,613,819,725 | 14,666,136 | 7.84% | หุ้น |
| STATE STREET CORP | $3,222,287,800 | 10,242,817 | 5.47% | หุ้น |
| VANGUARD PORTFOLIO MANAGEMENT LLC | $2,270,049,352 | 7,215,898 | 3.86% | หุ้น |
| MILLENNIUM MANAGEMENT LLC | $1,636,411,612 | 5,201,728 | 2.78% | หุ้น |
| GEODE CAPITAL MANAGEMENT, LLC | $1,601,393,228 | 5,114,278 | 2.72% | หุ้น |
| BANK OF AMERICA CORP /DE/ | $978,976,908 | 3,111,914 | 1.66% | หุ้น |
| NORGES BANK | $956,551,163 | 3,040,628 | 1.62% | หุ้น |
| Pentwater Capital Management LP | $872,987,250 | 2,775,000 | 1.48% | หุ้น |
| NORTHERN TRUST CORP | $822,465,983 | 2,614,406 | 1.40% | หุ้น |
| MORGAN STANLEY | $821,705,332 | 2,611,985 | 1.40% | หุ้น |
| D. E. Shaw & Co., Inc. | $818,312,137 | 2,601,202 | 1.39% | หุ้น |
| Dodge & Cox | $789,031,988 | 2,508,128 | 1.34% | หุ้น |
| DIMENSIONAL FUND ADVISORS LP | $710,936,268 | 2,259,711 | 1.21% | หุ้น |
| Capital World Investors | $632,929,806 | 2,011,919 | 1.08% | หุ้น |
| GOLDMAN SACHS GROUP INC | $594,243,849 | 1,888,947 | 1.01% | หุ้น |
| HBK INVESTMENTS L P | $550,532,500 | 1,750,000 | 0.94% | หุ้น |
| ARROWSTREET CAPITAL, LIMITED PARTNERSHIP | $544,885,295 | 1,732,049 | 0.93% | หุ้น |
| LONDON CO OF VIRGINIA | $520,023,403 | 1,652,991 | 0.88% | หุ้น |
| Legal & General Group Plc | $503,093,274 | 1,599,203 | 0.85% | หุ้น |
| CITADEL ADVISORS LLC | $498,772,064 | 1,585,467 | 0.85% | หุ้น |
| Amundi | $484,658,927 | 1,540,605 | 0.82% | หุ้น |
| AMERICAN CENTURY COMPANIES INC | $480,143,373 | 1,526,249 | 0.82% | หุ้น |
| CHARLES SCHWAB INVESTMENT MANAGEMENT INC | $466,667,210 | 1,483,414 | 0.79% | หุ้น |
| MIRAE ASSET GLOBAL ETFS HOLDINGS Ltd. | $449,103,232 | 1,427,631 | 0.76% | หุ้น |
| FMR LLC | $437,083,847 | 1,389,376 | 0.74% | หุ้น |
| JPMORGAN CHASE & CO | $427,557,566 | 1,350,252 | 0.73% | หุ้น |
| Invesco Ltd. | $423,564,249 | 1,346,401 | 0.72% | หุ้น |
| VANGUARD FIDUCIARY TRUST CO | $396,694,844 | 1,260,990 | 0.67% | หุ้น |
| Fisher Asset Management, LLC | $377,649,537 | 1,200,449 | 0.64% | หุ้น |
| Capital Wealth Planning, LLC | $374,289,382 | 1,189,769 | 0.64% | หุ้น |
| Bank of New York Mellon Corp | $364,413,917 | 1,158,377 | 0.62% | หุ้น |
| DEUTSCHE BANK AG\ | $356,558,194 | 1,133,406 | 0.61% | หุ้น |
| Balyasny Asset Management L.P. | $349,563,914 | 1,111,173 | 0.59% | หุ้น |
| UBS AM, a distinct business unit of UBS ASSET MANAGEMENT AMERICAS LLC | $331,236,745 | 1,154,135 | 0.56% | หุ้น |
| WELLS FARGO & COMPANY/MN | $328,710,187 | 1,044,885 | 0.56% | หุ้น |
| CAXTON ASSOCIATES LLP | $328,235,341 | 1,043,375 | 0.56% | หุ้น |
| PRIMECAP MANAGEMENT CO/CA/ | $324,943,157 | 1,032,910 | 0.55% | หุ้น |
| UBS Group AG | $316,053,788 | 1,004,653 | 0.54% | หุ้น |
| Qube Research & Technologies Ltd | $281,635,125 | 895,245 | 0.48% | หุ้น |
| ADAGE CAPITAL PARTNERS GP, L.L.C. | $241,144,560 | 766,536 | 0.41% | หุ้น |
| Kryger Capital LLC | $241,052,385 | 766,243 | 0.41% | หุ้น |
| Verition Fund Management LLC | $238,688,242 | 758,728 | 0.41% | หุ้น |
| CITIGROUP INC | $236,771,786 | 752,636 | 0.40% | หุ้น |
| HOTCHKIS & WILEY CAPITAL MANAGEMENT LLC | $228,750,343 | 727,138 | 0.39% | หุ้น |
| LMR Partners LLP | $227,100,948 | 721,895 | 0.39% | หุ้น |
| MARSHALL WACE, LLP | $223,838,964 | 711,526 | 0.38% | หุ้น |
| Symmetry Investments LP | $204,639,222 | 650,496 | 0.35% | หุ้น |
| TUDOR INVESTMENT CORP ET AL | $203,585,346 | 647,145 | 0.35% | หุ้น |
นักเคลื่อนไหวและเจ้าของ %+ 5 1 รายการ
นักลงทุนที่ยื่น SEC Schedule 13D — กรรมสิทธิ์ตามผลประโยชน์ที่แท้จริงสูงกว่า % 5 โดยมีเจตนาที่จะมีอิทธิพลต่อผู้ออกหลักทรัพย์ (การถือหุ้นของนักเคลื่อนไหว, การรณรงค์ในคณะกรรมการ, M&A) แต่ละแถวแสดงสถานะล่าสุดที่ทราบของตำแหน่งของผู้ยื่นคำร้องรายนั้น
| ผู้ยื่นคำร้อง | ยื่นแล้ว | ส่วนได้เสีย | สถานะ | วัตถุประสงค์ | การยื่นคำร้อง |
|---|---|---|---|---|---|
| ผู้รายงานที่ไม่ได้เปิดเผย, ผู้รายงานที่ไม่ได้เปิดเผย, ผู้รายงานที่ไม่ได้เปิดเผย, ผู้รายงานที่ไม่ได้เปิดเผย, ผู้รายงานที่ไม่ได้เปิดเผย, ผู้รายงานที่ไม่ได้เปิดเผย, ผู้รายงานที่ไม่ได้เปิดเผย | 20 กุมภาพันธ์ 2001 | · | การยื่นคำร้องครั้งแรก | โครงสร้างเงินทุน | SEC |
Purpose is an automated classification of the filer's own stated purpose (SEC Item 4) — not investment advice. "—" means no clear purpose was stated or the text could not be classified.
ผู้บริหารบริษัท 75 รายชื่อผู้บริหาร · ผู้บริหาร 15 คน · กรรมการ 24 คน
| ผู้บริหารภายใน | บทบาท | กิจกรรมล่าสุด | หุ้นที่ถือครอง | ซื้อ 12 เดือน | ขาย 12 เดือน | สุทธิ 12 เดือน |
|---|---|---|---|---|---|---|
| Mark R George | President & CEO | 13 กันยายน 2026 M | 22,783 | 0 | 0 | $0 |
| Charles W Moorman | Chairman & CEO | 5 มีนาคม 2015 G | 344,693 | 0 | 0 | $0 |
| John P Rathbone | EVP Finance and CFO | 24 ตุลาคม 2013 M | 123,392 | 0 | 0 | $0 |
| Brian Barr | Chief Operating Officer | 24 ตุลาคม 2026 M | 1,354 | 0 | 0 | $0 |
| Mark D Manion | Exec. Vice President & COO | 28 มกราคม 2016 A | 32,270 | 0 | 0 | $0 |
| Anil Bhatt | EVP & CIDO | 24 ตุลาคม 2026 M | 3,960 | 0 | 1 | $-253,440 |
| Deborah H Butler | Exec. V.P.- Planning & CIO | 29 มิถุนายน 2015 G | 27,223 | 0 | 0 | $0 |
| Donald W Seale | Exec. V.P. and CMO | 29 มกราคม 2015 M | 207,501 | 0 | 0 | $0 |
| Daniel D Smith | S.V.P.-Energy and Properties | 6 พฤษภาคม 2010 S | 11,702 | 0 | 0 | $0 |
| Henry C Wolf | Vice Chrmn. & C.F.O. | 29 มิถุนายน 2007 A | 234,058 | 0 | 0 | $0 |
| Kathryn B. Mcquade | Exec. V.P.-Planning & CIO | 4 พฤษภาคม 2007 M | 100,578 | 0 | 0 | $0 |
| L I Prillaman | Vice Chmn. & C.M.O. | 31 มีนาคม 2006 M | 285,842 | 0 | 0 | $0 |
| Henry D Light | Senior Vice President - Law | 24 กุมภาพันธ์ 2005 M | 40,544 | 0 | 0 | $0 |
| Stephen P Renken | Former V.P. - Chief Info. Off. | 2 มกราคม 2004 D | · | 0 | 0 | $0 |
| John M Samuels | Senior V.P.- Oper.Plan.&Supp. | 10 กันยายน 2003 A | · | 0 | 0 | $0 |
| John C Huffard Jr | กรรมการ | 8 ตุลาคม 2026 W | 333 | 0 | 0 | $0 |
| Richard H Anderson | กรรมการ | 30 กันยายน 2026 A | 7,000 | 1 | 0 | $732,836 |
| Sameh Fahmy | กรรมการ | 20 สิงหาคม 2026 A | 12,000 | 1 | 0 | $466,900 |
| Mary Kathryn Heitkamp | กรรมการ | 20 สิงหาคม 2026 A | · | 0 | 0 | $0 |
| William Clyburn Jr. | กรรมการ | 20 สิงหาคม 2026 A | 405 | 1 | 0 | $60,137 |
| Phillip S Davidson | กรรมการ | 20 สิงหาคม 2026 A | · | 0 | 0 | $0 |
| Francesca A. Debiase | กรรมการ | 20 สิงหาคม 2026 A | 350 | 0 | 0 | $0 |
| Marcela E Donadio | กรรมการ | 20 สิงหาคม 2026 A | · | 0 | 0 | $0 |
| Christopher T Jones | กรรมการ | 20 สิงหาคม 2026 A | · | 0 | 0 | $0 |
| Lori Ryerkerk | กรรมการ | 20 สิงหาคม 2026 A | · | 0 | 0 | $0 |
| Gilbert H Lamphere | กรรมการ | 20 สิงหาคม 2026 A | 3,647 | 0 | 0 | $0 |
| Karen N Horn | กรรมการ | 10 มีนาคม 2016 A | 3,000 | 0 | 0 | $0 |
| Burton M Joyce | กรรมการ | 10 มีนาคม 2014 A | · | 0 | 0 | $0 |
| Gerald L Baliles | กรรมการ | 11 มีนาคม 2013 A | · | 0 | 0 | $0 |
| Paul J Reason | กรรมการ | 11 มีนาคม 2013 A | · | 0 | 0 | $0 |
| CORRELL ALSTON D | กรรมการ | 11 มีนาคม 2013 A | 8,000 | 0 | 0 | $0 |
| Gene R Carter | กรรมการ | 31 มีนาคม 2011 A | 50 | 0 | 0 | $0 |
| Landon Hilliard | กรรมการ | 10 มีนาคม 2011 A | 13,745 | 0 | 0 | $0 |
| Jane Margaret Obrien | กรรมการ | 24 มกราคม 2008 A | · | 0 | 0 | $0 |
| Harold W Pote | กรรมการ | 31 มีนาคม 2006 A | · | 0 | 0 | $0 |
| David R Goode | กรรมการ | 28 กุมภาพันธ์ 2006 M | 816,897 | 0 | 0 | $0 |
| George D Johnson JR | กรรมการ | 31 มีนาคม 2004 A | · | 0 | 0 | $0 |
| John F Orr | · | 26 เมษายน 2026 M | 11,363 | 0 | 0 | $0 |
| Claiborne L Moore | · | 30 มกราคม 2026 M | 4,970 | 0 | 0 | $0 |
| Claude E Elkins | · | 30 มกราคม 2026 M | 3,365 | 0 | 0 | $0 |
| Jason Andrew Zampi | · | 30 มกราคม 2026 M | 4,145 | 0 | 0 | $0 |
| Claude Mongeau | · | 20 พฤษภาคม 2025 A | 20,000 | 0 | 0 | $0 |
| Thomas Colm Kelleher | · | 20 กุมภาพันธ์ 2025 A | 2,282 | 0 | 0 | $0 |
| Alan H. Shaw | · | 13 กันยายน 2024 M | 35,045 | 0 | 0 | $0 |
| Nabanita C Nag | · | 29 กรกฎาคม 2024 S | 1,488 | 0 | 0 | $0 |
| Paul B Duncan | · | 2 มีนาคม 2024 M | 2,621 | 0 | 0 | $0 |
| Mitchell E Daniels | · | 20 กุมภาพันธ์ 2024 A | 720 | 0 | 0 | $0 |
| Jennifer F. Scanlon | · | 20 กุมภาพันธ์ 2024 A | 42 | 0 | 0 | $0 |
| Thomas D Bell JR | · | 20 กุมภาพันธ์ 2024 A | 5,920 | 0 | 0 | $0 |
| Amy E Miles | · | 20 กุมภาพันธ์ 2024 A | 3,000 | 0 | 0 | $0 |
| Michael D Lockhart | · | 20 กุมภาพันธ์ 2024 A | 6,012 | 0 | 0 | $0 |
| John R Thompson | · | 20 กุมภาพันธ์ 2024 A | 3,144 | 0 | 0 | $0 |
| LEER STEVEN F | · | 20 กุมภาพันธ์ 2024 A | 5,220 | 0 | 0 | $0 |
| Ann A Adams | · | 30 มกราคม 2024 M | 19,779 | 0 | 0 | $0 |
| James A Squires | · | 21 กุมภาพันธ์ 2023 A | 60,907 | 0 | 0 | $0 |
| Cynthia M Sanborn | · | 30 มกราคม 2022 M | 2,791 | 0 | 0 | $0 |
| Lorri J Kleine | · | 27 มกราคม 2022 A | 2,089 | 0 | 0 | $0 |
| Clyde H Allison Jr | · | 27 มกราคม 2022 F | 43,456 | 0 | 0 | $0 |
| Vanessa Allen Sutherland | · | 1 กุมภาพันธ์ 2021 M | 1,400 | 0 | 0 | $0 |
| Michael Joseph Wheeler | · | 11 สิงหาคม 2020 S | 11,058 | 0 | 0 | $0 |
| Daniel A Carp | · | 10 มีนาคม 2020 A | 3,890 | 0 | 0 | $0 |
| John Meade Scheib | · | 30 มกราคม 2020 A | 9,874 | 0 | 0 | $0 |
| Cynthia C Earhart | · | 30 ตุลาคม 2019 M | 1,864 | 0 | 0 | $0 |
| Martin H. Nesbitt | · | 11 มีนาคม 2019 A | 3,000 | 0 | 0 | $0 |
| Wesley G Bush | · | 28 มกราคม 2019 A | 3,389 | 0 | 0 | $0 |
| Thomas E Hurlbut | · | 11 พฤษภาคม 2018 M | 0 | 0 | 0 | $0 |
| Erskine B Bowles | · | 29 มีนาคม 2018 A | 3,477 | 0 | 0 | $0 |
| William Andrew Galanko | · | 25 มกราคม 2018 F | 16,706 | 0 | 0 | $0 |
| Marta R Stewart | · | 26 พฤษภาคม 2017 S | 15,633 | 0 | 0 | $0 |
| Robert A Bradway | · | 10 มีนาคม 2017 A | 3,000 | 0 | 0 | $0 |
| James A Hixon | · | 26 มกราคม 2017 M | 130,073 | 0 | 0 | $0 |
| Stephen C Tobias | · | 29 มกราคม 2009 A | 276,365 | 0 | 0 | $0 |
| James W Mcclellan | · | 1 ธันวาคม 2003 D | · | 0 | 0 | $0 |
| John W Fox JR | · | 1 ธันวาคม 2003 | · | 0 | 0 | $0 |
| John F Corcoran | · | 10 กันยายน 2003 A | · | 0 | 0 | $0 |
ผู้บริหารจากเอกสาร SEC Form 3/4/5; สุทธิ = เฉพาะการซื้อขายในตลาดเปิด
การถือครอง ETF ถือโดย ETF 122 ราย
น้ำหนักสะท้อนถึงการถือครองหุ้นโดยตรง (N-PORT) เท่านั้น กองทุนเลเวอเรจหรือกองทุนที่อิงตราสารอนุพันธ์อาจมีการเปิดรับความเสี่ยงจากสัญญาแลกเปลี่ยน (swap) เพิ่มเติมซึ่งไม่แสดง
| กองทุน | น้ำหนัก | หน่วย | ณ วันที่ | แหล่งที่มา |
|---|---|---|---|---|
| IYT · iShares Trust | 4.78% | 298,387 SH | 11 กันยายน 2026 | รายวัน |
| MNA · New York Life Investments ETF Trust | 4.34% | 32,575 NS | 31 กรกฎาคม 2026 | N-PORT |
| SHPP · Pacer Funds Trust | 3.89% | 240 NS | 31 กรกฎาคม 2026 | N-PORT |
| TPOR · Direxion Shares ETF Trust | 2.12% | 1,110 NS | 31 กรกฎาคม 2026 | N-PORT |
| EVNT · AltShares Trust | 2.05% | 781 NS | 31 สิงหาคม 2026 | N-PORT |
| IQRA · New York Life Investments Active ET… | 1.29% | 265 NS | 31 กรกฎาคม 2026 | N-PORT |
| RSPN · Invesco Exchange-Traded Fund Trust | 1.25% | 27,079 SH | 23 ตุลาคม 2026 | รายวัน |
| FIDU · FIDELITY COVINGTON TRUST | 1.07% | 73,592 NS | 31 กรกฎาคม 2026 | N-PORT |
| NFRA · FlexShares Trust | 1.04% | 93,021 NS | 31 กรกฎาคม 2026 | N-PORT |
| SPLV · Invesco Exchange-Traded Fund Trust … | 0.99% | 215,662 SH | 23 ตุลาคม 2026 | รายวัน |
| DUSL · Direxion Shares ETF Trust | 0.99% | 1,659 NS | 31 กรกฎาคม 2026 | N-PORT |
| VIS · VANGUARD WORLD FUND | 0.95% | 272,634 SH | 19 สิงหาคม 2026 | รายวัน |
| IYJ · iShares Trust | 0.91% | 53,435 SH | 11 กันยายน 2026 | รายวัน |
| DFLV · Dimensional ETF Trust | 0.87% | 176,015 NS | 31 กรกฎาคม 2026 | N-PORT |
| HEQQ · J.P. Morgan Exchange-Traded Fund Tr… | 0.77% | 686 NS | 31 กรกฎาคม 2026 | N-PORT |
| EXI · iShares Trust | 0.74% | 32,315 SH | 11 กันยายน 2026 | รายวัน |
| VOE · VANGUARD INDEX FUNDS | 0.61% | 721,363 SH | 19 สิงหาคม 2026 | รายวัน |
| IMCV · iShares Trust | 0.57% | 20,412 SH | 11 กันยายน 2026 | รายวัน |
| FEUS · FlexShares Trust | 0.54% | 1,815 NS | 31 กรกฎาคม 2026 | N-PORT |
| IMCB · iShares Trust | 0.51% | 26,532 SH | 11 กันยายน 2026 | รายวัน |
| IMCG · iShares Trust | 0.45% | 55,812 SH | 11 กันยายน 2026 | รายวัน |
| XOEF · iShares Trust | 0.41% | 283 SH | 11 กันยายน 2026 | รายวัน |
| DFUV · Dimensional ETF Trust | 0.39% | 180,770 NS | 31 กรกฎาคม 2026 | N-PORT |
| VO · VANGUARD INDEX FUNDS | 0.34% | 2,433,643 SH | 19 สิงหาคม 2026 | รายวัน |
| VYM · VANGUARD WHITEHALL FUNDS | 0.29% | 897,799 SH | 19 สิงหาคม 2026 | รายวัน |
| PWS · Pacer Funds Trust | 0.27% | 195 NS | 31 กรกฎาคม 2026 | N-PORT |
| IWX · iShares Trust | 0.27% | 32,541 SH | 11 กันยายน 2026 | รายวัน |
| VTV · VANGUARD INDEX FUNDS | 0.26% | 2,137,767 SH | 19 สิงหาคม 2026 | รายวัน |
| MNZL · EA Series Trust | 0.26% | 187 NS | 31 กรกฎาคม 2026 | N-PORT |
| IVE · iShares Trust | 0.24% | 373,387 SH | 11 กันยายน 2026 | รายวัน |
| VOOV · VANGUARD ADMIRAL FUNDS | 0.24% | 51,733 SH | 19 สิงหาคม 2026 | รายวัน |
| FXR · First Trust Exchange-Traded AlphaDE… | 0.24% | 5,281 NS | 31 กรกฎาคม 2026 | N-PORT |
| DFVX · Dimensional ETF Trust | 0.23% | 3,674 NS | 31 กรกฎาคม 2026 | N-PORT |
| IUSV · iShares Trust | 0.23% | 196,689 SH | 11 กันยายน 2026 | รายวัน |
| PFIG · Invesco Exchange-Traded Fund Trust … | 0.22% | 295,000 | 23 ตุลาคม 2026 | รายวัน |
| DSI · iShares Trust | 0.21% | 34,292 SH | 11 กันยายน 2026 | รายวัน |
| RSP · Invesco Exchange-Traded Fund Trust | 0.21% | 607,330 SH | 23 ตุลาคม 2026 | รายวัน |
| VONV · VANGUARD SCOTTSDALE FUNDS | 0.20% | 135,793 SH | 19 สิงหาคม 2026 | รายวัน |
| IWD · iShares Trust | 0.20% | 499,858 SH | 11 กันยายน 2026 | รายวัน |
| EUSA · iShares, Inc. | 0.19% | 11,289 SH | 11 กันยายน 2026 | รายวัน |
| SNPE · DBX ETF Trust | 0.19% | 16,321 NS | 31 สิงหาคม 2026 | N-PORT |
| SIZE · iShares Trust | 0.19% | 2,481 SH | 11 กันยายน 2026 | รายวัน |
| MGV · VANGUARD WORLD FUND | 0.17% | 70,585 SH | 19 สิงหาคม 2026 | รายวัน |
| EGLE · Global X Funds | 0.17% | 11 NS | 31 กรกฎาคม 2026 | N-PORT |
| DEUS · DBX ETF Trust | 0.17% | 1,476 NS | 31 สิงหาคม 2026 | N-PORT |
| BSCU · Invesco Exchange-Traded Self-Indexe… | 0.16% | 4,547,000 | 22 ตุลาคม 2026 | รายวัน |
| PRF · Invesco Exchange-Traded Fund Trust | 0.16% | 47,954 SH | 23 ตุลาคม 2026 | รายวัน |
| DXUV · Dimensional ETF Trust | 0.15% | 2,486 NS | 31 กรกฎาคม 2026 | N-PORT |
| CATH · Global X Funds | 0.15% | 5,770 NS | 31 กรกฎาคม 2026 | N-PORT |
| DCOR · Dimensional ETF Trust | 0.14% | 13,675 NS | 31 กรกฎาคม 2026 | N-PORT |
| TOPC · iShares Trust | 0.14% | 138 SH | 11 กันยายน 2026 | รายวัน |
| USCL · iShares Trust | 0.14% | 11,862 SH | 11 กันยายน 2026 | รายวัน |
| DFAU · Dimensional ETF Trust | 0.13% | 48,458 NS | 31 กรกฎาคม 2026 | N-PORT |
| CHRI · Global X Funds | 0.13% | 31 NS | 31 กรกฎาคม 2026 | N-PORT |
| IWL · iShares Trust | 0.13% | 8,717 SH | 11 กันยายน 2026 | รายวัน |
| XVV · iShares Trust | 0.12% | 2,588 SH | 11 กันยายน 2026 | รายวัน |
| XYLG · Global X Funds | 0.12% | 231 NS | 31 กรกฎาคม 2026 | N-PORT |
| XYLD · Global X Funds | 0.12% | 11,609 NS | 31 กรกฎาคม 2026 | N-PORT |
| IUS · Invesco Exchange-Traded Self-Indexe… | 0.12% | 3,571 SH | 23 ตุลาคม 2026 | รายวัน |
| XTR · Global X Funds | 0.12% | 17 NS | 31 กรกฎาคม 2026 | N-PORT |
| ILCV · iShares Trust | 0.12% | 4,875 SH | 11 กันยายน 2026 | รายวัน |
| BBUS · J.P. Morgan Exchange-Traded Fund Tr… | 0.12% | 31,218 NS | 31 กรกฎาคม 2026 | N-PORT |
| QVML · Invesco Exchange-Traded Fund Trust … | 0.12% | 5,924 SH | 23 ตุลาคม 2026 | รายวัน |
| VOTE · TCW ETF Trust | 0.12% | 3,826 NS | 31 กรกฎาคม 2026 | N-PORT |
| PTLC · Pacer Funds Trust | 0.12% | 11,361 NS | 31 กรกฎาคม 2026 | N-PORT |
| APUE · Trust for Professional Managers | 0.12% | 8,429 NS | 31 สิงหาคม 2026 | N-PORT |
| PBP · Invesco Exchange-Traded Fund Trust | 0.12% | 1,347 SH | 23 ตุลาคม 2026 | รายวัน |
| DFAC · Dimensional ETF Trust | 0.12% | 164,692 NS | 31 กรกฎาคม 2026 | N-PORT |
| BKLC · BNY Mellon ETF Trust | 0.11% | 18,740 NS | 31 กรกฎาคม 2026 | N-PORT |
| PBUS · Invesco Exchange-Traded Fund Trust … | 0.11% | 35,743 SH | 23 ตุลาคม 2026 | รายวัน |
| XRMI · Global X Funds | 0.11% | 169 NS | 31 กรกฎาคม 2026 | N-PORT |
| XCLR · Global X Funds | 0.11% | 12 NS | 31 กรกฎาคม 2026 | N-PORT |
| ILCB · iShares Trust | 0.11% | 4,415 SH | 11 กันยายน 2026 | รายวัน |
| IVV · iShares Trust | 0.11% | 2,830,587 SH | 11 กันยายน 2026 | รายวัน |
| DFUS · Dimensional ETF Trust | 0.11% | 68,692 NS | 31 กรกฎาคม 2026 | N-PORT |
| VOO · VANGUARD INDEX FUNDS | 0.11% | 5,834,293 SH | 19 สิงหาคม 2026 | รายวัน |
| VV · VANGUARD INDEX FUNDS | 0.11% | 262,303 SH | 19 สิงหาคม 2026 | รายวัน |
| TOV · EA Series Trust | 0.11% | 869 NS | 31 กรกฎาคม 2026 | N-PORT |
| SPUU · Direxion Shares ETF Trust | 0.11% | 847 NS | 31 กรกฎาคม 2026 | N-PORT |
| QDPL · Pacer Funds Trust | 0.11% | 5,402 NS | 31 กรกฎาคม 2026 | N-PORT |
| VOXP · Advisors Series Trust | 0.10% | 18 NS | 31 กรกฎาคม 2026 | N-PORT |
| IWB · iShares Trust | 0.10% | 156,030 SH | 11 กันยายน 2026 | รายวัน |
| IYY · iShares Trust | 0.10% | 9,610 SH | 11 กันยายน 2026 | รายวัน |
| ILCG · iShares Trust | 0.10% | 9,771 SH | 11 กันยายน 2026 | รายวัน |
| CRBN · iShares Trust | 0.10% | 3,649 SH | 11 กันยายน 2026 | รายวัน |
| VTI · VANGUARD INDEX FUNDS | 0.10% | 7,130,857 SH | 19 สิงหาคม 2026 | รายวัน |
| VONE · VANGUARD SCOTTSDALE FUNDS | 0.10% | 37,168 SH | 19 สิงหาคม 2026 | รายวัน |
| VTHR · VANGUARD SCOTTSDALE FUNDS | 0.10% | 18,941 SH | 19 สิงหาคม 2026 | รายวัน |
| IWV · iShares Trust | 0.10% | 62,061 SH | 11 กันยายน 2026 | รายวัน |
| ITOT · iShares Trust | 0.10% | 292,197 SH | 11 กันยายน 2026 | รายวัน |
| SPXD · DBX ETF Trust | 0.10% | 20 NS | 31 สิงหาคม 2026 | N-PORT |
| PHDG · Invesco Actively Managed Exchange-T… | 0.10% | 175 SH | 23 ตุลาคม 2026 | รายวัน |
| HCMT · Direxion Shares ETF Trust | 0.09% | 1,561 NS | 31 กรกฎาคม 2026 | N-PORT |
| KOKU · DBX ETF Trust | 0.09% | 2,090 NS | 31 สิงหาคม 2026 | N-PORT |
| SPXL · Direxion Shares ETF Trust | 0.09% | 17,560 NS | 31 กรกฎาคม 2026 | N-PORT |
| TOK · iShares Trust | 0.09% | 635 SH | 11 กันยายน 2026 | รายวัน |
| URTH · iShares, Inc. | 0.08% | 20,147 SH | 11 กันยายน 2026 | รายวัน |
| TILT · FlexShares Trust | 0.08% | 5,022 NS | 31 กรกฎาคม 2026 | N-PORT |
| MGC · VANGUARD WORLD FUND | 0.07% | 22,545 SH | 19 สิงหาคม 2026 | รายวัน |
| ACWI · iShares Trust | 0.07% | 70,059 SH | 11 กันยายน 2026 | รายวัน |
| RWL · Invesco Exchange-Traded Fund Trust … | 0.06% | 19,583 SH | 23 ตุลาคม 2026 | รายวัน |
| OMFL · Invesco Exchange-Traded Self-Indexe… | 0.06% | 8,488 SH | 23 ตุลาคม 2026 | รายวัน |
| VT · VANGUARD INTERNATIONAL EQUITY INDEX… | 0.06% | 187,191 SH | 19 สิงหาคม 2026 | รายวัน |
| ACVF · ETF Opportunities Trust | 0.05% | 241 NS | 31 กรกฎาคม 2026 | N-PORT |
| NPFE · Elevation Series Trust | 0.05% | 975 NS | 31 กรกฎาคม 2026 | N-PORT |
| EQAL · Invesco Exchange-Traded Fund Trust … | 0.05% | 1,083 SH | 23 ตุลาคม 2026 | รายวัน |
| FHEQ · Fidelity Greenwood Street Trust | 0.03% | 798 NS | 31 กรกฎาคม 2026 | N-PORT |
| FYEE · Fidelity Greenwood Street Trust | 0.02% | 153 NS | 31 กรกฎาคม 2026 | N-PORT |
| LGDX · Tidal Trust III | 0.02% | 98 NS | 31 กรกฎาคม 2026 | N-PORT |
| FBUF · Fidelity Greenwood Street Trust | 0.02% | 16 NS | 31 กรกฎาคม 2026 | N-PORT |
| BIV · VANGUARD BOND INDEX FUNDS | · | · | 15 กรกฎาคม 2026 | รายวัน |
| BLV · VANGUARD BOND INDEX FUNDS | · | · | 15 กรกฎาคม 2026 | รายวัน |
| BSV · VANGUARD BOND INDEX FUNDS | · | · | 15 กรกฎาคม 2026 | รายวัน |
| BND · VANGUARD BOND INDEX FUNDS | · | · | 15 กรกฎาคม 2026 | รายวัน |
| VCRB · VANGUARD MALVERN FUNDS | · | · | 15 กรกฎาคม 2026 | รายวัน |
| VPLS · VANGUARD MALVERN FUNDS | · | · | 15 กรกฎาคม 2026 | รายวัน |
| VCSH · VANGUARD SCOTTSDALE FUNDS | · | · | 15 กรกฎาคม 2026 | รายวัน |
| VCIT · VANGUARD SCOTTSDALE FUNDS | · | · | 15 กรกฎาคม 2026 | รายวัน |
| VCLT · VANGUARD SCOTTSDALE FUNDS | · | · | 15 กรกฎาคม 2026 | รายวัน |
| VTC · VANGUARD SCOTTSDALE FUNDS | · | · | 30 กรกฎาคม 2026 | รายวัน |
| BNDW · VANGUARD SCOTTSDALE FUNDS | · | · | 30 กรกฎาคม 2026 | รายวัน |
| IFRA · iShares Trust | · | 356,500 SH | 11 กันยายน 2026 | รายวัน |
NSC ความเห็นหลายต่อหลายของนักวิเคราะห์ มุมมองนักวิเคราะห์ทั้งเชิงบวกและเชิงลบ, ราคาเป้าหมาย 12 เดือน, อัพไซด์
ราคาเป้าหมาย 12 เดือน
18 นักวิเคราะห์ · 2026-10-25ราคาเป้าหมายค่าเฉลี่ย $360.28 +6.8%
การเปรียบเทียบกับบริษัทคู่เทียบ (อุตสาหกรรมย่อย GICS) เมตริกสำคัญเทียบกับบริษัทในกลุ่มอุตสาหกรรมเดียวกัน
ตามปีงบประมาณ ราคา ณ ราคาปิดสิ้นสุดปีงบประมาณล่าสุดของแต่ละบริษัท
ข่าวล่าสุด หัวข้อข่าวล่าสุดที่กล่าวถึงบริษัทนี้
ตัวชี้วัดของฉัน รายการเฝ้าดูส่วนตัวของคุณ — แถวที่เลือกจากข้อมูลพื้นฐานฉบับเต็ม
เลือกตัวชี้วัดที่สำคัญสำหรับคุณ — คลิกเครื่องหมาย + ถัดจากแถวใดก็ได้ใน Fundamentals ฉบับเต็มด้านบน
การเลือกของคุณถูกบันทึกและจะติดตามคุณไปในทุกสัญลักษณ์หุ้น