
VMRK Vivmark Residential Common Shares of Beneficial Interest
NYSE · عرض على SEC EDGAR ↗ 10-K/10-Q إبريل 30, 2025VMRK لقطة سريعة للسهم السعر، القيمة السوقية، مكرر الربحية (P/E)، ربحية السهم (EPS)، العائد على حقوق الملكية (ROE)، نسبة الدين إلى حقوق الملكية، نطاق 52 أسبوعًا
VMRK مخطط سعر السهم OHLCV يومي مع مؤشرات فنية — تحريك وتكبير وتخصيص عرضك
تتكيف دقة الشريط مع الفترة المحددة - مرر مؤشر الفأرة فوق الرسم البياني لرؤية الافتتاح/الأعلى/الأدنى/الإغلاق للشريط.
| تاريخ الاستحقاق | تقسيم | النوع |
|---|---|---|
| 12 أكتوبر، 2001 | 2-for-1 | أمامي |
حول Vivmark Residential Common Shares of Beneficial Interest نظرة عامة على الشركة من ويكيبيديا
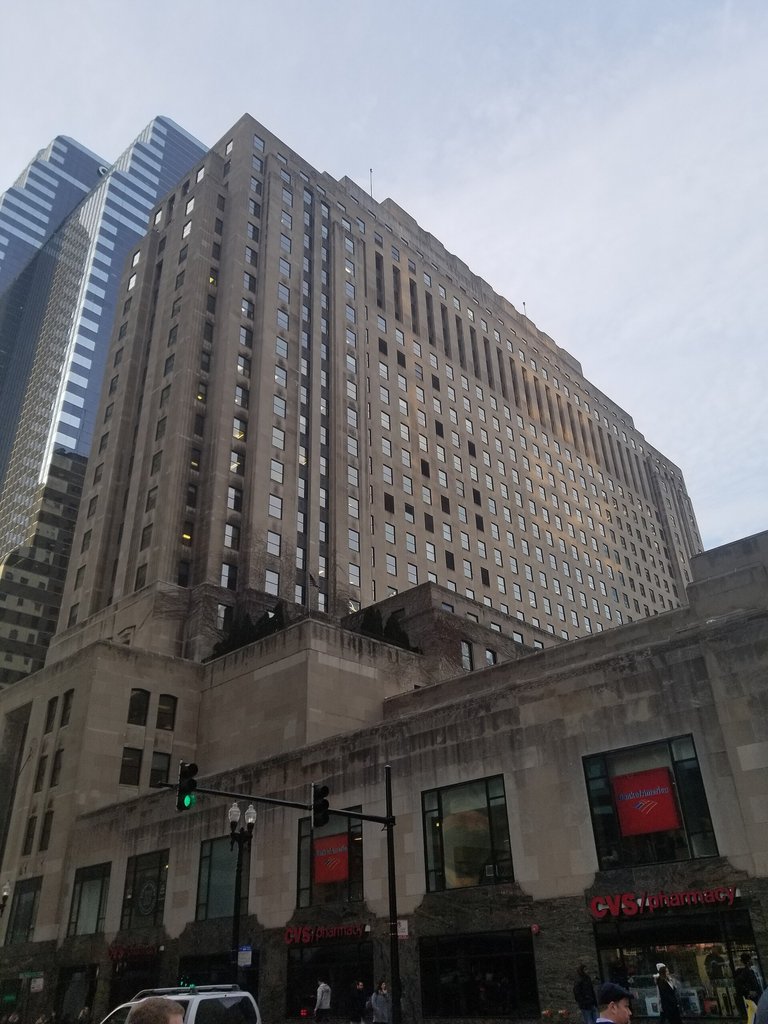
Vivmark Residential (formerly Equity Residential), based in Arlington, Virginia, and Chicago, Illinois, is a real estate investment trust that invests in apartments. As of August 2026, the company owned or had investments in 184,000 rental apartments and had over 11,100 apartments under construction.
It is the largest owner of apartments in the United States and the 18th largest apartment property manager in the United States.
History
The company had its origins in Equity Finance and Management Company, founded in 1969 by Sam Zell. In 1993, the company acquired a large portfolio of properties from Starwood Capital Group, owned by Barry Sternlicht and Bob Faith, in exchange for a 20% stake in the company. Starwood had acquired the properties via government auctions after the savings and loan crisis. In August 1993, the company became a public company via an initial public offering. At that time, the company owned 22,000 apartments.
In 1997, the company acquired Wellsford Residential Property Trust for $620 million in stock and the assumption of $346 million of debt. It also acquired Evans Withycombe Residential for $625 million in stock and the assumption of $432 million in debt.
In 1998, the company acquired a portfolio of 5,774 apartments from Lincoln Property Company for $465 million. It also acquired Merry Land, which owned 34,990 units in the southeast United States, for $1.17 billion in stock as well as $656 million in debt and $270 million in preferred stock.
In 1999, the company acquired Lexford Residential Trust for $203 million in stock and the assumption of $530 million of debt. Lexford owned mainly one-story affordable housing units, rented to households with incomes between $25,000 and $35,000.
In January 2003, CEO Douglas Crocker retired. During his tenure, the company increased its ownership from 22,000 apartments to 227,000 apartments. In 2006, the company sold its Lexford affordable housing division, which included 27,115 apartment units, for $1.09 billion.
In February 2013, the company and AvalonBay Communities closed a $9 billion deal to acquire Archstone from Lehman Brothers. In 2013, the company sold 8,010 apartment units to a joint venture of Goldman Sachs and Greystar Real Estate Partners for $1.5 billion. In 2016, the company sold 23,262 apartments to Starwood Capital Group for $5.365 billion.
In August 2026, the company acquired AvalonBay Communities and changed its name to Vivmark Residential.
Legal issues
In 2022, the company agreed to pay approximately $2 million to settle a lawsuit filed by Attorney General for the District of Columbia Karl Racine alleging that the company offered misleading rent discounts on a rent-controlled building in Washington, D.C.
The company was sued in a class action due to allegations that the late payment fees that it charged, including a $50 minimum fee even if rent was just one day late, and compounding fees and penalties, were in violation of California law. In a settlement finalized in 2026, the company agreed to pay $43 million to over 200,000 tenants in California as reimbursement of excessive fees.
In a multi-district class action lawsuit, the company and 10 other large landlords were accused of engaging in an unlawful conspiracy to use RealPage's revenue management software to share competitively sensitive data and coordinate rent increases. In 2026, as part of a settlement with all of the defendants, the company agreed to pay $56 million to settle the allegations.
المصدر: ويكيبيديا (الإنجليزية), CC BY-SA 4.0 · عرض على ويكيبيديا ↗
أداء 10 سنوات اتجاهات الإيرادات وصافي الدخل والهوامش وربحية السهم
التقييم نسب مكرر الربحية (P/E)، مكرر المبيعات (P/S)، مكرر القيمة الدفترية (P/B)، EV/EBITDA — هل السهم مرتفع السعر أم رخيص؟
لا توجد بيانات أساسية كافية لحساب مجموعة النسب هذه بعد.
الربحية هامش الربح الإجمالي والتشغيلي والصافي؛ العائد على حقوق الملكية (ROE)، العائد على الأصول (ROA)، العائد على رأس المال المستثمر (ROIC)
لا توجد بيانات أساسية كافية لحساب مجموعة النسب هذه بعد.
الصحة المالية الديون، السيولة، الملاءة المالية — قوة الميزانية العمومية
لا توجد بيانات أساسية كافية لحساب مجموعة النسب هذه بعد.
النمو نمو الإيرادات وربحية السهم وصافي الدخل: مقارنة بالعام السابق (YoY)، متوسط النمو السنوي المركب لـ 3 سنوات (3Y CAGR)، متوسط النمو السنوي المركب لـ 5 سنوات (5Y CAGR)
لا توجد بيانات أساسية كافية لحساب مجموعة النسب هذه بعد.
كفاءة رأس المال معدل دوران الأصول، معدل دوران المخزون، معدل دوران المستحقات
لا توجد بيانات أساسية كافية لحساب مجموعة النسب هذه بعد.
القيمة · ≈ متوسط 5 سنوات · متوسط الصناعة · حكم مقارنة بالمتوسط
التوزيعات العائد، نسبة التوزيع، تاريخ توزيع الأرباح، معدل النمو السنوي المركب لمدة 5 سنوات
| تاريخ الاستحقاق | المبلغ | العملة | العائد |
|---|---|---|---|
| أكتوبر 5, 2026 | $0,70 | USD | ≈4.7% |
| يونيو 29, 2026 | $0,70 | USD | ≈4.1% |
| مارس 30, 2026 | $0,70 | USD | ≈4.7% |
| يناير 2, 2026 | $0,69 | USD | ≈4.5% |
| سبتمبر 25, 2025 | $0,69 | USD | ≈4.3% |
| يونيو 24, 2025 | $0,69 | USD | ≈4.1% |
| مارس 31, 2025 | $0,69 | USD | ≈3.8% |
| يناير 2, 2025 | $0,68 | USD | ≈3.9% |
| سبتمبر 24, 2024 | $0,68 | USD | ≈3.6% |
| يوليو 1, 2024 | $0,68 | USD | ≈3.9% |
| مارس 22, 2024 | $0,68 | USD | ≈4.3% |
| ديسمبر 29, 2023 | $0,66 | USD | ≈4.3% |
| سبتمبر 25, 2023 | $0,66 | USD | ≈4.4% |
| يونيو 23, 2023 | $0,66 | USD | ≈4.1% |
| مارس 24, 2023 | $0,66 | USD | ≈4.5% |
| ديسمبر 30, 2022 | $0,63 | USD | ≈4.2% |
| سبتمبر 23, 2022 | $0,63 | USD | ≈3.6% |
| يونيو 24, 2022 | $0,63 | USD | ≈3.4% |
| مارس 25, 2022 | $0,63 | USD | ≈2.7% |
| ديسمبر 31, 2021 | $0,60 | USD | ≈2.7% |
سجل الأرباح ربحية السهم الفعلية مقابل التقديرات، نسبة المفاجأة %، معدل التجاوز، تاريخ الأرباح التالي
| الفترة | تقرير | EPS Actual | EPS المتوقع | المفاجأة |
|---|---|---|---|---|
| 30 يونيو، 2026 | $0.31 | $0.44 | -29.7% | |
| 31 مارس، 2026 | $0.24 | $0.32 | -24.7% | |
| 31 ديسمبر، 2025 | $1.00 | $0.40 | 153.2% | |
| 30 سبتمبر، 2025 | $0.76 | $0.45 | 70.1% |
الأساسيات الكاملة جميع المقاييس حسب السنة — قائمة الدخل، الميزانية العمومية، التدفق النقدي
ليس لدينا إيداعات SEC لهذا الرمز بعد.
لكل سهم
| المقياس | اتجاه | Q4 2025 |
|---|---|---|
| EPS (TTM) | $2.29 |
التقييم (آخر 12 شهرًا)
| المقياس | اتجاه | Q4 2025 |
|---|---|---|
| Revenue TTM | $2.70B | |
| Net Income TTM | $873M |
أحدث فترة على اليسار · القيم الفارغة معروضة كـ ·
المطلعون على الشركة 31 من المطلعين · مسؤولون 15 · مديرون 17
| مطلع | الدور | آخر نشاط | الأسهم المملوكة | مشتريات 12 شهرًا | مبيعات 12 شهرًا | صافي 12 شهرًا |
|---|---|---|---|---|---|---|
| Benjamin Schall | President & CEO | 17 أغسطس، 2026 A | · | 0 | 0 | $0 |
| Kevin P. O'Shea | Executive Vice President & CFO | 17 أغسطس، 2026 A | · | 0 | 0 | $0 |
| Michael L Manelis | Executive Vice President & COO | 17 أغسطس، 2026 A | 44713 | 0 | 1 | $-503226 |
| Sean Thomas Willson | Senior Vice President & CAO | 21 أغسطس، 2026 S | 17988 | 0 | 2 | $-35973 |
| Matthew H. Birenbaum | Executive Vice President & CDO | 20 أغسطس، 2026 G | 272749 | 0 | 0 | $0 |
| Pamela Rogers Thomas | EVP, Portfolio & Asset Mgmt | 17 أغسطس، 2026 A | 85543 | 0 | 0 | $0 |
| Alaine Susan Walsh | EVP, Human Capital & Admin | 17 أغسطس، 2026 A | · | 0 | 0 | $0 |
| Scott Fenster | EVP & General Counsel | 17 أغسطس، 2026 A | · | 0 | 0 | $0 |
| Sean J. Breslin | EVP & CI & GO | 17 أغسطس، 2026 A | · | 0 | 0 | $0 |
| Edward M Schulman | EVP, Legal Affairs | 17 أغسطس، 2026 A | 48776 | 0 | 1 | $-1066893 |
| Ian Kaufman | Chief Accounting Officer | 14 أغسطس، 2026 A | 29657 | 0 | 0 | $0 |
| Christa L Sorenson | Executive Vice President | 10 فبراير، 2020 S | 3939 | 0 | 0 | $0 |
| Bruce C Strohm | EVP & General Counsel | 22 ديسمبر، 2014 M | 2179 | 0 | 0 | $0 |
| Gregory H Smith | Executive Vice President | 8 فبراير، 2006 S | 46064 | 0 | 0 | $0 |
| Edward J Geraghty | Executive Vice President | 19 أغسطس، 2003 S | 78797 | 0 | 0 | $0 |
| Ann Hoff | مدير | 17 أغسطس، 2026 A | 6330 | 0 | 0 | $0 |
| Nina P Jones | مدير | 17 أغسطس، 2026 A | 3404 | 0 | 0 | $0 |
| Christopher B. Howard | مدير | 17 أغسطس، 2026 A | 12730 | 0 | 1 | $-543104 |
| Chris Carr | مدير | 17 أغسطس، 2026 A | 5591 | 0 | 0 | $0 |
| Susan Swanezy | مدير | 17 أغسطس، 2026 A | 28934 | 0 | 1 | $-1001660 |
| Terry S. Brown | مدير | 17 أغسطس، 2026 A | · | 0 | 0 | $0 |
| Conor C Flynn | مدير | 17 أغسطس، 2026 A | · | 0 | 0 | $0 |
| Angela M Aman | مدير | 17 أغسطس، 2026 A | · | 0 | 0 | $0 |
| Stephen E Sterrett | مدير | 17 أغسطس، 2026 A | 20773 | 0 | 0 | $0 |
| David J Neithercut | مدير | 17 أغسطس، 2026 A | · | 0 | 0 | $0 |
| Timothy J Naughton | مدير | 17 أغسطس، 2026 A | 314301 | 0 | 0 | $0 |
| Charles E Mueller JR | مدير | 17 أغسطس، 2026 A | 16084 | 0 | 1 | $-511200 |
| Mary Kay Haben | مدير | 17 أغسطس، 2026 A | 9477 | 0 | 0 | $0 |
| Gerald A Spector | مدير | 28 فبراير، 2013 A | 282191 | 0 | 0 | $0 |
| Stephen O Evans | مدير | 28 فبراير، 2006 A | 7644 | 0 | 0 | $0 |
| Michael N Thompson | مدير | 27 فبراير، 2004 A | 12777 | 0 | 0 | $0 |
المطلعون من إيداعات SEC Form 3/4/5؛ صافي = سوق مفتوح فقط
ملكية صناديق المؤشرات المتداولة محتفظ بها بواسطة 59 صناديق مؤشرات متداولة
الوزن يعكس فقط ممتلكات الأسهم المباشرة (N-PORT)؛ قد تحتفظ الصناديق المضاعفة أو القائمة على المشتقات بتعرض إضافي للمقايضة غير معروض.
| صندوق | الوزن | الوحدات | حتى تاريخ | المصدر |
|---|---|---|---|---|
| REZ · iShares Trust | 8,65% | 1095687 SH | 11 سبتمبر، 2026 | يومي |
| ICF · iShares Trust | 4,77% | 1448479 SH | 11 سبتمبر، 2026 | يومي |
| USRT · iShares Trust | 4,28% | 2912473 SH | 11 سبتمبر، 2026 | يومي |
| IYR · iShares Trust | 3,59% | 2258051 SH | 11 سبتمبر، 2026 | يومي |
| RSPR · Invesco Exchange-Traded Fund Trust | 3,27% | 43465 | 28 أكتوبر، 2026 | يومي |
| REET · iShares Trust | 2,78% | 2075131 SH | 11 سبتمبر، 2026 | يومي |
| ERET · iShares Trust | 2,73% | 5650 SH | 11 سبتمبر، 2026 | يومي |
| SPHD · Invesco Exchange-Traded Fund Trust … | 1,75% | 936925 | 28 أكتوبر، 2026 | يومي |
| PABU · iShares Trust | 1,44% | 554426 SH | 11 سبتمبر، 2026 | يومي |
| IIGD · Invesco Exchange-Traded Self-Indexe… | 1,27% | 326000 | 28 أكتوبر، 2026 | يومي |
| SPLV · Invesco Exchange-Traded Fund Trust … | 0,97% | 1140817 | 28 أكتوبر، 2026 | يومي |
| RDIV · Invesco Exchange-Traded Fund Trust … | 0,57% | 131054 | 28 أكتوبر، 2026 | يومي |
| IWS · iShares Trust | 0,49% | 1136811 SH | 11 سبتمبر، 2026 | يومي |
| IMCV · iShares Trust | 0,40% | 70805 SH | 11 سبتمبر، 2026 | يومي |
| SIZE · iShares Trust | 0,38% | 24910 SH | 11 سبتمبر، 2026 | يومي |
| IWR · iShares Trust | 0,36% | 3117549 SH | 11 سبتمبر، 2026 | يومي |
| IMCB · iShares Trust | 0,33% | 85059 SH | 11 سبتمبر، 2026 | يومي |
| QUAL · iShares Trust | 0,29% | 2111212 SH | 11 سبتمبر، 2026 | يومي |
| IMCG · iShares Trust | 0,27% | 163022 SH | 11 سبتمبر، 2026 | يومي |
| XOEF · iShares Trust | 0,27% | 910 SH | 11 سبتمبر، 2026 | يومي |
| BSCQ · Invesco Exchange-Traded Self-Indexe… | 0,26% | 7556000 | 28 أكتوبر، 2026 | يومي |
| EUSA · iShares, Inc. | 0,21% | 60634 SH | 11 سبتمبر، 2026 | يومي |
| LRGF · iShares Trust | 0,20% | 110832 SH | 11 سبتمبر، 2026 | يومي |
| RSP · Invesco Exchange-Traded Fund Trust | 0,19% | 3,023,753,00 | 28 أكتوبر، 2026 | يومي |
| USXF · iShares Trust | 0,19% | 42519 SH | 11 سبتمبر، 2026 | يومي |
| IVE · iShares Trust | 0,16% | 1209462 SH | 11 سبتمبر، 2026 | يومي |
| IUSV · iShares Trust | 0,15% | 640730 SH | 11 سبتمبر، 2026 | يومي |
| EQAL · Invesco Exchange-Traded Fund Trust … | 0,14% | 18869 | 28 أكتوبر، 2026 | يومي |
| BSCT · Invesco Exchange-Traded Self-Indexe… | 0,14% | 4374000 | 28 أكتوبر، 2026 | يومي |
| PFIG · Invesco Exchange-Traded Fund Trust … | 0,13% | 195000 | 26 أكتوبر، 2026 | يومي |
| IWD · iShares Trust | 0,13% | 1691737 SH | 11 سبتمبر، 2026 | يومي |
| DSI · iShares Trust | 0,13% | 109394 SH | 11 سبتمبر، 2026 | يومي |
| BSCS · Invesco Exchange-Traded Self-Indexe… | 0,11% | 4062000 | 28 أكتوبر، 2026 | يومي |
| PRF · Invesco Exchange-Traded Fund Trust | 0,11% | 171298 | 28 أكتوبر، 2026 | يومي |
| TOPC · iShares Trust | 0,09% | 443 SH | 11 سبتمبر، 2026 | يومي |
| DIVB · iShares Trust | 0,08% | 26534 SH | 11 سبتمبر، 2026 | يومي |
| VLUE · iShares Trust | 0,08% | 124640 SH | 11 سبتمبر، 2026 | يومي |
| ILCV · iShares Trust | 0,08% | 16911 SH | 11 سبتمبر، 2026 | يومي |
| XVV · iShares Trust | 0,08% | 8404 SH | 11 سبتمبر، 2026 | يومي |
| USCL · iShares Trust | 0,08% | 33766 SH | 11 سبتمبر، 2026 | يومي |
| IVV · iShares Trust | 0,07% | 9188154 SH | 11 سبتمبر، 2026 | يومي |
| ILCB · iShares Trust | 0,07% | 13952 SH | 11 سبتمبر، 2026 | يومي |
| IWB · iShares Trust | 0,07% | 525058 SH | 11 سبتمبر، 2026 | يومي |
| QVML · Invesco Exchange-Traded Fund Trust … | 0,07% | 19212 | 28 أكتوبر، 2026 | يومي |
| IWV · iShares Trust | 0,07% | 213841 SH | 11 سبتمبر، 2026 | يومي |
| PBP · Invesco Exchange-Traded Fund Trust | 0,07% | 4315 | 28 أكتوبر، 2026 | يومي |
| PBUS · Invesco Exchange-Traded Fund Trust … | 0,07% | 115308 | 28 أكتوبر، 2026 | يومي |
| IYY · iShares Trust | 0,07% | 30956 SH | 11 سبتمبر، 2026 | يومي |
| ITOT · iShares Trust | 0,06% | 953021 SH | 11 سبتمبر، 2026 | يومي |
| ILCG · iShares Trust | 0,06% | 28911 SH | 11 سبتمبر، 2026 | يومي |
| TOK · iShares Trust | 0,06% | 2101 SH | 11 سبتمبر، 2026 | يومي |
| PHDG · Invesco Actively Managed Exchange-T… | 0,06% | 567 | 28 أكتوبر، 2026 | يومي |
| CRBN · iShares Trust | 0,06% | 10037 SH | 11 سبتمبر، 2026 | يومي |
| URTH · iShares, Inc. | 0,05% | 65129 SH | 11 سبتمبر، 2026 | يومي |
| OMFL · Invesco Exchange-Traded Self-Indexe… | 0,05% | 38095 | 28 أكتوبر، 2026 | يومي |
| ACWI · iShares Trust | 0,05% | 232770 SH | 11 سبتمبر، 2026 | يومي |
| RWL · Invesco Exchange-Traded Fund Trust … | 0,01% | 24358 | 27 أكتوبر، 2026 | يومي |
| GLOF · iShares Trust | 0,01% | 309 SH | 10 سبتمبر، 2026 | يومي |
| GTO · Invesco Actively Managed Exchange-T… | 0,00% | 7000 | 27 أكتوبر، 2026 | يومي |
VMRK توافق الآراء التحليلي آراء المحللين الصعودية والهبوطية، السعر المستهدف لمدة 12 شهرًا، الصعود
السعر المستهدف لمدة 12 شهرًا
20 محللين · 2026-10-29السعر المستهدف المتوسط $71.62 +17,6%
مقارنة الأقران (الصناعة الفرعية GICS) المقاييس الرئيسية مقابل أقران القطاع
أساس السنة المالية، الأسعار كما في إغلاق نهاية السنة المالية الأخيرة لكل شركة.
| الرمز | القيمة السوقية | P/E | الإيرادات سنويًا | هامش الربح الصافي | ROE | هامش الربح الإجمالي |
|---|---|---|---|---|---|---|
| VMRK | · | · | · | · | · | · |
| ESS | $16.86B | 25.2 | 6.4% | 37.2% | 12.7% | 69.9% |
| MAA | $16.24B | 36.7 | 0.83% | 20.2% | 7.7% | · |
| CPT | $11.48B | 31.1 | 81.7% | 2964.9% | 8.5% | · |
| UDR | $12.04B | 32.5 | 2.4% | 22.1% | 11.2% | · |
| IRT | $4.15B | 72.8 | 2.8% | 8.6% | 1.6% | · |
| CSR | $1.12B | 65.4 | 4.9% | 6.2% | 2.3% | · |
| NXRT | $763M | -23.9 | -3.2% | -12.8% | -9.1% | · |
مقاييسي قائمة المراقبة الشخصية الخاصة بك — صفوف مختارة من الأساسيات الكاملة
اختر المقاييس التي تهمك — انقر فوق علامة + بجوار أي صف في الأساسيات الكاملة أعلاه.
يتم حفظ اختيارك ويتبعك عبر جميع الأسهم.