
SNPS Synopsys, Inc. - Common Stock
NASDAQ · Technology · Ver en SEC EDGAR ↗ 10-K/10-Q Ago 26, 2026SNPS Instantánea de la Acción Precio, capitalización bursátil, P/E, BPA, ROE, deuda/capital, rango de 52 semanas
SNPS Gráfico del Precio de la Acción OHLCV diario con indicadores técnicos — desplace, amplíe y personalice su vista
La granularidad de las barras se adapta al período seleccionado; pase el ratón sobre el gráfico para ver la apertura/máximo/mínimo/cierre de una barra.
| Fecha ex-dividendo | División | Tipo |
|---|---|---|
| 24 de septiembre de 2003 | 2-for-1 | Adelante |
| 11 de septiembre de 1995 | 2-for-1 | Adelante |
Acerca de Synopsys, Inc. - Common Stock Descripción general de la empresa de Wikipedia
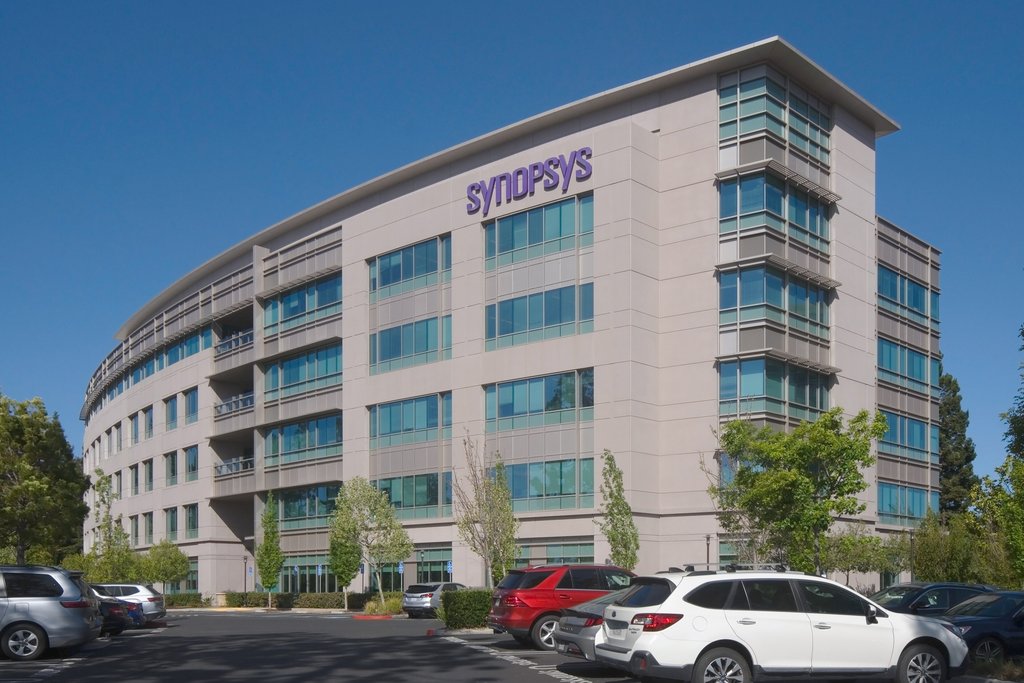
Synopsys Inc. es una compañía estadounidense líder en el desarrollo de software especializado para el diseño de circuitos integrados complejos (en inglés, EDA: Electronic Design Automation). La compañía es proveedora de la industria de semiconductores, computadores, comunicaciones, aeroespacial y empresas de electrónicas.
Fue fundada en 1986 por Dr. Aart J. de Geus y un equipo de ingenieros del Centro de Microelectrónica de General Electric en el Research Triangle Park, Carolina del Norte.
Su casa matriz está en Mountain View, California, Estados Unidos. Cuenta con un total de 11.689 empleados en todo el mundo y presencia en más de 113 ciudades con oficinas de ventas, soporte y R&D en Norteamérica, Europa, Japón, Israel, Asia-Pacífico y Chile.
Durante los últimos 31 años, Synopsys ha pasado de ser una pequeña compañía con un solo producto a una compañía diversificada y líder en herramientas de software para la industria de circuitos integrados y semiconductores entregando todos softwares necesarios para el proceso entero desde la concepción, descripción, a la producción y test de un chip.
Productos
La tecnología de Synopsys permite diseñar y verificar “circuitos integrados complejos” cubriendo el tramo entre el concepto y fabricación de circuitos integrados, mejorando la productividad y aumentando la predictibilidad.
Los productos de Synopsys proveen un completo ambiente de diseño y pruebas de principio a fin, con sistemas de verificación a diferentes niveles, además de servicios profesionales que apoyan el trabajo de sus clientes rápida u acuciosamente.
La plataforma de Synopsys apoya el diseño en prácticamente cada métrica, incluyendo el desempeño, la complejidad, dimensiones, costos, consumos y tiempos.
Synopsys provee diferentes herramientas de software para: La simulación del diseño, la síntesis de lógica, verificación formal de resultados, place & route (colocación y enrutamiento), post procesamiento de los datos para las máquinas de producción, simulaciones de procesos físicos y químicos, extracción de datos eléctricos para el sign-off del chip, test del chip, custom design (diseño personalizado), propiedad intelectual, etc.
Synopsys también es un proveedor líder mundial de propiedad intelectual (IP) ofreciendo bloques listos para sistemas en chip (SoC, del inglés system on a chip).
Synopsys Inc. genera casi la totalidad de sus ingresos de la venta de licencias, mantenciones y servicios profesionales en la industria electrónica y de semiconductores. Los clientes típicamente realizan sus compras a Synopsys de sus presupuestos de investigación y desarrollo (en inglés, research and development), en consecuencia esta estrechamente ligado al desarrollo de nuevos diseños de chips.
Entre sus clientes se encuentran Intel, ST, Sony, Nvidia, Yamaha, Texas Instruments, Renesas, Samsung, Qualcomm, Mediatek, NXP, IBM, Imagination, Fujitsu, Cisco, Broadcom, Bosch, ARM, AMD, Rockchip, Ricoh, TSMC, UMC, Smic, Xylinx, Altera, y muchas otras empresas de la industria electrónica.
La industria de los semiconductores
En 2000 la industria de semiconductores experimento su más escarpado y largo tropiezo de los últimos 20 años. Las ventas de la industria cayeron un 46% del 2000 al 2002 y el 2003 se recuperaron lentamente. En este período los clientes de Synopsys redujeron al máximo sus costos. El 2003 la industria creció un 18% y el 2004 un 29%. Históricamente el crecimiento de la industria de semiconductores ha sido seguido por el crecimiento de R&D en la industria, sin embargo no ha ocurrido de esa manera. Se espera que en el largo plazo se cumpla esta relación entre ambas industrias.
Adquisiciones y fusiones
1994: Adquisición de Cadis, Aachen, Alemania
1997: Adquisición de EPIC Design Technology Inc., EE. UU.
1997: Adquisición de Viewlogic Systems, Inc., EE. UU.
1998: Adquisición de Systems Science, Inc.
6 de junio de 2002: Fusión con Avanti Corporation, EE. UU.
12 de septiembre de 2002: Adquisición de Co-Design Automation, Inc. EE. UU.
20 de septiembre de 2002: Adquisición de inSilicon Inc., EE. UU.
3 de marzo de 2003: Adquisición de Numerical Technologies, Inc. EE. UU.
23 de febrero de 2004: Adquisición de Accelerant Networks, EE. UU.
26 de febrero de 2004: Adquisición de los bienes de Analog Design Automation, Inc., EE. UU.
Octubre de 2004: Adquisición de los bienes de Monterey Design Systems, Inc., EE. UU.
Adquisición de Cascade Semiconductor Solutions Inc., EE. UU.
2 de noviembre de 2004: Adquisición de Integrated Systems Engineering AG (ISE), Suiza
2 de noviembre de 2004: Adquisición de los bienes de LEDA Design, Inc., EE. UU.
2004: Después de la adquisición de Monterey Arset y Leda Design se abre Synopsys Armenia donde trabaja el 8% de los ingenieros de la empresa.
1 de diciembre de 2004: Acuerdo de adquirir Nassda Corp., EE. UU.
7 de diciembre de 2005: Adquisición de HPL Technologies
16 de mayo de 2006: Adquisición de Virtio Corporation
21 de junio de 2006: Apertura del Synopsys R&D Center Chile, Santiago de Chile, Chile
16 de agosto de 2006: Adquisición de Sigma-C, Alemania
18 de junio de 2007: Adquisición de ArchPro Design Automation Inc.
30 de julio de 2007: Compra de ciertos bienes de propiedad intelectual (IP) de semiconductores de MOSAID Technologies
2 de octubre de 2007: Adquisición de Sandwork Design
30 de marzo de 2008: Anuncia adquisición de Synplicity
18 de diciembre de 2008: Adquisición de ChipIT Business Unit de ProDesign Electronic GmbH, Alemania
8 de mayo de 2009: Adquisición de Analog Business Group (Chipidea) de MIPS Technologies
2 de febrero de 2010: Adquisición de VaST Systems Technology Corporation
8 de febrero de 2010: Anuncia adquisición de CoWare Inc.
10 de junio de 2010: Anuncia adquisición de Synfora Inc.
2 de septiembre de 2010: Anuncia adquisición de Virage Logic Corporation
7 de octubre de 2010: Anuncia adquisición de Optical Research Associates
2 de septiembre de 2011: Anuncia adquisición de nSys Design Systems
7 de octubre de 2011: Anuncia adquisición de Extreme DA
15 de febrero de 2012: Completa adquisición de negocio de "mask patterning" de Luminescent Technologies, Inc.
22 de febrero de 2012: Completa adquisición de Magma Design Automation
8 de mayo de 2012: Anuncia adquisición de RSoft Design Group
30 de julio de 2012: Anuncia adquisición de Ciranova
3 de agosto de 2012: Anuncia adquisición de SpringSoft
19 de febrero de 2014: Anuncia adquisición de Coverity
15 de mayo de 2014: Anuncia adquisición de Kalistick
20 de abril de 2015: Anuncia adquisición de Codenomicon
7 de junio de 2015: Anuncia adquisición de Atrenta
10 de junio de 2015: Anuncia adquisición de Virage Logic
== Referencias ==
Fuente: Wikipedia, CC BY-SA 4.0 · Ver en Wikipedia ↗
Rendimiento a 10 años Tendencias de ingresos, beneficio neto, márgenes y BPA
Valoración Ratios P/E, P/S, P/B, EV/EBITDA: ¿está la acción cara o barata?
| Métrica | Tendencia a 5 años | SNPS | promedio 5A | Mediana de Pares | Veredicto |
|---|---|---|---|---|---|
| P/E (TTM) | 75.3promedio 5A ≈53.4 | ≈53.4 | 36.0 | Sobrevalorado | |
| P/S (TTM) | 8.8promedio 5A ≈12.0 | ≈12.0 | 7.7 | Valor razonable | |
| P/C (MRQ) | 2.6promedio 5A ≈8.2 | ≈8.2 | 12.4 | Infravalorado | |
| EV / EBITDA (TTM) | 34.0promedio 5A ≈47.1 | ≈47.1 | 45.1 | Sobrevalorado | |
| Precio / FCF (TTM) | 30.0promedio 5A ≈47.1 | ≈47.1 | · | · | |
| Precio / Flujo de Caja (TTM) | 28.0promedio 5A ≈42.7 | ≈42.7 | 33.8 | Sobrevalorado | |
| EV / Ingresos (TTM) | 9.4promedio 5A ≈12.0 | ≈12.0 | · | · | |
| EV / FCF (TTM) | 32.3promedio 5A ≈47.4 | ≈47.4 | · | · | |
| Precio / Valor Contable Tangible (MRQ) | 4.2promedio 5A ≈25.1 | ≈25.1 | · | · | |
| PEG Ratio (Ratio PEG) | ≈5.6 | · | · | · |
La mediana de empresas comparables se calcula sobre una base estandarizada por métrica y puede no coincidir siempre con la base TTM/MRQ que se muestra para esta acción.
Rentabilidad Márgenes brutos, operativos y netos; ROE, ROA, ROIC
| Métrica | Tendencia a 5 años | SNPS | promedio 5A | Mediana de Pares | Veredicto |
|---|---|---|---|---|---|
| Margen Bruto (TTM) | 72.4%promedio 5A ≈78.9% | ≈78.9% | 81.6% | Débil | |
| Margen Operativo (TTM) | 8.5%promedio 5A ≈19.4% | ≈19.4% | 27.9% | Débil | |
| Margen EBITDA (TTM) | 27.8%promedio 5A ≈25.0% | ≈25.0% | 27.9% | Débil | |
| Margen antes de impuestos (TTM) | 13.8%promedio 5A ≈21.6% | ≈21.6% | 30.6% | Débil | |
| Margen de Beneficio Neto (TTM) | 11.4%promedio 5A ≈22.9% | ≈22.9% | 23.9% | Débil | |
| ROA (TTM) | 2.2%promedio 5A ≈11.2% | ≈11.2% | 10.6% | Débil | |
| ROE (TTM) | 3.7%promedio 5A ≈18.2% | ≈18.2% | 22.6% | Débil | |
| ROIC | 2.1%promedio 5A ≈13.4% | ≈13.4% | 17.8% | Débil |
Salud financiera Deuda, liquidez, solvencia — solidez del balance general
| Métrica | Tendencia a 5 años | SNPS | promedio 5A | Mediana de Pares | Veredicto |
|---|---|---|---|---|---|
| Deuda / Patrimonio (MRQ) | 0.3promedio 5A ≈0.1 | ≈0.1 | 0.4 | Baja deuda | |
| Ratio corriente (MRQ) | 1.3promedio 5A ≈1.5 | ≈1.5 | 1.4 | En línea | |
| Ratio Rápido (MRQ) | 1.0promedio 5A ≈1.1 | ≈1.1 | 0.8 | Liquidez sólida | |
| Deuda a Largo Plazo / Patrimonio (MRQ) | 0.3promedio 5A ≈0.1 | ≈0.1 | 0.3 | Baja deuda |
Crecimiento Crecimiento de ingresos, BPA y beneficio neto: interanual, CAGR a 3 años, CAGR a 5 años
| Métrica | Tendencia a 5 años | SNPS | promedio 5A | Mediana de Pares | Veredicto |
|---|---|---|---|---|---|
| Revenue YoY (Ingresos interanuales) | 15.1%promedio 5A ≈13.9% | ≈13.9% | · | · | |
| Revenue CAGR 3Y (Ingresos CAGR 3A) | 15.2%promedio 5A ≈13.9% | ≈13.9% | · | · | |
| Revenue CAGR 5Y (Ingresos CAGR 5A) | 13.9% | · | · | · | |
| EPS YoY (EPS interanual) | -44.6%promedio 5A ≈21.6% | ≈21.6% | · | · | |
| Net Income YoY (Beneficio Neto interanual) | -41.1%promedio 5A ≈22.4% | ≈22.4% | · | · | |
| EPS CAGR 3Y (CAGR BPA 3A) | 8.5%promedio 5A ≈25.3% | ≈25.3% | · | · | |
| EPS CAGR 5Y (CAGR BPA 5A) | 13.5% | · | · | · | |
| Net Income CAGR 3Y (CAGR Beneficio Neto 3A) | 10.6%promedio 5A ≈25.8% | ≈25.8% | · | · | |
| Net Income CAGR 5Y (CAGR Beneficio Neto 5A) | 14.9% | · | · | · |
Eficiencia de capital Rotación de activos, rotación de inventario, rotación de cuentas por cobrar
| Métrica | Tendencia a 5 años | SNPS | promedio 5A | Mediana de Pares | Veredicto |
|---|---|---|---|---|---|
| Asset Turnover (Rotación de Activos) | 0.2promedio 5A ≈0.5 | ≈0.5 | 0.6 | Débil | |
| Inventory Turnover (Rotación de Inventario) | 4.5promedio 5A ≈4.3 | ≈4.3 | · | · | |
| Receivables Turnover (Rotación de Cuentas por Cobrar) | 5.8promedio 5A ≈6.6 | ≈6.6 | 5.7 | En línea | |
| Revenue / Employee (Ingresos / Empleado) | ≈$251.9K | · | · | · |
valor · ≈ promedio 5A · mediana sectorial · veredicto relativo a la mediana
Historial de Ganancias EPS real vs estimado, sorpresa %, tasa de aciertos, próxima fecha de resultados
| Período | Informe | EPS Actual | EPS est. | Sorpresa |
|---|---|---|---|---|
| 30 de septiembre de 2026 | Ago 26, 2026 | $3.91 | $3.74 | 4.6% |
| 30 de junio de 2026 | May 27, 2026 | $3.35 | $3.22 | 4.1% |
| 31 de marzo de 2026 | $3.77 | $3.63 | 3.9% | |
| 31 de diciembre de 2025 | $2.90 | $2.83 | 2.4% | |
| 30 de septiembre de 2025 | $3.39 | $3.80 | -10.9% | |
| 30 de junio de 2025 | $3.67 | $3.45 | 6.3% |
Fundamentales Completos Todas las métricas por año — estado de resultados, balance general, flujo de caja
Estado de resultados
| Métrica | Tendencia | 2025 | 2024 | 2023 | 2022 | 2021 | 2020 | 2019 | 2018 | 2017 | 2016 | 2015 | 2014 |
|---|---|---|---|---|---|---|---|---|---|---|---|---|---|
| Revenue | $7.05B | $6.13B | $5.32B | $4.62B | $4.20B | $3.69B | $3.36B | $3.12B | $2.72B | $2.42B | $2.24B | $2.06B | |
| Cost of Revenue | $1.62B | $1.25B | $1.03B | $898M | $862M | $795M | $753M | $736M | $654M | $543M | $519M | $457M | |
| Gross Profit | $5.43B | $4.88B | $4.29B | $3.72B | $3.34B | $2.89B | $2.61B | $2.39B | $2.07B | $1.88B | $1.72B | $1.60B | |
| R&D Expense | $2.48B | $2.08B | $1.85B | $1.59B | $1.50B | $1.28B | $1.14B | $1.08B | $909M | $857M | $776M | $719M | |
| SG&A Expense | $770M | $568M | $377M | $314M | $323M | $285M | $229M | $263M | $197M | $166M | $165M | $155M | |
| Operating Expenses | $4.52B | $3.53B | $3.01B | $2.57B | $2.61B | $2.27B | $2.09B | $2.02B | $1.72B | $1.56B | $1.46B | $1.35B | |
| Operating Income | $915M | $1.36B | $1.27B | $1.15B | $735M | $620M | $520M | $360M | $348M | $317M | $266M | $249M | |
| Interest Expense | · | · | $1M | $2M | $3M | $5M | $12M | $16M | $7M | $4M | $3M | $2M | |
| Other Non-op | $-17M | $-21M | $-20M | $11M | $-5M | $-7M | $-1M | $5M | $3M | $8M | $5M | $12M | |
| Pretax Income | $1.39B | $1.51B | $1.31B | $1.10B | $806M | $638M | $546M | $364M | $383M | $330M | $282M | $272M | |
| Income Tax | $56M | $100M | $90M | $139M | $49M | $-25M | $13M | $-69M | $247M | $63M | $56M | $13M | |
| Net Income | $1.33B | $2.26B | $1.23B | $985M | $758M | $664M | $532M | $433M | $137M | $267M | $226M | $259M | |
| EPS (Basic) | $8.13 | $14.78 | $8.08 | $6.44 | $4.96 | $4.40 | $3.55 | $2.90 | $0.91 | $1.76 | $1.46 | $1.67 | |
| EPS (Diluted) | $8.04 | $14.51 | $7.92 | $6.29 | $4.81 | $4.27 | $3.45 | $2.82 | $0.88 | $1.73 | $1.43 | $1.64 | |
| Shares (Basic) | 163,947,000 | 153,138,000 | 152,146,000 | 153,002,000 | 152,698,000 | 151,135,000 | 149,872,000 | 149,036,000 | 150,457,000 | 152,017,000 | 154,957,000 | 155,054,000 | |
| Shares (Diluted) | 165,656,000 | 155,944,000 | 155,195,000 | 156,485,000 | 157,340,000 | 155,706,000 | 154,190,000 | 153,393,000 | 154,874,000 | 154,721,000 | 158,065,000 | 157,710,000 | |
| EBITDA | $1.58B | $1.65B | $1.52B | $1.39B | $938M | $830M | $722M | $569M | $537M | $524M | $478M | $442M |
Balance general
| Métrica | Tendencia | 2025 | 2024 | 2023 | 2022 | 2021 | 2020 | 2019 | 2018 | 2017 | 2016 | 2015 | 2014 |
|---|---|---|---|---|---|---|---|---|---|---|---|---|---|
| Cash & Equivalents | $2.89B | $3.90B | $1.43B | $1.42B | $1.43B | $1.24B | $729M | $723M | $1.05B | $977M | $836M | $986M | |
| Short-term Investments | $73M | $154M | $152M | $148M | $148M | $0 | · | · | $0 | $141M | $129M | $0 | |
| Receivables | $1.51B | $934M | $857M | $796M | $569M | $781M | $554M | $554M | $451M | $439M | $386M | $327M | |
| Inventory | $365M | $362M | $326M | $212M | $229M | $192M | $142M | $122M | $62M | · | · | · | |
| Prepaid Expense | $1.18B | $1.12B | $548M | $439M | $430M | $308M | $290M | $68M | $73M | $105M | $71M | $54M | |
| Current Assets | $6.01B | $6.47B | $3.43B | $3.01B | $2.81B | $2.55B | $1.74B | $1.54B | $1.68B | $1.72B | $1.47B | $1.50B | |
| PP&E (Net) | $697M | $563M | $550M | $483M | $472M | $484M | $430M | $309M | $266M | $257M | $263M | $249M | |
| PP&E (Gross) | $1.66B | $1.49B | $1.47B | $1.35B | $1.28B | $1.25B | $1.11B | $936M | $838M | $763M | $717M | $687M | |
| Accum. Depreciation | $965M | $930M | $923M | $866M | $804M | $770M | $683M | $627M | $572M | $506M | $454M | $438M | |
| Goodwill | $26.90B | $3.45B | $3.35B | $3.12B | $3.58B | $3.37B | $3.17B | $3.14B | $2.71B | $2.52B | $2.47B | $2.26B | |
| Intangibles | $12.68B | $195M | $240M | $386M | $279M | $254M | $279M | $360M | $254M | $267M | $364M | $365M | |
| Other Non-current Assets | $1.12B | $584M | $445M | $464M | $511M | $414M | $381M | $247M | $223M | $186M | $186M | $175M | |
| Total Assets | $48.22B | $13.07B | $10.33B | $9.42B | $8.75B | $8.03B | $6.41B | $6.15B | $5.40B | $5.24B | $5.05B | $4.78B | |
| Accounts Payable | $165M | $207M | $155M | $38M | $27M | $30M | $20M | $85M | $20M | $14M | $10M | $28M | |
| Short-term Debt | · | · | · | · | $75M | $27M | $18M | · | · | · | · | · | |
| Current Liabilities | $3.72B | $2.65B | $2.99B | $2.77B | $2.41B | $2.14B | $1.75B | $2.10B | $1.61B | $1.71B | $1.58B | $1.39B | |
| Capital Leases | $681M | $574M | $580M | $581M | $487M | $462M | $0 | · | · | · | · | · | |
| Deferred Tax | $1.00B | $37M | · | · | · | · | · | · | · | · | · | · | |
| Other Non-current Liabilities | $1.65B | $470M | $382M | $328M | $391M | $285M | $324M | $266M | $252M | $211M | $202M | $159M | |
| Total Liabilities | $19.90B | $4.05B | $4.15B | $3.86B | $3.45B | $3.12B | $2.32B | $2.66B | $2.12B | $2.05B | $1.91B | $1.72B | |
| Long-term Debt | $13.48B | $16M | · | · | · | · | · | · | · | · | · | · | |
| Total Debt | $13.48B | $16M | $18M | $21M | $25M | $101M | $120M | $126M | $134M | · | $0 | $45M | |
| Common Stock | $2M | $2M | $2M | $2M | $2M | $2M | $2M | $1M | $2M | $2M | $2M | $2M | |
| Paid-in Capital | $18.64B | $1.21B | $1.28B | $1.49B | $1.58B | $1.65B | $1.64B | $1.64B | $1.62B | $1.64B | $1.61B | $1.61B | |
| Retained Earnings | $10.32B | $8.98B | $6.74B | $5.53B | $4.55B | $3.80B | $3.16B | $2.54B | $2.14B | $1.95B | $1.73B | $1.55B | |
| Treasury Stock | $398M | $1.03B | $1.68B | $1.27B | $783M | $489M | $626M | $598M | $426M | $294M | $98M | $49M | |
| AOCI | $-232M | $-180M | $-196M | $-234M | $-50M | $-54M | $-92M | $-113M | $-66M | $-105M | $-105M | $-62M | |
| Stockholders' Equity | $28.33B | $8.99B | $6.15B | $5.52B | $5.30B | $4.91B | $4.08B | $3.48B | $3.28B | $3.20B | $3.13B | $3.06B | |
| Liabilities + Equity | $48.22B | $13.07B | $10.33B | $9.42B | $8.75B | $8.03B | $6.41B | $6.15B | $5.40B | $5.24B | $5.05B | $4.78B | |
| Shares Outstanding | 185,994,000 | 154,112,000 | 152,053,000 | 152,375,000 | 153,062,000 | 152,618,000 | 150,331,000 | 149,265,000 | 150,445,000 | 151,454,000 | 155,157,000 | 155,965,000 |
Flujo de Efectivo
| Métrica | Tendencia | 2025 | 2024 | 2023 | 2022 | 2021 | 2020 | 2019 | 2018 | 2017 | 2016 | 2015 | 2014 |
|---|---|---|---|---|---|---|---|---|---|---|---|---|---|
| D&A | $660M | $295M | $247M | $228M | $204M | $210M | $202M | $209M | $189M | $207M | $212M | $193M | |
| Stock-based Comp | $893M | $692M | $563M | $459M | $345M | $249M | $155M | $140M | $108M | $98M | $86M | $79M | |
| Deferred Tax | $-464M | $-376M | $-208M | $-36M | $-129M | $-112M | $-83M | $-210M | $123M | $-14M | $37M | $-14M | |
| Amort. of Intangibles | $193M | $16M | $9M | $12M | $86M | $95M | $104M | $129M | $112M | $133M | $140M | $130M | |
| Restructuring | $0 | $0 | $53M | $11M | $33M | $36M | $47M | $13M | $37M | $10M | $15M | $0 | |
| Other Non-cash | $-904M | $-1.47B | $-126M | $104M | $315M | $-20M | $-6M | $-147M | $77M | $29M | $-66M | $34M | |
| Operating Cash Flow | $1.52B | $1.41B | $1.70B | $1.74B | $1.49B | $991M | $801M | $424M | $632M | $587M | $495M | $551M | |
| CapEx | $169M | $140M | $190M | $137M | $94M | $155M | $198M | $99M | $70M | $67M | $87M | $103M | |
| Investing Cash Flow | $-15.88B | $1.22B | $-482M | $-573M | $-549M | $-360M | $-236M | $-744M | $-189M | · | · | $-497M | |
| Stock Repurchased | $0 | $0 | $1.16B | $1.10B | $753M | $242M | $329M | $400M | $380M | $400M | $260M | $120M | |
| Net Stock Activity | $0 | $0 | $-1.16B | $-1.10B | $-753M | $-242M | $-329M | $-400M | $-380M | $-400M | $-260M | $-120M | |
| Financing Cash Flow | $13.36B | $-181M | $-1.20B | $-1.12B | $-749M | $-141M | $-562M | $5M | $-373M | · | · | $-74M | |
| Net Change in Cash | $-1.01B | $2.46B | $21M | $-15M | $197M | $507M | $6M | $-325M | $70M | $140M | $-150M | $-37M | |
| Free Cash Flow | $1.35B | $1.28B | $1.51B | $1.60B | $1.40B | $837M | $602M | $325M | $564M | $520M | $408M | $448M | |
| Levered FCF | · | · | $1.51B | $1.60B | $1.40B | $831M | $591M | $307M | $562M | $517M | $406M | $446M |
Rentabilidad
| Métrica | Tendencia | 2025 | 2024 | 2023 | 2022 | 2021 | 2020 | 2019 | 2018 | 2017 | 2016 | 2015 | 2014 |
|---|---|---|---|---|---|---|---|---|---|---|---|---|---|
| Gross Margin | 77.0% | 79.7% | 79.1% | 79.1% | 79.5% | 78.4% | 77.6% | 76.4% | 76.0% | 77.6% | 76.9% | 77.8% | |
| Operating Margin | 13.0% | 22.1% | 21.7% | 22.9% | 17.5% | 16.8% | 15.5% | 11.5% | 12.8% | 13.1% | 11.9% | 12.1% | |
| Net Margin | 18.9% | 36.9% | 21.1% | 19.4% | 18.0% | 18.0% | 15.8% | 13.9% | 5.0% | 11.0% | 10.1% | 12.6% | |
| Pretax Margin | 19.8% | 24.7% | 22.3% | 21.9% | 19.2% | 17.3% | 16.2% | 11.7% | 14.1% | 13.6% | 12.6% | 13.2% | |
| EBITDA Margin | 22.3% | 26.9% | 25.9% | 27.4% | 22.3% | 22.5% | 21.5% | 18.2% | 19.7% | 21.6% | 21.3% | 21.5% | |
| ROA | 4.3% | 19.3% | 12.4% | 10.8% | 9.0% | 9.2% | 8.5% | 7.5% | 2.6% | 5.2% | 4.6% | 5.7% | |
| ROE | 7.1% | 29.9% | 21.1% | 18.2% | 14.8% | 14.8% | 14.1% | 12.8% | 4.2% | 8.4% | 7.3% | 8.9% | |
| ROIC | 2.1% | 14.1% | 19.3% | 18.4% | 13.0% | 12.9% | 12.1% | 11.9% | 3.6% | 8.0% | 6.8% | 7.6% |
Liquidez y Solvencia
| Métrica | Tendencia | 2025 | 2024 | 2023 | 2022 | 2021 | 2020 | 2019 | 2018 | 2017 | 2016 | 2015 | 2014 |
|---|---|---|---|---|---|---|---|---|---|---|---|---|---|
| Current Ratio | 1.6 | 2.4 | 1.1 | 1.1 | 1.2 | 1.2 | 1.0 | 0.7 | 1.0 | 1.0 | 1.0 | 1.1 | |
| Quick Ratio | 1.2 | 1.9 | 0.8 | 0.9 | 0.9 | 0.9 | 0.7 | 0.6 | 0.9 | 0.9 | 0.9 | 0.9 | |
| Debt / Equity | 0.5 | 0.0 | 0.0 | 0.0 | 0.0 | 0.0 | 0.0 | 0.0 | 0.0 | · | 0.0 | 0.0 | |
| LT Debt / Equity | 0.5 | 0.0 | 0.0 | 0.0 | 0.0 | 0.0 | 0.0 | 0.0 | 0.0 | · | 0.0 | 0.0 | |
| Interest Coverage | · | · | 1077.5 | 684.4 | 218.4 | 120.7 | 44.6 | 23.1 | 47.6 | 84.2 | 94.7 | 131.2 |
Eficiencia
| Métrica | Tendencia | 2025 | 2024 | 2023 | 2022 | 2021 | 2020 | 2019 | 2018 | 2017 | 2016 | 2015 | 2014 |
|---|---|---|---|---|---|---|---|---|---|---|---|---|---|
| Asset Turnover | 0.2 | 0.5 | 0.6 | 0.6 | 0.5 | 0.5 | 0.5 | 0.5 | 0.5 | 0.5 | 0.5 | 0.5 | |
| Inventory Turnover | 4.5 | 3.6 | 4.5 | 4.8 | 4.1 | 4.8 | 5.7 | 8.0 | · | · | · | · | |
| Receivables Turnover | 5.8 | 6.8 | 6.7 | 7.4 | 6.2 | 5.5 | 6.1 | 6.2 | 6.1 | 5.9 | 6.3 | 7.1 |
Por Acción
| Métrica | Tendencia | 2025 | 2024 | 2023 | 2022 | 2021 | 2020 | 2019 | 2018 | 2017 | 2016 | 2015 | 2014 |
|---|---|---|---|---|---|---|---|---|---|---|---|---|---|
| Book Value / Share | $152.30 | $58.34 | $40.43 | $36.20 | $34.59 | $32.15 | $27.16 | $23.31 | $21.77 | $21.10 | $20.20 | $19.60 | |
| Revenue / Share | $42.58 | $39.29 | $37.65 | $32.47 | $26.72 | $23.67 | $21.80 | $20.35 | $17.59 | $15.66 | $14.19 | $13.05 | |
| Cash Flow / Share | $9.17 | $9.02 | $10.98 | $11.11 | $9.49 | $6.37 | $5.19 | $2.77 | $4.10 | $3.79 | $3.13 | $3.49 | |
| Cash / Share | $15.53 | $25.28 | $9.46 | $9.30 | $9.36 | $8.10 | $4.85 | $4.84 | $6.97 | $6.45 | $5.39 | $6.32 | |
| EPS (TTM) | $8.04 | $14.51 | $7.92 | $6.29 | $4.81 | $4.27 | $3.45 | $2.82 | $0.88 | $1.73 | $1.43 | $1.64 |
Tasas de Crecimiento
| Métrica | Tendencia | 2025 | 2024 | 2023 | 2022 | 2021 | 2020 | 2019 | 2018 | 2017 | 2016 | 2015 | 2014 |
|---|---|---|---|---|---|---|---|---|---|---|---|---|---|
| Revenue YoY | 15.1% | 15.2% | 15.2% | 9.8% | 14.1% | · | · | · | · | · | · | · | |
| Revenue CAGR 3Y | 15.2% | 13.4% | 13.0% | · | · | · | · | · | · | · | · | · | |
| Revenue CAGR 5Y | 13.9% | · | · | · | · | · | · | · | · | · | · | · | |
| EPS YoY | -44.6% | 83.2% | 25.9% | 30.8% | 12.7% | · | · | · | · | · | · | · | |
| EPS CAGR 3Y | 8.5% | 44.5% | 22.9% | · | · | · | · | · | · | · | · | · | |
| EPS CAGR 5Y | 13.5% | · | · | · | · | · | · | · | · | · | · | · | |
| Net Income YoY | -41.1% | 84.0% | 24.9% | 30.0% | 14.0% | · | · | · | · | · | · | · | |
| Net Income CAGR 3Y | 10.6% | 44.0% | 22.8% | · | · | · | · | · | · | · | · | · | |
| Net Income CAGR 5Y | 14.9% | · | · | · | · | · | · | · | · | · | · | · |
Valoración (TTM)
| Métrica | Tendencia | 2025 | 2024 | 2023 | 2022 | 2021 | 2020 | 2019 | 2018 | 2017 | 2016 | 2015 | 2014 |
|---|---|---|---|---|---|---|---|---|---|---|---|---|---|
| Revenue TTM | $7.05B | $6.13B | $5.32B | $4.62B | $4.20B | $3.69B | $3.36B | $3.12B | $2.72B | $2.42B | $2.24B | $2.06B | |
| Net Income TTM | $1.33B | $2.26B | $1.23B | $985M | $758M | $664M | $532M | $433M | $137M | $267M | $226M | $259M | |
| Market Cap | $84.41B | $79.15B | $71.38B | $44.58B | $51.00B | $32.64B | $20.41B | $13.36B | $13.02B | $8.98B | $7.75B | $6.39B | |
| Enterprise Value | $94.93B | $75.12B | $69.81B | $43.03B | $49.44B | $31.50B | $19.80B | $12.77B | $12.10B | · | $6.79B | $5.45B | |
| P/E | 56.4 | 35.4 | 59.3 | 46.5 | 69.3 | 50.1 | 39.3 | 31.7 | 98.3 | 34.3 | 35.0 | 25.0 | |
| P/S | 12.0 | 12.9 | 13.4 | 9.7 | 12.1 | 8.9 | 6.1 | 4.3 | 4.8 | 3.7 | 3.5 | 3.1 | |
| P/B | 3.0 | 8.8 | 11.6 | 8.1 | 9.6 | 6.7 | 5.0 | 3.8 | 4.0 | 2.8 | 2.5 | 2.1 | |
| P / Tangible Book | · | 14.8 | 27.9 | 22.2 | 35.4 | 25.3 | · | · | · | · | · | · | |
| P / Cash Flow | 55.6 | 56.3 | 41.9 | 25.6 | 34.2 | 32.9 | 25.5 | 31.5 | 20.5 | 15.3 | 15.7 | 11.6 | |
| P / FCF | 62.6 | 61.7 | 47.2 | 27.8 | 36.5 | 39.0 | 33.9 | 41.1 | 23.1 | 17.3 | 19.0 | 14.3 | |
| EV / EBITDA | 60.3 | 45.5 | 46.0 | 30.9 | 52.7 | 38.0 | 27.4 | 22.4 | 22.5 | · | 14.2 | 12.3 | |
| EV / FCF | 70.4 | 58.5 | 46.1 | 26.9 | 35.3 | 37.7 | 32.9 | 39.2 | 21.4 | · | 16.6 | 12.2 | |
| EV / Revenue | 13.5 | 12.3 | 13.1 | 9.3 | 11.8 | 8.5 | 5.9 | 4.1 | 4.4 | · | 3.0 | 2.6 | |
| Earnings Yield | 1.8% | 2.8% | 1.7% | 2.1% | 1.4% | 2.0% | 2.5% | 3.1% | 1.0% | 2.9% | 2.9% | 4.0% |
Estado de resultados
| Métrica | Tendencia | Q3 2026 | Q2 2026 | Q1 2026 | Q4 2025 | Q3 2025 | Q2 2025 | Q1 2025 | Q4 2024 | Q3 2024 | Q2 2024 | Q1 2024 | Q4 2023 | Q3 2023 | Q2 2023 | Q1 2023 | Q4 2022 |
|---|---|---|---|---|---|---|---|---|---|---|---|---|---|---|---|---|---|
| Revenue | $2.48B | $2.28B | $2.41B | $2.25B | $1.74B | $1.60B | $1.46B | $1.64B | $1.53B | $1.45B | $1.51B | $1.34B | $1.35B | $1.26B | $1.36B | $818M | |
| Cost of Revenue | $679M | $630M | $637M | $655M | $381M | $318M | $270M | $375M | $291M | $300M | $279M | $238M | $260M | $248M | $284M | $117M | |
| Gross Profit | $1.80B | $1.65B | $1.77B | $1.60B | $1.36B | $1.29B | $1.19B | $1.26B | $1.24B | $1.15B | $1.23B | $1.10B | $1.09B | $1.01B | $1.08B | $701M | |
| R&D Expense | $720M | $700M | $715M | $747M | $625M | $554M | $553M | $555M | $509M | $493M | $526M | $440M | $484M | $460M | $465M | $371M | |
| SG&A Expense | $177M | $172M | $183M | $186M | $281M | $136M | $167M | $172M | $150M | $115M | $131M | $95M | $100M | $85M | $97M | $67M | |
| Operating Expenses | $1.44B | $1.53B | $1.57B | $1.48B | $1.19B | $909M | $934M | $950M | $875M | $822M | $879M | $677M | $794M | $722M | $821M | $497M | |
| Operating Income | $357M | $120M | $203M | $121M | $165M | $376M | $252M | $311M | $360M | $332M | $353M | $425M | $300M | $292M | $256M | $204M | |
| Interest Expense | · | · | · | · | · | · | · | · | · | · | $1M | · | $342.0K | $312.0K | $264.0K | · | |
| Other Non-op | $-850.0K | $7M | $13M | $-296M | $-4M | $-4M | $-5M | $-76M | $44M | $17M | $-5M | $-3M | $-8M | $-4M | $-6M | $9M | |
| Pretax Income | $684M | $19M | $79M | $517M | $189M | $396M | $291M | $323M | $392M | $342M | $457M | $404M | $326M | $297M | $279M | $200M | |
| Income Tax | $138M | $2M | $14M | $68M | $-53M | $47M | $-6M | $62M | $-31M | $45M | $23M | $63M | $-7M | $24M | $11M | $63M | |
| Net Income | $546M | $17M | $65M | $449M | $243M | $345M | $296M | $1.11B | $408M | $292M | $449M | $349M | $336M | $273M | $272M | $154M | |
| EPS (Basic) | $2.85 | $0.09 | $0.34 | $2.48 | $1.51 | $2.23 | $1.91 | $7.26 | $2.66 | $1.91 | $2.95 | $2.30 | $2.21 | $1.79 | $1.78 | $1.00 | |
| EPS (Diluted) | $2.84 | $0.09 | $0.34 | $2.44 | $1.50 | $2.21 | $1.89 | $7.13 | $2.61 | $1.88 | $2.89 | $2.24 | $2.17 | $1.76 | $1.75 | $0.98 | |
| Shares (Basic) | 191,536,000 | 191,464,000 | 189,593,000 | · | 160,174,000 | 154,927,000 | 154,408,000 | · | 153,417,000 | 152,971,000 | 152,311,000 | · | 152,023,000 | 152,187,000 | 152,401,000 | · | |
| Shares (Diluted) | 192,319,000 | 192,144,000 | 190,762,000 | · | 161,682,000 | 156,088,000 | 156,189,000 | · | 156,131,000 | 155,770,000 | 155,334,000 | · | 154,947,000 | 154,730,000 | 155,076,000 | · | |
| EBITDA | $357M | $120M | $654M | · | $165M | $376M | $300M | · | $360M | $332M | $423M | · | $295M | $287M | $313M | · |
Balance general
| Métrica | Tendencia | Q3 2026 | Q2 2026 | Q1 2026 | Q4 2025 | Q3 2025 | Q2 2025 | Q1 2025 | Q4 2024 | Q3 2024 | Q2 2024 | Q1 2024 | Q4 2023 | Q3 2023 | Q2 2023 | Q1 2023 | Q4 2022 |
|---|---|---|---|---|---|---|---|---|---|---|---|---|---|---|---|---|---|
| Cash & Equivalents | $3.61B | $2.41B | $2.13B | $2.89B | $2.53B | $14.12B | $3.65B | $3.90B | $1.84B | $1.50B | $1.12B | · | $1.69B | $1.54B | $1.15B | · | |
| Short-term Investments | $1M | $72M | $74M | $73M | $67M | $145M | $155M | $154M | $154M | $157M | $154M | · | $148M | $151M | $147M | · | |
| Receivables | $1.32B | $1.27B | $1.64B | $1.51B | $1.39B | $1.00B | $893M | $934M | $805M | $835M | $1.06B | · | $667M | $780M | $1.04B | · | |
| Inventory | $479M | $442M | $393M | $365M | $382M | $395M | $415M | $362M | $386M | $378M | $383M | · | $283M | $256M | $221M | · | |
| Prepaid Expense | $1.24B | $1.20B | $1.09B | $1.18B | $1.15B | $1.22B | $1.21B | $1.12B | $915M | $760M | $688M | · | $484M | $429M | $470M | · | |
| Current Assets | $6.64B | $5.44B | $5.37B | $6.01B | $5.60B | $16.88B | $6.32B | $6.47B | $5.13B | $4.65B | $3.41B | · | $3.27B | $3.16B | $3.03B | · | |
| PP&E (Net) | $750M | $715M | $677M | $697M | $700M | $572M | $546M | $563M | $571M | $567M | $567M | · | $536M | $546M | $517M | · | |
| PP&E (Gross) | · | · | · | $1.66B | · | · | · | $1.49B | · | · | · | · | · | · | · | · | |
| Accum. Depreciation | · | · | · | $965M | · | · | · | $930M | · | · | · | · | · | · | · | · | |
| Goodwill | $26.83B | $26.85B | $26.88B | $26.90B | $26.95B | $3.46B | $3.43B | $3.45B | $3.44B | $3.43B | $4.13B | $3.35B | $3.89B | $3.89B | $3.86B | $3.12B | |
| Intangibles | $11.46B | $11.88B | $12.29B | $12.68B | $13.08B | $173M | $181M | $195M | $266M | $277M | $377M | · | $337M | $357M | $361M | · | |
| Other Non-current Assets | $1.25B | $1.20B | $1.19B | $1.12B | $1.12B | $576M | $618M | $584M | $580M | $555M | $569M | · | $506M | $487M | $488M | · | |
| Total Assets | $47.73B | $46.89B | $47.24B | $48.22B | $48.23B | $23.76B | $13.04B | $13.07B | $11.65B | $11.01B | $10.56B | · | $9.92B | $9.79B | $9.57B | · | |
| Accounts Payable | $187M | $179M | $113M | $165M | $133M | $85M | $102M | $207M | $79M | $92M | $77M | · | $67M | $84M | $70M | · | |
| Current Liabilities | $4.97B | $3.79B | $3.94B | $3.72B | $3.44B | $2.41B | $2.36B | $2.65B | $2.53B | $2.51B | $2.64B | · | $2.73B | $2.75B | $2.72B | · | |
| Capital Leases | $667M | $670M | $691M | $681M | $673M | $587M | $552M | $574M | $568M | $543M | $564M | · | $591M | $592M | $604M | · | |
| Deferred Tax | $850M | $878M | $954M | $1.00B | $1.19B | · | · | $37M | · | · | · | · | · | · | · | · | |
| Other Non-current Liabilities | $1.54B | $1.55B | $1.61B | $1.65B | $1.80B | $489M | $496M | $470M | $465M | $447M | $437M | · | $390M | $366M | $365M | · | |
| Total Liabilities | $16.57B | $16.41B | $16.69B | $19.90B | $20.62B | $13.84B | $3.74B | $4.05B | $3.90B | $3.82B | $3.85B | · | $3.92B | $3.92B | $3.89B | · | |
| Long-term Debt | $10.04B | $10.04B | $10.04B | $13.48B | $14.34B | $10.05B | · | $16M | · | · | · | · | · | · | · | · | |
| Total Debt | $10.04B | $10.04B | $10.04B | · | $14.34B | $10.05B | $14M | · | $16M | $17M | $17M | · | $18M | $20M | $21M | · | |
| Common Stock | $2M | $2M | $2M | $2M | $2M | $2M | $2M | $2M | $2M | $2M | $2M | · | $2M | $2M | $2M | · | |
| Paid-in Capital | $20.71B | $20.57B | $20.56B | $18.64B | $18.55B | $1.22B | $1.13B | $1.21B | $1.19B | $1.18B | $1.18B | · | $1.26B | $1.33B | $1.29B | · | |
| Retained Earnings | $10.94B | $10.40B | $10.38B | $10.32B | $9.87B | $9.62B | $9.28B | $8.98B | $7.88B | $7.48B | $7.19B | · | $6.39B | $6.08B | $5.81B | · | |
| Treasury Stock | $193M | $243M | $192M | $398M | $572M | $689M | $861M | $1.03B | $1.19B | $1.32B | $1.54B | · | $1.54B | $1.43B | $1.32B | · | |
| AOCI | $-311M | $-244M | $-204M | $-232M | $-232M | $-240M | $-242M | $-180M | $-180M | $-188M | $-163M | · | $-147M | $-146M | $-142M | · | |
| Stockholders' Equity | $31.15B | $30.48B | $30.55B | $28.33B | $27.61B | $9.92B | $9.30B | $8.99B | $7.71B | $7.15B | $6.67B | · | $5.96B | $5.83B | $5.64B | · | |
| Liabilities + Equity | $47.73B | $46.89B | $47.24B | $48.22B | $48.23B | $23.76B | $13.04B | $13.07B | $11.65B | $11.01B | $10.56B | · | $9.92B | $9.79B | $9.57B | · | |
| Shares Outstanding | 191,605,000 | 191,444,000 | 191,449,000 | 185,994,000 | 185,460,000 | 155,146,000 | 154,618,000 | 154,112,000 | 153,613,000 | 153,204,000 | 152,536,000 | 152,053,000 | 152,125,000 | 152,251,000 | 152,380,000 | 152,375,000 |
Flujo de Efectivo
| Métrica | Tendencia | Q3 2026 | Q2 2026 | Q1 2026 | Q4 2025 | Q3 2025 | Q2 2025 | Q1 2025 | Q4 2024 | Q3 2024 | Q2 2024 | Q1 2024 | Q4 2023 | Q3 2023 | Q2 2023 | Q1 2023 | Q4 2022 |
|---|---|---|---|---|---|---|---|---|---|---|---|---|---|---|---|---|---|
| D&A | $455M | $456M | $451M | $449M | $114M | $49M | $48M | $115M | $56M | $61M | $63M | $67M | $63M | $60M | $57M | $59M | |
| Stock-based Comp | $232M | $222M | $259M | $237M | $268M | $202M | $186M | $152M | $182M | $178M | $181M | $141M | $144M | $143M | $134M | $126M | |
| Amort. of Intangibles | $155M | $155M | $156M | $156M | $29M | $4M | $4M | $4M | $4M | $5M | $4M | $-43M | $14M | $13M | $26M | $-61M | |
| Restructuring | $2M | $116M | $118M | $0 | $0 | $0 | $0 | $0 | $0 | $0 | $0 | $-4M | $22M | $-6M | $41M | $-836.0K | |
| Other Non-cash | · | · | $82M | · | · | · | $-598M | · | · | · | $-780M | · | · | · | $-348M | · | |
| Operating Cash Flow | $813M | $629M | $857M | $640M | $671M | $275M | $-67M | $563M | $455M | $477M | $-88M | $326M | $560M | $703M | $115M | $394M | |
| CapEx | $67M | $54M | $35M | $35M | $39M | $56M | $41M | $21M | $40M | $38M | $40M | $53M | $45M | $48M | $44M | $34M | |
| Investing Cash Flow | $443M | $-53M | $-37M | $564M | $-16.50B | $76M | $-22M | $1.44B | $-54M | $-112M | $-54M | $-301M | $-54M | $-91M | $-36M | $-41M | |
| Stock Issued | $8M | $103M | $13M | · | $20M | $104M | $14M | · | · | · | · | · | · | · | · | · | |
| Stock Repurchased | $38M | · | · | $0 | $0 | · | · | $0 | $0 | $0 | $0 | $300M | $300M | $300M | $261M | $383M | |
| Net Stock Activity | · | · | $13M | · | · | · | · | · | · | · | $0 | · | · | · | $-261M | · | |
| Financing Cash Flow | $-38M | $-281M | $-1.58B | $-836M | $4.24B | $10.10B | $-142M | $30M | $-57M | $33M | $-187M | $-254M | $-351M | $-214M | $-377M | $-291M | |
| Net Change in Cash | $1.19B | $282M | $-759M | $362M | $-11.59B | $10.47B | $-241M | $2.04B | $348M | $390M | $-320M | $-247M | $142M | $389M | $-263M | $34M | |
| Free Cash Flow | · | · | $822M | · | · | · | $-108M | · | · | · | $-128M | · | · | · | $71M | · | |
| Levered FCF | · | · | · | · | · | · | · | · | · | · | $-129M | · | · | · | $71M | · |
Rentabilidad
| Métrica | Tendencia | Q3 2026 | Q2 2026 | Q1 2026 | Q4 2025 | Q3 2025 | Q2 2025 | Q1 2025 | Q4 2024 | Q3 2024 | Q2 2024 | Q1 2024 | Q4 2023 | Q3 2023 | Q2 2023 | Q1 2023 | Q4 2022 |
|---|---|---|---|---|---|---|---|---|---|---|---|---|---|---|---|---|---|
| Gross Margin | 72.6% | 72.3% | 73.5% | · | 78.1% | 80.2% | 81.5% | · | 81.0% | 79.3% | 80.0% | · | 79.3% | 78.6% | 79.1% | · | |
| Operating Margin | 14.4% | 5.3% | 8.4% | · | 9.5% | 23.5% | 17.3% | · | 23.6% | 22.8% | 21.8% | · | 19.9% | 20.6% | 18.8% | · | |
| Net Margin | 22.0% | 0.75% | 2.7% | · | 13.9% | 21.5% | 20.3% | · | 26.7% | 20.1% | 27.2% | · | 22.6% | 19.6% | 20.0% | · | |
| Pretax Margin | 27.6% | 0.85% | 3.3% | · | 10.9% | 24.7% | 20.0% | · | 25.7% | 23.5% | 28.2% | · | 21.6% | 20.9% | 20.5% | · | |
| EBITDA Margin | 14.4% | 5.3% | 27.1% | · | 9.5% | 23.5% | 20.6% | · | 23.6% | 22.8% | 25.6% | · | 19.9% | 20.6% | 23.0% | · | |
| ROA | 1.1% | 0.05% | 0.22% | · | 0.81% | 2.0% | 2.5% | · | 3.8% | 2.8% | 4.5% | · | 3.5% | 2.9% | 2.9% | · | |
| ROE | 1.9% | 0.08% | 0.33% | · | 1.4% | 4.0% | 3.7% | · | 6.0% | 4.5% | 7.3% | · | 5.8% | 4.8% | 4.9% | · | |
| ROIC | 0.69% | 0.26% | 0.41% | · | 0.50% | 1.7% | 2.8% | · | 5.0% | 4.0% | 5.2% | · | 5.1% | 4.5% | 4.3% | · |
Liquidez y Solvencia
| Métrica | Tendencia | Q3 2026 | Q2 2026 | Q1 2026 | Q4 2025 | Q3 2025 | Q2 2025 | Q1 2025 | Q4 2024 | Q3 2024 | Q2 2024 | Q1 2024 | Q4 2023 | Q3 2023 | Q2 2023 | Q1 2023 | Q4 2022 |
|---|---|---|---|---|---|---|---|---|---|---|---|---|---|---|---|---|---|
| Current Ratio | 1.3 | 1.4 | 1.4 | · | 1.6 | 7.0 | 2.7 | · | 2.0 | 1.9 | 1.3 | · | 1.2 | 1.1 | 1.1 | · | |
| Quick Ratio | 1.0 | 1.0 | 1.0 | · | 1.2 | 6.3 | 2.0 | · | 1.1 | 1.0 | 0.9 | · | 0.9 | 0.9 | 0.9 | · | |
| Debt / Equity | 0.3 | 0.3 | 0.3 | · | 0.5 | 1.0 | 0.0 | · | 0.0 | 0.0 | 0.0 | · | 0.0 | 0.0 | 0.0 | · | |
| LT Debt / Equity | 0.3 | 0.3 | 0.3 | · | 0.5 | 1.0 | 0.0 | · | 0.0 | 0.0 | 0.0 | · | 0.0 | 0.0 | 0.0 | · | |
| Interest Coverage | · | · | · | · | · | · | · | · | · | · | 271.6 | · | 864.0 | 920.9 | 969.4 | · |
Eficiencia
| Métrica | Tendencia | Q3 2026 | Q2 2026 | Q1 2026 | Q4 2025 | Q3 2025 | Q2 2025 | Q1 2025 | Q4 2024 | Q3 2024 | Q2 2024 | Q1 2024 | Q4 2023 | Q3 2023 | Q2 2023 | Q1 2023 | Q4 2022 |
|---|---|---|---|---|---|---|---|---|---|---|---|---|---|---|---|---|---|
| Asset Turnover | 0.1 | 0.1 | 0.1 | · | 0.1 | 0.1 | 0.1 | · | 0.1 | 0.1 | 0.2 | · | 0.2 | 0.1 | 0.1 | · | |
| Inventory Turnover | 1.6 | 1.5 | 1.6 | · | 1.0 | 0.8 | 0.7 | · | 0.9 | 0.9 | 1.1 | · | 1.2 | 1.3 | 1.3 | · | |
| Receivables Turnover | 1.8 | 2.0 | 1.9 | · | 1.6 | 1.7 | 1.5 | · | 2.1 | 1.8 | 1.6 | · | 2.2 | 1.9 | 1.3 | · |
Por Acción
| Métrica | Tendencia | Q3 2026 | Q2 2026 | Q1 2026 | Q4 2025 | Q3 2025 | Q2 2025 | Q1 2025 | Q4 2024 | Q3 2024 | Q2 2024 | Q1 2024 | Q4 2023 | Q3 2023 | Q2 2023 | Q1 2023 | Q4 2022 |
|---|---|---|---|---|---|---|---|---|---|---|---|---|---|---|---|---|---|
| Book Value / Share | $162.59 | $159.20 | $159.57 | · | $148.90 | $63.91 | $60.18 | · | $50.19 | $46.69 | $43.73 | · | $39.17 | $38.30 | $36.99 | · | |
| Revenue / Share | $12.88 | $11.85 | $12.63 | · | $10.76 | $10.28 | $9.32 | · | $9.77 | $9.34 | $10.62 | · | $9.60 | $9.01 | $8.78 | · | |
| Cash Flow / Share | · | · | $4.49 | · | · | · | $-0.43 | · | · | · | $-0.57 | · | · | · | $0.74 | · | |
| Cash / Share | $18.82 | $12.60 | $11.12 | · | $13.62 | $91.01 | $23.63 | · | $11.98 | $9.81 | $7.34 | · | $11.08 | $10.14 | $7.58 | · | |
| EPS (TTM) | $5.71 | $4.37 | $6.49 | · | $12.73 | $13.84 | $13.51 | · | $9.62 | $9.18 | $9.06 | · | $6.66 | $5.92 | $6.05 | · |
Valoración (TTM)
| Métrica | Tendencia | Q3 2026 | Q2 2026 | Q1 2026 | Q4 2025 | Q3 2025 | Q2 2025 | Q1 2025 | Q4 2024 | Q3 2024 | Q2 2024 | Q1 2024 | Q4 2023 | Q3 2023 | Q2 2023 | Q1 2023 | Q4 2022 |
|---|---|---|---|---|---|---|---|---|---|---|---|---|---|---|---|---|---|
| Revenue TTM | $9.42B | $8.68B | $8.01B | · | $6.44B | $6.22B | $6.07B | · | $5.83B | $5.66B | $5.47B | · | $4.80B | $4.69B | $4.71B | · | |
| Net Income TTM | $1.08B | $773M | $1.10B | · | $2.00B | $2.16B | $2.11B | · | $1.50B | $1.43B | $1.41B | · | $1.03B | $921M | $942M | · | |
| Market Cap | $74.49B | $92.39B | $89.82B | · | $117.48B | $71.21B | $81.25B | · | $85.77B | $81.29B | $81.36B | · | $68.73B | $56.53B | $53.90B | · | |
| Enterprise Value | $80.92B | $99.94B | $97.66B | · | $129.23B | $67.00B | $77.45B | · | $83.79B | $79.65B | $80.10B | · | $66.91B | $54.86B | $52.62B | · | |
| P/E | 68.1 | 110.4 | 72.3 | · | 49.8 | 33.2 | 38.9 | · | 58.0 | 57.8 | 58.9 | · | 67.8 | 62.7 | 58.5 | · | |
| P/S | 7.9 | 10.6 | 11.2 | · | 18.3 | 11.4 | 13.4 | · | 14.7 | 14.4 | 14.9 | · | 14.3 | 12.1 | 11.5 | · | |
| P/B | 2.4 | 3.0 | 2.9 | · | 4.3 | 7.2 | 8.7 | · | 11.1 | 11.4 | 12.2 | · | 11.5 | 9.7 | 9.6 | · | |
| P / Tangible Book | · | · | · | · | · | 11.3 | 14.3 | · | 21.4 | 23.6 | 37.6 | · | 39.6 | 35.6 | 38.2 | · | |
| P / Cash Flow | · | · | 104.8 | · | · | · | -1204.5 | · | · | · | -926.7 | · | · | · | 469.8 | · | |
| EV / Revenue | 8.6 | 11.5 | 12.2 | · | 20.1 | 10.8 | 12.8 | · | 14.4 | 14.1 | 14.6 | · | 13.9 | 11.7 | 11.2 | · | |
| Earnings Yield | 1.5% | 0.91% | 1.4% | · | 2.0% | 3.0% | 2.6% | · | 1.7% | 1.7% | 1.7% | · | 1.5% | 1.6% | 1.7% | · |
Período más reciente a la izquierda · valores nulos mostrados como ·
Estados Financieros Estado de resultados, balance general, flujo de caja — anual, últimos 5 años
| Métrica | 2025-10-31 | 2024-10-31 | 2023-10-31 | 2022-10-31 | 2021-10-31 |
|---|---|---|---|---|---|
| Ingresos | $7.05B | $6.13B | $5.32B | $4.62B | $4.20B |
| Margen Bruto % | 77.0% | 79.7% | 79.1% | 79.1% | 79.5% |
| Margen Operativo % | 13.0% | 22.1% | 21.7% | 22.9% | 17.5% |
| Beneficio neto | $1.33B | $2.26B | $1.23B | $985M | $758M |
| EPS Diluido | $8.04 | $14.51 | $7.92 | $6.29 | $4.81 |
| Métrica | 2025-10-31 | 2024-10-31 | 2023-10-31 | 2022-10-31 | 2021-10-31 |
|---|---|---|---|---|---|
| Deuda / Patrimonio | 0.5 | 0.0 | 0.0 | 0.0 | 0.0 |
| Ratio corriente | 1.6 | 2.4 | 1.1 | 1.1 | 1.2 |
| Ratio Rápido | 1.2 | 1.9 | 0.8 | 0.9 | 0.9 |
| Métrica | 2025-10-31 | 2024-10-31 | 2023-10-31 | 2022-10-31 | 2021-10-31 |
|---|---|---|---|---|---|
| Flujo de caja libre | $1.35B | $1.28B | $1.51B | $1.60B | $1.40B |
Propietarios institucionales (13F) 1 591 declarantes · $87.5B total · A fecha de 30 de septiembre de 2026
Instituciones que informan tener esta acción en su Formulario 13F trimestral de la SEC. Solo posiciones largas; un solo presentador puede aparecer dos veces para tramos de opciones separados. Las patas de put/call de compensación grandes suelen reflejar la creación de mercado o el inventario cubierto, no la convicción direccional.
| Nuevas posiciones | Posiciones cerradas | Aumentado | Disminuido | Cambio neto de acciones |
|---|---|---|---|---|
| 200 (-17 vs trimestre anterior) | 133 (-29 vs trimestre anterior) | 592 (+8 vs trimestre anterior) | 522 (+21 vs trimestre anterior) | +8.1M |
Comparado con Q1 2026. Las presentaciones del Formulario 13F de la SEC vencen dentro de los 45 días posteriores al final del trimestre, más un pequeño margen para los presentadores tardíos; los trimestres que aún se encuentran dentro de esa ventana se omiten en favor del par más reciente completamente reportado.
| Institución | Valor | Acciones | % de 13F rastreadas | Tipo |
|---|---|---|---|---|
| VANGUARD GROUP INC | $8 673 314 979 | 18 464 862 | 9,91% | Acciones |
| BlackRock, Inc. | $7 228 099 176 | 16 203 958 | 8,26% | Acciones |
| VANGUARD CAPITAL MANAGEMENT LLC | $5 579 006 412 | 12 507 020 | 6,37% | Acciones |
| STATE STREET CORP | $4 047 582 529 | 9 073 873 | 4,62% | Acciones |
| Invesco Ltd. | $2 689 268 592 | 6 028 804 | 3,07% | Acciones |
| FMR LLC | $2 671 863 296 | 5 989 785 | 3,05% | Acciones |
| NVIDIA CORP | $2 150 823 302 | 4 821 717 | 2,46% | Acciones |
| GEODE CAPITAL MANAGEMENT, LLC | $2 006 131 665 | 4 510 929 | 2,29% | Acciones |
| VANGUARD PORTFOLIO MANAGEMENT LLC | $2 004 407 070 | 4 493 481 | 2,29% | Acciones |
| MORGAN STANLEY | $1 681 063 746 | 3 768 607 | 1,92% | Acciones |
| VAN ECK ASSOCIATES CORP | $1 542 175 062 | 3 457 249 | 1,76% | Acciones |
| VICTORY CAPITAL MANAGEMENT INC | $1 275 918 734 | 2 860 290 | 1,46% | Acciones |
| GOLDMAN SACHS GROUP INC | $1 220 872 812 | 2 736 953 | 1,39% | Acciones |
| Assenagon Asset Management S.A. | $1 187 380 981 | 2 729 988 | 1,36% | Acciones |
| UBS Group AG | $1 070 348 534 | 2 399 508 | 1,22% | Acciones |
| Capital Research Global Investors | $1 016 990 376 | 2 279 877 | 1,16% | Acciones |
| AMERIPRISE FINANCIAL INC | $948 002 804 | 2 125 136 | 1,08% | Acciones |
| BARCLAYS PLC | $937 482 122 | 2 101 648 | 1,07% | Acciones |
| UBS AM, a distinct business unit of UBS ASSET MANAGEMENT AMERICAS LLC | $870 120 161 | 2 194 613 | 0,99% | Acciones |
| NORTHERN TRUST CORP | $810 738 916 | 1 817 515 | 0,93% | Acciones |
| Amundi | $779 864 609 | 1 748 301 | 0,89% | Acciones |
| Aristotle Capital Management, LLC | $775 023 654 | 1 737 376 | 0,89% | Acciones |
| Mitsubishi UFJ Asset Management Co., Ltd. | $747 400 099 | 1 675 522 | 0,85% | Acciones |
| NORGES BANK | $716 608 333 | 1 606 493 | 0,82% | Acciones |
| Bank of New York Mellon Corp | $692 073 519 | 1 551 492 | 0,79% | Acciones |
| AQR CAPITAL MANAGEMENT LLC | $672 493 388 | 1 507 732 | 0,77% | Acciones |
| CHARLES SCHWAB INVESTMENT MANAGEMENT INC | $665 567 665 | 1 492 070 | 0,76% | Acciones |
| FRANKLIN RESOURCES INC | $656 691 969 | 1 472 172 | 0,75% | Acciones |
| FIL Ltd | $592 847 103 | 1 329 045 | 0,68% | Acciones |
| ALKEON CAPITAL MANAGEMENT LLC | $566 931 774 | 1 270 948 | 0,65% | Acciones |
| AMERICAN CENTURY COMPANIES INC | $558 089 775 | 1 251 126 | 0,64% | Acciones |
| PARNASSUS INVESTMENTS, LLC | $552 277 678 | 1 269 779 | 0,63% | Acciones |
| EDGEWOOD MANAGEMENT LLC | $547 757 901 | 1 227 964 | 0,63% | Acciones |
| BANK OF AMERICA CORP /DE/ | $539 985 556 | 1 210 540 | 0,62% | Acciones |
| JPMORGAN CHASE & CO | $511 386 549 | 1 143 375 | 0,58% | Acciones |
| Legal & General Group Plc | $491 922 869 | 1 102 793 | 0,56% | Acciones |
| VANGUARD FIDUCIARY TRUST CO | $479 519 005 | 1 074 986 | 0,55% | Acciones |
| Grantham, Mayo, Van Otterloo & Co. LLC | $428 989 563 | 961 706 | 0,49% | Acciones |
| PRIMECAP MANAGEMENT CO/CA/ | $399 388 777 | 895 350 | 0,46% | Acciones |
| FIRST MANHATTAN CO. LLC. | $383 239 751 | 859 147 | 0,44% | Acciones |
| DEUTSCHE BANK AG\ | $372 242 740 | 834 494 | 0,43% | Acciones |
| FARALLON CAPITAL MANAGEMENT, L.L.C. | $370 059 672 | 829 600 | 0,42% | Acciones |
| Clearbridge Investments, LLC | $365 387 985 | 819 127 | 0,42% | Acciones |
| W1M Asset Management Ltd | $364 115 964 | 816 669 | 0,42% | Acciones |
| JANE STREET GROUP, LLC | $360 905 869 | 809 079 | 0,41% | Acciones |
| UBS Group AG | $353 078 679 | 791 532 | 0,40% | Opción de compra |
| SUSQUEHANNA INTERNATIONAL GROUP, LLP | $352 484 514 | 790 200 | 0,40% | Opción de compra |
| Sumitomo Mitsui Trust Group, Inc. | $352 279 322 | 789 740 | 0,40% | Acciones |
| Sustainable Growth Advisers, LP | $337 754 832 | 776 555 | 0,39% | Acciones |
| SUSQUEHANNA INTERNATIONAL GROUP, LLP | $325 051 209 | 728 700 | 0,37% | Opción de venta |
Activistas y propietarios del %+ 5 11 tenencias
Inversores que presentaron el Anexo 13D de la SEC — propiedad beneficiosa superior al % 5 con la intención de influir en el emisor (participaciones activistas, campañas de la junta directiva, M&A). Cada fila muestra el estado conocido más reciente de la posición de ese declarante.
| Declarante | Presentado | Participación | Estado | Propósito | Presentación |
|---|---|---|---|---|---|
| Synopsys, Inc. ×5 presentaciones | 31 de marzo de 2008 | · | Presentación inicial | M&A / venta | SEC |
| Persona informante no revelada, Persona informante no revelada, Persona informante no revelada, Persona informante no revelada | 10 de noviembre de 2004 | · | Presentación inicial | · | SEC |
| Persona informante no revelada, Persona informante no revelada, Persona informante no revelada, Persona informante no revelada | 17 de mayo de 2004 | · | Presentación inicial | · | SEC |
| Persona informante no revelada, Persona informante no revelada, Persona informante no revelada, Persona informante no revelada | 8 de marzo de 2004 | · | Presentación inicial | · | SEC |
| Persona informante no revelada, Persona informante no revelada, Persona informante no revelada, Persona informante no revelada | 2 de septiembre de 2003 | · | Presentación inicial | · | SEC |
| Persona informante no revelada, Persona informante no revelada, Persona informante no revelada, Persona informante no revelada | 17 de julio de 2003 | · | Presentación inicial | · | SEC |
| Persona informante no revelada, Persona informante no revelada, Persona informante no revelada, Persona informante no revelada | 30 de mayo de 2003 | · | Presentación inicial | · | SEC |
| Synopsys, Inc. IRS Identification Number: 561546236 | 22 de enero de 2003 | · | Presentación inicial | M&A / venta | SEC |
| Synopsys, Inc. 561546236 | 31 de julio de 2002 | · | Presentación inicial | M&A / venta | SEC |
| Persona informante no revelada, Persona informante no revelada, Persona informante no revelada, Persona informante no revelada | 24 de septiembre de 2001 | · | Presentación inicial | · | SEC |
| Persona informante no revelada, Persona informante no revelada, Persona informante no revelada, Persona informante no revelada | 2 de abril de 2001 | · | Presentación inicial | Inversión pasiva | SEC |
Purpose is an automated classification of the filer's own stated purpose (SEC Item 4) — not investment advice. "—" means no clear purpose was stated or the text could not be classified.
Informantes de la empresa 52 insiders · 14 directivos · 19 consejeros
| Insider | Rol | Última actividad | Acciones en propiedad | Compras 12m | Ventas 12m | Neto 12m |
|---|---|---|---|---|---|---|
| Sassine Ghazi | PRESIDENT AND CEO | 15 de octubre de 2026 M | 76 865 | 0 | 3 | $-18 936 256 |
| Chi-Foon Chan | Co-CEO | 28 de febrero de 2022 J | 155 120 | 0 | 0 | $0 |
| Sudhindra Kankanwadi | Deputy CFO & CAO | 6 de octubre de 2026 M | 22 717 | 0 | 2 | $-6 039 340 |
| Shelagh Glaser | CFO | 15 de junio de 2026 M | 1 452 | 0 | 3 | $-3 212 404 |
| Trac Pham | CFO | 31 de agosto de 2022 J | 39 849 | 0 | 0 | $0 |
| Janet Lee | GC & Corporate Secretary | 6 de octubre de 2026 S | 16 534 | 0 | 4 | $-834 886 |
| Aart De Geus | EXECUTIVE CHAIR | 1 de septiembre de 2026 M | 120 443 | 0 | 3 | $-32 518 171 |
| Michael Ellow | Chief Revenue Officer | 31 de agosto de 2026 J | 2 612 | 0 | 0 | $0 |
| Richard S. Mahoney | Chief Revenue Officer | 29 de agosto de 2025 J | 1 511 | 0 | 0 | $0 |
| John F Runkel JR | GC & Corporate Secretary | 15 de marzo de 2025 M | 23 383 | 0 | 0 | $0 |
| Joseph W Logan | Chief Revenue Officer | 31 de agosto de 2022 J | 99 945 | 0 | 0 | $0 |
| Brian M Beattie | EVP, Business Ops. & CAO | 28 de febrero de 2017 J | 39 794 | 0 | 0 | $0 |
| Esfandiar Naddaf | VP, Controller | 17 de junio de 2015 M | 6 866 | 0 | 0 | $0 |
| Brian E Cabrera | General Counsel & | 19 de diciembre de 2013 M | 10 000 | 0 | 0 | $0 |
| Jesse Cohn | Consejero | 1 de junio de 2026 A | 1 082 | 0 | 0 | $0 |
| Peter A Shimer | Consejero | 16 de abril de 2026 A | 1 378 | 0 | 0 | $0 |
| Ravi K Vijayaraghavan | Consejero | 16 de abril de 2026 A | 3 667 | 0 | 0 | $0 |
| Robert G Painter | Consejero | 16 de abril de 2026 A | 2 744 | 0 | 0 | $0 |
| Mercedes Johnson | Consejero | 16 de abril de 2026 A | 453 | 0 | 0 | $0 |
| Janice Chaffin | Consejero | 16 de abril de 2026 A | 15 622 | 0 | 0 | $0 |
| John Schwarz | Consejero | 16 de abril de 2026 A | 13 240 | 0 | 0 | $0 |
| CHIZEN BRUCE R | Consejero | 16 de abril de 2026 A | 16 162 | 0 | 0 | $0 |
| Ajei Gopal | Consejero | 11 de septiembre de 2025 A | 167 746 | 0 | 0 | $0 |
| Luis Borgen | Consejero | 10 de abril de 2025 A | 1 833 | 0 | 0 | $0 |
| Roy Vallee | Consejero | 10 de abril de 2024 A | 2 622 | 0 | 0 | $0 |
| Marc N Casper | Consejero | 10 de abril de 2024 A | 2 092 | 0 | 0 | $0 |
| Chrysostomos L Nikias | Consejero | 19 de agosto de 2022 S | 23 395 | 0 | 0 | $0 |
| Steven Walske | Consejero | 16 de diciembre de 2020 S | 2 784 | 0 | 0 | $0 |
| Deborah A Coleman | Consejero | 6 de abril de 2017 A | 31 472 | 0 | 0 | $0 |
| Alfred Castino | Consejero | 21 de febrero de 2017 S | 15 982 | 0 | 0 | $0 |
| Jeannine P Sargent | · | 16 de abril de 2026 A | 2 997 | 0 | 0 | $0 |
| Sasson Somekh | · | 1 de marzo de 2010 S | 21 745 | 0 | 0 | $0 |
| Deirdre Hanford | · | 9 de diciembre de 2008 S | 16 835 | 0 | 0 | $0 |
| Joachim Kunkel | · | 8 de diciembre de 2008 D | 8 472 | 0 | 0 | $0 |
| Paul (Sheng-Chun) Lo | · | 8 de diciembre de 2008 D | 13 447 | 0 | 0 | $0 |
| Manoj Gandhi | · | 8 de diciembre de 2008 D | 17 527 | 0 | 0 | $0 |
| Antun Domic | · | 8 de diciembre de 2008 D | 14 978 | 0 | 0 | $0 |
| Jan S Collinson | · | 8 de diciembre de 2008 D | 14 139 | 0 | 0 | $0 |
| John E Chilton | · | 8 de diciembre de 2008 D | 28 356 | 0 | 0 | $0 |
| Fu Hwa Ko | · | 29 de agosto de 2008 J | 5 192 | 0 | 0 | $0 |
| Gary Meyers | · | 16 de mayo de 2008 A | · | 0 | 0 | $0 |
| Geoffrey E Sloma | · | 4 de mayo de 2007 A | 4 471 | 0 | 0 | $0 |
| Wolfgang Fichtner | · | 14 de diciembre de 2006 J | · | 0 | 0 | $0 |
| Richard A Newton | · | 5 de diciembre de 2006 M | 14 762 | 0 | 0 | $0 |
| Raul Camposano | · | 31 de agosto de 2006 J | 29 399 | 0 | 0 | $0 |
| Vicki L Andrews | · | 2 de junio de 2006 S | 2 937 | 0 | 0 | $0 |
| Rex S Jackson | · | 6 de diciembre de 2005 J | 0 | 0 | 0 | $0 |
| Richard Rowley | · | 31 de agosto de 2005 J | 558 | 0 | 0 | $0 |
| Steven K Shevick | · | 28 de febrero de 2005 J | 9 875 | 0 | 0 | $0 |
| Jay N Greenberg | · | 17 de diciembre de 2004 J | · | 0 | 0 | $0 |
| Sanjiv Kaul | · | 4 de junio de 2004 M | 10 301 | 0 | 0 | $0 |
| Andy D Bryant | · | 26 de mayo de 2004 J | · | 0 | 0 | $0 |
Informantes de las presentaciones SEC Form 3/4/5; neto = solo P/S de mercado abierto
Propiedad de ETFs Mantenido por 163 ETFs
El peso refleja solo las tenencias directas de acciones (N-PORT); los fondos apalancados o basados en derivados pueden tener exposición adicional a swaps no mostrada.
| Fondo | Ponderación | Unidades | A fecha de | Fuente |
|---|---|---|---|---|
| PRNT · ARK ETF Trust | 4,66% | 7 030 NS | 31 de julio de 2026 | N-PORT |
| AIBU · Direxion Shares ETF Trust | 3,47% | 2 049 NS | 31 de julio de 2026 | N-PORT |
| IGV · iShares Trust | 2,62% | 876 884 SH | 11 de septiembre de 2026 | Diario |
| EPMV · Harbor ETF Trust | 2,13% | 257 NS | 31 de julio de 2026 | N-PORT |
| SOXY · Tidal Trust II | 1,88% | 3 100 NS | 31 de julio de 2026 | N-PORT |
| CHPY · Tidal Trust II | 1,88% | 49 487 NS | 31 de julio de 2026 | N-PORT |
| SEMI · Columbia ETF Trust I | 1,46% | 1 415 NS | 31 de julio de 2026 | N-PORT |
| QNXT · iShares Trust | 1,46% | 1 002 SH | 11 de septiembre de 2026 | Diario |
| RSPT · Invesco Exchange-Traded Fund Trust | 1,43% | 203 701 SH | 23 de octubre de 2026 | Diario |
| EPMB · Harbor ETF Trust | 1,42% | 167 NS | 31 de julio de 2026 | N-PORT |
| QQQG · Pacer Funds Trust | 1,26% | 660 NS | 31 de julio de 2026 | N-PORT |
| RILA · Spinnaker ETF Series | 1,18% | 1 278 NS | 31 de julio de 2026 | N-PORT |
| EPSV · Harbor ETF Trust | 1,18% | 184 NS | 31 de julio de 2026 | N-PORT |
| XPND · First Trust Exchange-Traded Fund VI… | 1,17% | 1 048 NS | 31 de agosto de 2026 | N-PORT |
| IETC · iShares U.S. ETF Trust | 1,02% | 17 596 SH | 11 de septiembre de 2026 | Diario |
| IGPT · Invesco Exchange-Traded Fund Trust | 1,01% | 30 821 SH | 23 de octubre de 2026 | Diario |
| SPHB · Invesco Exchange-Traded Fund Trust … | 0,97% | 18 515 SH | 23 de octubre de 2026 | Diario |
| ARKX · ARK ETF Trust | 0,97% | 18 862 NS | 31 de julio de 2026 | N-PORT |
| ARKQ · ARK ETF Trust | 0,93% | 44 205 NS | 31 de julio de 2026 | N-PORT |
| KNCT · Invesco Exchange-Traded Fund Trust | 0,89% | 3 117 SH | 23 de octubre de 2026 | Diario |
| QQQE · Direxion Shares ETF Trust | 0,83% | 28 579 NS | 31 de julio de 2026 | N-PORT |
| COWG · Pacer Funds Trust | 0,80% | 45 567 NS | 31 de julio de 2026 | N-PORT |
| EPSB · Harbor ETF Trust | 0,79% | 97 NS | 31 de julio de 2026 | N-PORT |
| ALTL · Pacer Funds Trust | 0,78% | 1 838 NS | 31 de julio de 2026 | N-PORT |
| NULC · Nushares ETF Trust | 0,76% | 1 383 NS | 31 de julio de 2026 | N-PORT |
| ESMV · iShares Trust | 0,65% | 128 SH | 11 de septiembre de 2026 | Diario |
| PEXL · Pacer Funds Trust | 0,61% | 794 NS | 31 de julio de 2026 | N-PORT |
| TRFM · ETF Series Solutions | 0,56% | 3 557 NS | 31 de julio de 2026 | N-PORT |
| HEQQ · J.P. Morgan Exchange-Traded Fund Tr… | 0,54% | 417 NS | 31 de julio de 2026 | N-PORT |
| HAPI · Harbor ETF Trust | 0,53% | 6 735 NS | 31 de julio de 2026 | N-PORT |
| BSCU · Invesco Exchange-Traded Self-Indexe… | 0,53% | 15 144 000 | 23 de octubre de 2026 | Diario |
| HIBL · Direxion Shares ETF Trust | 0,52% | 1 009 NS | 31 de julio de 2026 | N-PORT |
| FOWF · Pacer Funds Trust | 0,49% | 201 NS | 31 de julio de 2026 | N-PORT |
| ILDR · First Trust Exchange-Traded Fund VI… | 0,47% | 3 494 NS | 31 de agosto de 2026 | N-PORT |
| MGK · VANGUARD WORLD FUND | 0,45% | 335 094 SH | 19 de agosto de 2026 | Diario |
| PALC · Pacer Funds Trust | 0,45% | 2 419 NS | 31 de julio de 2026 | N-PORT |
| QIDX · Spinnaker ETF Series | 0,44% | 444 NS | 31 de julio de 2026 | N-PORT |
| XOEF · iShares Trust | 0,43% | 240 SH | 11 de septiembre de 2026 | Diario |
| IYW · iShares Trust | 0,37% | 231 168 SH | 11 de septiembre de 2026 | Diario |
| EVUS · iShares Trust | 0,36% | 3 452 SH | 11 de septiembre de 2026 | Diario |
| TECL · Direxion Shares ETF Trust | 0,36% | 46 800 NS | 31 de julio de 2026 | N-PORT |
| QQQ · Invesco QQQ Trust, Series 1 | 0,36% | 4 003 150 SH | 23 de octubre de 2026 | Diario |
| QQQM · Invesco Exchange-Traded Fund Trust … | 0,36% | 899 825 SH | 23 de octubre de 2026 | Diario |
| ACVF · ETF Opportunities Trust | 0,35% | 1 380 NS | 31 de julio de 2026 | N-PORT |
| VGT · VANGUARD WORLD FUND | 0,35% | 1 340 631 SH | 19 de agosto de 2026 | Diario |
| QYLD · Global X Funds | 0,35% | 72 341 NS | 31 de julio de 2026 | N-PORT |
| QYLG · Global X Funds | 0,34% | 1 393 NS | 31 de julio de 2026 | N-PORT |
| PTNQ · Pacer Funds Trust | 0,34% | 10 473 NS | 31 de julio de 2026 | N-PORT |
| QQWZ · Pacer Funds Trust | 0,34% | 445 NS | 31 de julio de 2026 | N-PORT |
| IGM · iShares Trust | 0,34% | 90 544 SH | 11 de septiembre de 2026 | Diario |
| QRMI · Global X Funds | 0,34% | 124 NS | 31 de julio de 2026 | N-PORT |
| QTR · Global X Funds | 0,34% | 66 NS | 31 de julio de 2026 | N-PORT |
| LRND · New York Life Investments ETF Trust | 0,34% | 3 438 NS | 31 de julio de 2026 | N-PORT |
| LCOW · Pacer Funds Trust | 0,34% | 223 NS | 31 de julio de 2026 | N-PORT |
| FTEC · FIDELITY COVINGTON TRUST | 0,33% | 168 340 NS | 31 de julio de 2026 | N-PORT |
| QCLR · Global X Funds | 0,33% | 28 NS | 31 de julio de 2026 | N-PORT |
| USMV · iShares Trust | 0,32% | 190 875 SH | 11 de septiembre de 2026 | Diario |
| SUSA · iShares Trust | 0,32% | 31 935 SH | 11 de septiembre de 2026 | Diario |
| QSIX · Pacer Funds Trust | 0,31% | 148 NS | 31 de julio de 2026 | N-PORT |
| USXF · iShares Trust | 0,29% | 10 811 SH | 11 de septiembre de 2026 | Diario |
| VOOV · VANGUARD ADMIRAL FUNDS | 0,29% | 44 106 SH | 19 de agosto de 2026 | Diario |
| IXN · iShares Trust | 0,28% | 65 403 SH | 11 de septiembre de 2026 | Diario |
| IWX · iShares Trust | 0,28% | 26 947 SH | 11 de septiembre de 2026 | Diario |
| JVAL · J.P. Morgan Exchange-Traded Fund Tr… | 0,27% | 5 684 NS | 31 de julio de 2026 | N-PORT |
| IVE · iShares Trust | 0,26% | 318 159 SH | 11 de septiembre de 2026 | Diario |
| JMOM · J.P. Morgan Exchange-Traded Fund Tr… | 0,25% | 16 304 NS | 31 de julio de 2026 | N-PORT |
| VUG · VANGUARD INDEX FUNDS | 0,25% | 2 133 397 SH | 19 de agosto de 2026 | Diario |
| VEGN · ETF Series Solutions | 0,25% | 1 126 NS | 31 de julio de 2026 | N-PORT |
| TYLG · Global X Funds | 0,24% | 89 NS | 31 de julio de 2026 | N-PORT |
| IUSV · iShares Trust | 0,24% | 167 401 SH | 11 de septiembre de 2026 | Diario |
| MNZL · EA Series Trust | 0,24% | 154 NS | 31 de julio de 2026 | N-PORT |
| VONV · VANGUARD SCOTTSDALE FUNDS | 0,23% | 112 452 SH | 19 de agosto de 2026 | Diario |
| BSCR · Invesco Exchange-Traded Self-Indexe… | 0,23% | 10 388 000 | 23 de octubre de 2026 | Diario |
| BSCS · Invesco Exchange-Traded Self-Indexe… | 0,23% | 8 117 000 | 23 de octubre de 2026 | Diario |
| USSG · DBX ETF Trust | 0,23% | 3 040 NS | 31 de agosto de 2026 | N-PORT |
| IQSU · New York Life Investments ETF Trust | 0,22% | 1 859 NS | 31 de julio de 2026 | N-PORT |
| NULV · Nushares ETF Trust | 0,22% | 12 305 NS | 31 de julio de 2026 | N-PORT |
| ESGU · iShares Trust | 0,22% | 97 316 SH | 11 de septiembre de 2026 | Diario |
| SUSL · iShares Trust | 0,21% | 6 420 SH | 11 de septiembre de 2026 | Diario |
| RSP · Invesco Exchange-Traded Fund Trust | 0,21% | 499 311 SH | 23 de octubre de 2026 | Diario |
| HLAL · Listed Funds Trust | 0,21% | 4 457 NS | 31 de agosto de 2026 | N-PORT |
| DSI · iShares Trust | 0,20% | 27 802 SH | 11 de septiembre de 2026 | Diario |
| EUSA · iShares, Inc. | 0,20% | 9 725 SH | 11 de septiembre de 2026 | Diario |
| IWD · iShares Trust | 0,20% | 413 939 SH | 11 de septiembre de 2026 | Diario |
| SPTE · SP Funds Trust | 0,20% | 1 077 NS | 31 de julio de 2026 | N-PORT |
| MPLY · Strategy Shares | 0,18% | 73 NS | 31 de julio de 2026 | N-PORT |
| DFUV · Dimensional ETF Trust | 0,18% | 69 668 NS | 31 de julio de 2026 | N-PORT |
| GLBL · Pacer Funds Trust | 0,18% | 5 NS | 31 de julio de 2026 | N-PORT |
| FTC · First Trust Exchange-Traded AlphaDE… | 0,17% | 5 610 NS | 31 de julio de 2026 | N-PORT |
| MGC · VANGUARD WORLD FUND | 0,16% | 38 226 SH | 19 de agosto de 2026 | Diario |
| ESGG · FlexShares Trust | 0,15% | 418 NS | 31 de julio de 2026 | N-PORT |
| SIZE · iShares Trust | 0,15% | 1 572 SH | 11 de septiembre de 2026 | Diario |
| ILCG · iShares Trust | 0,14% | 11 294 SH | 11 de septiembre de 2026 | Diario |
| TOPC · iShares Trust | 0,14% | 117 SH | 11 de septiembre de 2026 | Diario |
| ESGV · VANGUARD WORLD FUND | 0,14% | 42 110 SH | 19 de agosto de 2026 | Diario |
| USCL · iShares Trust | 0,14% | 9 630 SH | 11 de septiembre de 2026 | Diario |
| IWL · iShares Trust | 0,13% | 7 218 SH | 11 de septiembre de 2026 | Diario |
| VOO · VANGUARD INDEX FUNDS | 0,13% | 4 976 925 SH | 19 de agosto de 2026 | Diario |
| VV · VANGUARD INDEX FUNDS | 0,13% | 223 632 SH | 19 de agosto de 2026 | Diario |
| XVV · iShares Trust | 0,13% | 2 199 SH | 11 de septiembre de 2026 | Diario |
| SPXD · DBX ETF Trust | 0,13% | 21 NS | 31 de agosto de 2026 | N-PORT |
| PBP · Invesco Exchange-Traded Fund Trust | 0,12% | 1 148 SH | 23 de octubre de 2026 | Diario |
| CATH · Global X Funds | 0,12% | 4 093 NS | 31 de julio de 2026 | N-PORT |
| XTR · Global X Funds | 0,12% | 15 NS | 31 de julio de 2026 | N-PORT |
| VTI · VANGUARD INDEX FUNDS | 0,12% | 6 079 993 SH | 19 de agosto de 2026 | Diario |
| VONE · VANGUARD SCOTTSDALE FUNDS | 0,12% | 30 718 SH | 19 de agosto de 2026 | Diario |
| XCLR · Global X Funds | 0,12% | 11 NS | 31 de julio de 2026 | N-PORT |
| WRND · New York Life Investments ETF Trust | 0,12% | 32 NS | 31 de julio de 2026 | N-PORT |
| XYLD · Global X Funds | 0,12% | 9 924 NS | 31 de julio de 2026 | N-PORT |
| ACIO · ETF Series Solutions | 0,12% | 7 183 NS | 31 de julio de 2026 | N-PORT |
| DFSU · Dimensional ETF Trust | 0,12% | 6 934 NS | 31 de julio de 2026 | N-PORT |
| PBUS · Invesco Exchange-Traded Fund Trust … | 0,12% | 29 285 SH | 23 de octubre de 2026 | Diario |
| CHRI · Global X Funds | 0,12% | 24 NS | 31 de julio de 2026 | N-PORT |
| ADME · ETF Series Solutions | 0,12% | 878 NS | 31 de julio de 2026 | N-PORT |
| IVV · iShares Trust | 0,12% | 2 414 753 SH | 11 de septiembre de 2026 | Diario |
| APUE · Trust for Professional Managers | 0,12% | 6 566 NS | 31 de agosto de 2026 | N-PORT |
| PTLC · Pacer Funds Trust | 0,12% | 9 697 NS | 31 de julio de 2026 | N-PORT |
| BBUS · J.P. Morgan Exchange-Traded Fund Tr… | 0,12% | 26 368 NS | 31 de julio de 2026 | N-PORT |
| XRMI · Global X Funds | 0,12% | 148 NS | 31 de julio de 2026 | N-PORT |
| ILCB · iShares Trust | 0,12% | 3 732 SH | 11 de septiembre de 2026 | Diario |
| BKLC · BNY Mellon ETF Trust | 0,11% | 16 136 NS | 31 de julio de 2026 | N-PORT |
| VOTE · TCW ETF Trust | 0,11% | 3 234 NS | 31 de julio de 2026 | N-PORT |
| XYLG · Global X Funds | 0,11% | 185 NS | 31 de julio de 2026 | N-PORT |
| VTHR · VANGUARD SCOTTSDALE FUNDS | 0,11% | 15 685 SH | 19 de agosto de 2026 | Diario |
| TOV · EA Series Trust | 0,11% | 737 NS | 31 de julio de 2026 | N-PORT |
| IYY · iShares Trust | 0,11% | 8 260 SH | 11 de septiembre de 2026 | Diario |
| SPUU · Direxion Shares ETF Trust | 0,11% | 723 NS | 31 de julio de 2026 | N-PORT |
| ESG · FlexShares Trust | 0,11% | 360 NS | 31 de julio de 2026 | N-PORT |
| IWB · iShares Trust | 0,11% | 128 578 SH | 11 de septiembre de 2026 | Diario |
| QDPL · Pacer Funds Trust | 0,10% | 4 593 NS | 31 de julio de 2026 | N-PORT |
| ITOT · iShares Trust | 0,10% | 249 353 SH | 11 de septiembre de 2026 | Diario |
| PHDG · Invesco Actively Managed Exchange-T… | 0,10% | 151 SH | 23 de octubre de 2026 | Diario |
| IWV · iShares Trust | 0,10% | 51 185 SH | 11 de septiembre de 2026 | Diario |
| VOXP · Advisors Series Trust | 0,10% | 15 NS | 31 de julio de 2026 | N-PORT |
| DFLV · Dimensional ETF Trust | 0,10% | 16 684 NS | 31 de julio de 2026 | N-PORT |
| HCMT · Direxion Shares ETF Trust | 0,09% | 1 335 NS | 31 de julio de 2026 | N-PORT |
| KOKU · DBX ETF Trust | 0,09% | 1 701 NS | 31 de agosto de 2026 | N-PORT |
| ILCV · iShares Trust | 0,09% | 2 928 SH | 11 de septiembre de 2026 | Diario |
| PFIG · Invesco Exchange-Traded Fund Trust … | 0,09% | 115 000 | 23 de octubre de 2026 | Diario |
| SPXL · Direxion Shares ETF Trust | 0,09% | 14 975 NS | 31 de julio de 2026 | N-PORT |
| DFUS · Dimensional ETF Trust | 0,09% | 45 936 NS | 31 de julio de 2026 | N-PORT |
| TOK · iShares Trust | 0,09% | 508 SH | 11 de septiembre de 2026 | Diario |
| FAD · First Trust Exchange-Traded AlphaDE… | 0,08% | 1 218 NS | 31 de julio de 2026 | N-PORT |
| XT · iShares Trust | 0,08% | 7 791 SH | 11 de septiembre de 2026 | Diario |
| URTH · iShares, Inc. | 0,08% | 16 349 SH | 11 de septiembre de 2026 | Diario |
| DFAU · Dimensional ETF Trust | 0,08% | 24 714 NS | 31 de julio de 2026 | N-PORT |
| TILT · FlexShares Trust | 0,08% | 4 266 NS | 31 de julio de 2026 | N-PORT |
| GSY · Invesco Actively Managed Exchange-T… | 0,07% | 3 000 000 | 23 de octubre de 2026 | Diario |
| DFAC · Dimensional ETF Trust | 0,07% | 90 748 NS | 31 de julio de 2026 | N-PORT |
| CRBN · iShares Trust | 0,07% | 2 061 SH | 11 de septiembre de 2026 | Diario |
| VT · VANGUARD INTERNATIONAL EQUITY INDEX… | 0,07% | 156 241 SH | 19 de agosto de 2026 | Diario |
| ACWI · iShares Trust | 0,07% | 58 018 SH | 11 de septiembre de 2026 | Diario |
| EQAL · Invesco Exchange-Traded Fund Trust … | 0,07% | 1 269 SH | 23 de octubre de 2026 | Diario |
| PWS · Pacer Funds Trust | 0,06% | 40 NS | 31 de julio de 2026 | N-PORT |
| PRF · Invesco Exchange-Traded Fund Trust | 0,06% | 13 925 SH | 23 de octubre de 2026 | Diario |
| DCOR · Dimensional ETF Trust | 0,06% | 4 735 NS | 31 de julio de 2026 | N-PORT |
| RWL · Invesco Exchange-Traded Fund Trust … | 0,05% | 12 097 SH | 23 de octubre de 2026 | Diario |
| PEVC · Pacer Funds Trust | 0,05% | 3 NS | 31 de julio de 2026 | N-PORT |
| QARP · DBX ETF Trust | 0,04% | 77 NS | 31 de agosto de 2026 | N-PORT |
| DXUV · Dimensional ETF Trust | 0,04% | 584 NS | 31 de julio de 2026 | N-PORT |
| NPFE · Elevation Series Trust | 0,00% | 13 NS | 31 de julio de 2026 | N-PORT |
| FTLS · First Trust Exchange-Traded Fund III | -0,33% | -21 220 NS | 31 de julio de 2026 | N-PORT |
| CLSE · Trust for Professional Managers | -0,49% | -10 005 NS | 31 de agosto de 2026 | N-PORT |
SNPS Consenso de analistas Opiniones de analistas alcistas y bajistas, precio objetivo a 12 meses, potencial alcista
Precio objetivo a 12 meses
25 analistas · 2026-10-25Objetivo medio $586.95 +36,5%
Comparación de pares (subindustria GICS) Métricas clave frente a competidores del sector
Base del ejercicio fiscal, precios al cierre del último ejercicio fiscal de cada empresa.
| Ticker | Capitalización Bursátil | P/E | Ingresos interanuales | Margen Neto | ROE | Margen Bruto |
|---|---|---|---|---|---|---|
| SNPS | $84.41B | 56.4 | 15.1% | 18.9% | 7.1% | 77.0% |
| ADBE | $132.21B | 19.2 | 10.5% | 30.0% | 61.8% | 89.3% |
| DDOG | $47.94B | 438.7 | 27.7% | 3.1% | 3.1% | 80.0% |
| INTU | $84.83B | 19.2 | 13.9% | 21.3% | 24.0% | · |
| CDNS | $84.96B | 77.0 | 14.1% | 20.9% | 21.2% | · |
| APP | $227.96B | 69.1 | 70.0% | 60.8% | 201.9% | · |
| MSTR | · | -10.0 | 3.0% | -806.3% | -8.4% | 68.7% |
| ADSK | $53.90B | 48.6 | 17.5% | 15.6% | 39.0% | 91.0% |
| WDAY | $45.51B | 67.8 | 13.1% | 7.3% | 8.2% | · |
| ROP | $47.45B | 31.3 | 12.3% | 19.4% | 7.8% | 69.2% |
| PLTR | $425.03B | 282.1 | 56.2% | 36.3% | 26.2% | 82.4% |
Últimas noticias Noticias recientes que mencionan a esta empresa
Señales de trading Señales recientes de compra/venta con precio de entrada y ratio riesgo/recompensa
Ninguna señal abierta en este momento — ninguna tarjeta está completada, y eso es honesto.
Mis Métricas Tu lista de seguimiento personal — filas seleccionadas de Fundamentales Completos
Seleccione las métricas que le importan: haga clic en el + junto a cualquier fila en Fundamentales completos arriba.
Tu selección se guarda y te sigue en todos los tickers.